
|
|||||
|
 | |
| |
| |
| |
| |
| |
|
Gene: TRIP10 |
Gene summary for TRIP10 |
| Gene information | Species | Human | Gene symbol | TRIP10 | Gene ID | 9322 |
| Gene name | thyroid hormone receptor interactor 10 | |
| Gene Alias | CIP4 | |
| Cytomap | 19p13.3 | |
| Gene Type | protein-coding | GO ID | GO:0006810 | UniProtAcc | Q15642 |
Top |
Malignant transformation analysis |
| Identification of the aberrant gene expression in precancerous and cancerous lesions by comparing the gene expression of stem-like cells in diseased tissues with normal stem cells |
| Entrez ID | Symbol | Replicates | Species | Organ | Tissue | Adj P-value | Log2FC | Malignancy |
| 9322 | TRIP10 | LZE4T | Human | Esophagus | ESCC | 3.46e-06 | -7.02e-02 | 0.0811 |
| 9322 | TRIP10 | LZE8T | Human | Esophagus | ESCC | 3.55e-03 | 4.39e-02 | 0.067 |
| 9322 | TRIP10 | LZE22D1 | Human | Esophagus | HGIN | 1.26e-05 | 1.31e-01 | 0.0595 |
| 9322 | TRIP10 | LZE24T | Human | Esophagus | ESCC | 3.48e-04 | 3.61e-01 | 0.0596 |
| 9322 | TRIP10 | LZE21T | Human | Esophagus | ESCC | 8.70e-07 | 8.11e-02 | 0.0655 |
| 9322 | TRIP10 | P1T-E | Human | Esophagus | ESCC | 2.85e-05 | 9.60e-01 | 0.0875 |
| 9322 | TRIP10 | P2T-E | Human | Esophagus | ESCC | 4.04e-14 | -6.35e-02 | 0.1177 |
| 9322 | TRIP10 | P4T-E | Human | Esophagus | ESCC | 1.61e-15 | 1.64e-02 | 0.1323 |
| 9322 | TRIP10 | P5T-E | Human | Esophagus | ESCC | 3.14e-18 | 2.77e-01 | 0.1327 |
| 9322 | TRIP10 | P8T-E | Human | Esophagus | ESCC | 1.85e-48 | 1.12e+00 | 0.0889 |
| 9322 | TRIP10 | P9T-E | Human | Esophagus | ESCC | 1.77e-07 | 5.76e-02 | 0.1131 |
| 9322 | TRIP10 | P10T-E | Human | Esophagus | ESCC | 7.58e-08 | 1.21e-01 | 0.116 |
| 9322 | TRIP10 | P11T-E | Human | Esophagus | ESCC | 2.45e-02 | 9.98e-02 | 0.1426 |
| 9322 | TRIP10 | P12T-E | Human | Esophagus | ESCC | 4.05e-17 | 1.21e-01 | 0.1122 |
| 9322 | TRIP10 | P15T-E | Human | Esophagus | ESCC | 2.16e-09 | 1.47e-01 | 0.1149 |
| 9322 | TRIP10 | P16T-E | Human | Esophagus | ESCC | 2.36e-14 | -1.02e-01 | 0.1153 |
| 9322 | TRIP10 | P17T-E | Human | Esophagus | ESCC | 2.46e-10 | 1.66e-01 | 0.1278 |
| 9322 | TRIP10 | P20T-E | Human | Esophagus | ESCC | 4.31e-11 | 2.22e-02 | 0.1124 |
| 9322 | TRIP10 | P21T-E | Human | Esophagus | ESCC | 4.53e-13 | 1.91e-01 | 0.1617 |
| 9322 | TRIP10 | P22T-E | Human | Esophagus | ESCC | 1.66e-08 | -1.82e-01 | 0.1236 |
| Page: 1 2 3 4 5 |
| Tissue | Expression Dynamics | Abbreviation |
| Esophagus |  | ESCC: Esophageal squamous cell carcinoma |
| HGIN: High-grade intraepithelial neoplasias | ||
| LGIN: Low-grade intraepithelial neoplasias | ||
| Oral Cavity | 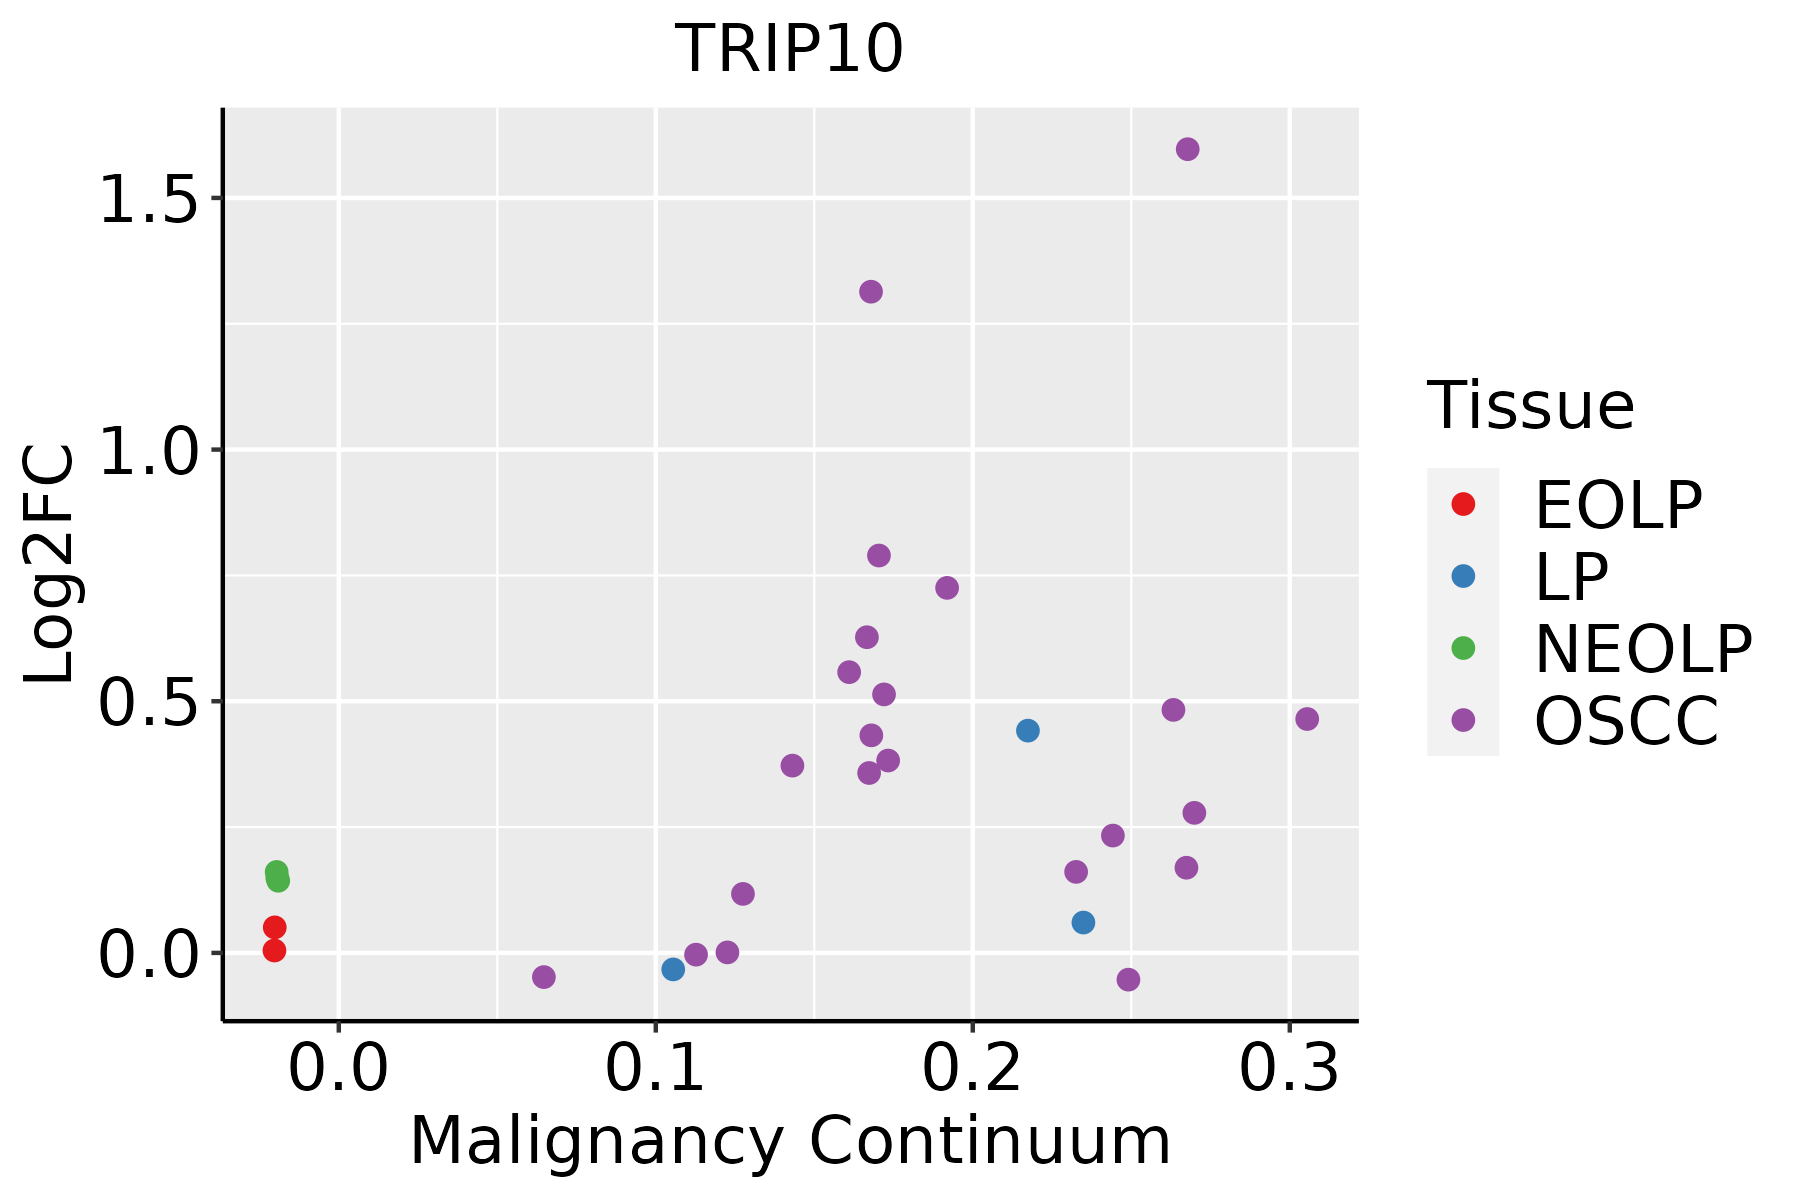 | EOLP: Erosive Oral lichen planus |
| LP: leukoplakia | ||
| NEOLP: Non-erosive oral lichen planus | ||
| OSCC: Oral squamous cell carcinoma | ||
| Thyroid |  | ATC: Anaplastic thyroid cancer |
| HT: Hashimoto's thyroiditis | ||
| PTC: Papillary thyroid cancer |
| ∗log2FC in expression of this searched gene in stem-like cells from each diseased tissue sample relative to stem-like cells in normal samples in each tissue plotted against the malignancy continuum. Samples are colored based on if they are from different disease stage. |
Top |
Malignant transformation related pathway analysis |
| Find out the enriched GO biological processes and KEGG pathways involved in transition from healthy to precancer to cancer |
| Tissue | Disease Stage | Enriched GO biological Processes |
| Colorectum | AD |  |
| Colorectum | SER |  |
| Colorectum | MSS |  |
| Colorectum | MSI-H |  |
| Colorectum | FAP |  |
| ∗Top 15 enriched GO BP terms are showed in the bar plot of each disease state in each tissue. Each row represents a significant GO biological process which is colored according to the -log10(p.adjust). |
| Page: 1 2 3 4 5 6 7 8 9 |
| GO ID | Tissue | Disease Stage | Description | Gene Ratio | Bg Ratio | pvalue | p.adjust | Count |
| Page: 1 |
| Pathway ID | Tissue | Disease Stage | Description | Gene Ratio | Bg Ratio | pvalue | p.adjust | qvalue | Count |
| hsa049109 | Esophagus | ESCC | Insulin signaling pathway | 89/4205 | 137/8465 | 1.97e-04 | 7.32e-04 | 3.75e-04 | 89 |
| hsa0491014 | Esophagus | ESCC | Insulin signaling pathway | 89/4205 | 137/8465 | 1.97e-04 | 7.32e-04 | 3.75e-04 | 89 |
| hsa049108 | Oral cavity | OSCC | Insulin signaling pathway | 83/3704 | 137/8465 | 4.83e-05 | 2.00e-04 | 1.02e-04 | 83 |
| hsa0491013 | Oral cavity | OSCC | Insulin signaling pathway | 83/3704 | 137/8465 | 4.83e-05 | 2.00e-04 | 1.02e-04 | 83 |
| Page: 1 |
Top |
Cell-cell communication analysis |
| Identification of potential cell-cell interactions between two cell types and their ligand-receptor pairs for different disease states |
| Ligand | Receptor | LRpair | Pathway | Tissue | Disease Stage |
| Page: 1 |
Top |
Single-cell gene regulatory network inference analysis |
| Find out the significant the regulons (TFs) and the target genes of each regulon across cell types for different disease states |
| TF | Cell Type | Tissue | Disease Stage | Target Gene | RSS | Regulon Activity |
| TRIP10 | M1MAC | Oral cavity | EOLP | FSCN1,BIRC3,EBI3, etc. | 9.85e-02 |  |
| TRIP10 | M1MAC | Oral cavity | LP | FSCN1,BIRC3,EBI3, etc. | 1.91e-01 |  |
| TRIP10 | M1MAC | Oral cavity | OSCC | FSCN1,BIRC3,EBI3, etc. | 1.36e-01 |  |
| ∗The dot plots of a searched regulon are shown for all cell subpopulations in each disease state of each tissue based on the regulon specific score inferred using pySCENIC and by calculating the average expression. |
| Page: 1 |
Top |
Somatic mutation of malignant transformation related genes |
| Annotation of somatic variants for genes involved in malignant transformation |
| Hugo Symbol | Variant Class | Variant Classification | dbSNP RS | HGVSc | HGVSp | HGVSp Short | SWISSPROT | BIOTYPE | SIFT | PolyPhen | Tumor Sample Barcode | Tissue | Histology | Sex | Age | Stage | Therapy Types | Drugs | Outcome |
| TRIP10 | SNV | Missense_Mutation | novel | c.1735N>C | p.Thr579Pro | p.T579P | Q15642 | protein_coding | deleterious(0) | probably_damaging(0.995) | TCGA-A2-A0T5-01 | Breast | breast invasive carcinoma | Female | <65 | I/II | Unspecific | Taxotere | SD |
| TRIP10 | SNV | Missense_Mutation | rs201968771 | c.1603G>A | p.Glu535Lys | p.E535K | Q15642 | protein_coding | deleterious(0.04) | possibly_damaging(0.905) | TCGA-BH-A1EX-01 | Breast | breast invasive carcinoma | Female | >=65 | I/II | Unknown | Unknown | PD |
| TRIP10 | SNV | Missense_Mutation | novel | c.16N>C | p.Glu6Gln | p.E6Q | Q15642 | protein_coding | tolerated(0.06) | benign(0.024) | TCGA-C8-A8HQ-01 | Breast | breast invasive carcinoma | Female | <65 | I/II | Unknown | Unknown | SD |
| TRIP10 | SNV | Missense_Mutation | c.1576N>G | p.Ile526Val | p.I526V | Q15642 | protein_coding | tolerated(0.37) | possibly_damaging(0.651) | TCGA-D8-A1XK-01 | Breast | breast invasive carcinoma | Female | <65 | I/II | Chemotherapy | doxorubicine+cyclophosphamide | SD | |
| TRIP10 | SNV | Missense_Mutation | c.1628N>T | p.Gly543Val | p.G543V | Q15642 | protein_coding | deleterious(0) | probably_damaging(0.997) | TCGA-E2-A14O-01 | Breast | breast invasive carcinoma | Female | >=65 | III/IV | Hormone Therapy | arimidex | SD | |
| TRIP10 | deletion | Frame_Shift_Del | c.589delN | p.Phe197SerfsTer48 | p.F197Sfs*48 | Q15642 | protein_coding | TCGA-BH-A1FL-01 | Breast | breast invasive carcinoma | Female | >=65 | I/II | Unknown | Unknown | PD | |||
| TRIP10 | insertion | Frame_Shift_Ins | novel | c.1752dupA | p.Glu585ArgfsTer47 | p.E585Rfs*47 | Q15642 | protein_coding | TCGA-C8-A12Z-01 | Breast | breast invasive carcinoma | Female | <65 | I/II | Chemotherapy | 5-fluorouracil | CR | ||
| TRIP10 | deletion | Frame_Shift_Del | novel | c.1228delN | p.Arg410AlafsTer15 | p.R410Afs*15 | Q15642 | protein_coding | TCGA-EW-A2FV-01 | Breast | breast invasive carcinoma | Female | <65 | III/IV | Chemotherapy | docetaxel | SD | ||
| TRIP10 | SNV | Missense_Mutation | c.424N>C | p.Glu142Gln | p.E142Q | Q15642 | protein_coding | deleterious(0) | benign(0.093) | TCGA-DG-A2KK-01 | Cervix | cervical & endocervical cancer | Female | <65 | III/IV | Chemotherapy | cisplatin | SD | |
| TRIP10 | SNV | Missense_Mutation | novel | c.1613N>T | p.Pro538Leu | p.P538L | Q15642 | protein_coding | tolerated(0.08) | benign(0.09) | TCGA-DS-A3LQ-01 | Cervix | cervical & endocervical cancer | Female | <65 | III/IV | Chemotherapy | cisplatin | SD |
| Page: 1 2 3 4 5 6 7 |
Top |
Related drugs of malignant transformation related genes |
| Identification of chemicals and drugs interact with genes involved in malignant transfromation |
| (DGIdb 4.0) |
| Entrez ID | Symbol | Category | Interaction Types | Drug Claim Name | Drug Name | PMIDs |
| Page: 1 |

Copyright 2023-Present -The University of Texas Health Science Center at Houston |