
|
|||||
|
 | |
| |
| |
| |
| |
| |
|
Gene: TRIOBP |
Gene summary for TRIOBP |
| Gene information | Species | Human | Gene symbol | TRIOBP | Gene ID | 11078 |
| Gene name | TRIO and F-actin binding protein | |
| Gene Alias | DFNB28 | |
| Cytomap | 22q13.1 | |
| Gene Type | protein-coding | GO ID | GO:0000902 | UniProtAcc | Q9H2D6 |
Top |
Malignant transformation analysis |
| Identification of the aberrant gene expression in precancerous and cancerous lesions by comparing the gene expression of stem-like cells in diseased tissues with normal stem cells |
| Entrez ID | Symbol | Replicates | Species | Organ | Tissue | Adj P-value | Log2FC | Malignancy |
| 11078 | TRIOBP | HTA11_3410_2000001011 | Human | Colorectum | AD | 9.02e-09 | 3.30e-01 | 0.0155 |
| 11078 | TRIOBP | HTA11_2487_2000001011 | Human | Colorectum | SER | 5.42e-21 | 7.92e-01 | -0.1808 |
| 11078 | TRIOBP | HTA11_1938_2000001011 | Human | Colorectum | AD | 3.11e-25 | 8.70e-01 | -0.0811 |
| 11078 | TRIOBP | HTA11_78_2000001011 | Human | Colorectum | AD | 2.03e-17 | 7.52e-01 | -0.1088 |
| 11078 | TRIOBP | HTA11_347_2000001011 | Human | Colorectum | AD | 4.50e-25 | 7.48e-01 | -0.1954 |
| 11078 | TRIOBP | HTA11_411_2000001011 | Human | Colorectum | SER | 8.01e-07 | 1.13e+00 | -0.2602 |
| 11078 | TRIOBP | HTA11_2112_2000001011 | Human | Colorectum | SER | 7.38e-07 | 7.27e-01 | -0.2196 |
| 11078 | TRIOBP | HTA11_3361_2000001011 | Human | Colorectum | AD | 4.63e-08 | 5.49e-01 | -0.1207 |
| 11078 | TRIOBP | HTA11_83_2000001011 | Human | Colorectum | SER | 1.57e-13 | 7.05e-01 | -0.1526 |
| 11078 | TRIOBP | HTA11_696_2000001011 | Human | Colorectum | AD | 9.41e-29 | 8.14e-01 | -0.1464 |
| 11078 | TRIOBP | HTA11_866_2000001011 | Human | Colorectum | AD | 2.31e-29 | 8.13e-01 | -0.1001 |
| 11078 | TRIOBP | HTA11_1391_2000001011 | Human | Colorectum | AD | 3.51e-19 | 8.10e-01 | -0.059 |
| 11078 | TRIOBP | HTA11_5212_2000001011 | Human | Colorectum | AD | 3.67e-08 | 6.77e-01 | -0.2061 |
| 11078 | TRIOBP | HTA11_546_2000001011 | Human | Colorectum | AD | 1.98e-10 | 7.76e-01 | -0.0842 |
| 11078 | TRIOBP | HTA11_866_3004761011 | Human | Colorectum | AD | 6.54e-21 | 6.20e-01 | 0.096 |
| 11078 | TRIOBP | HTA11_4255_2000001011 | Human | Colorectum | SER | 1.97e-03 | 5.83e-01 | 0.0446 |
| 11078 | TRIOBP | HTA11_8622_2000001021 | Human | Colorectum | SER | 1.06e-04 | 5.89e-01 | 0.0528 |
| 11078 | TRIOBP | HTA11_7663_2000001011 | Human | Colorectum | SER | 2.05e-05 | 8.94e-01 | 0.0131 |
| 11078 | TRIOBP | HTA11_10623_2000001011 | Human | Colorectum | AD | 3.63e-12 | 7.97e-01 | -0.0177 |
| 11078 | TRIOBP | HTA11_10711_2000001011 | Human | Colorectum | AD | 4.94e-15 | 8.09e-01 | 0.0338 |
| Page: 1 2 3 4 5 6 7 |
| Tissue | Expression Dynamics | Abbreviation |
| Colorectum (GSE201348) |  | FAP: Familial adenomatous polyposis |
| CRC: Colorectal cancer | ||
| Colorectum (HTA11) |  | AD: Adenomas |
| SER: Sessile serrated lesions | ||
| MSI-H: Microsatellite-high colorectal cancer | ||
| MSS: Microsatellite stable colorectal cancer | ||
| Esophagus | 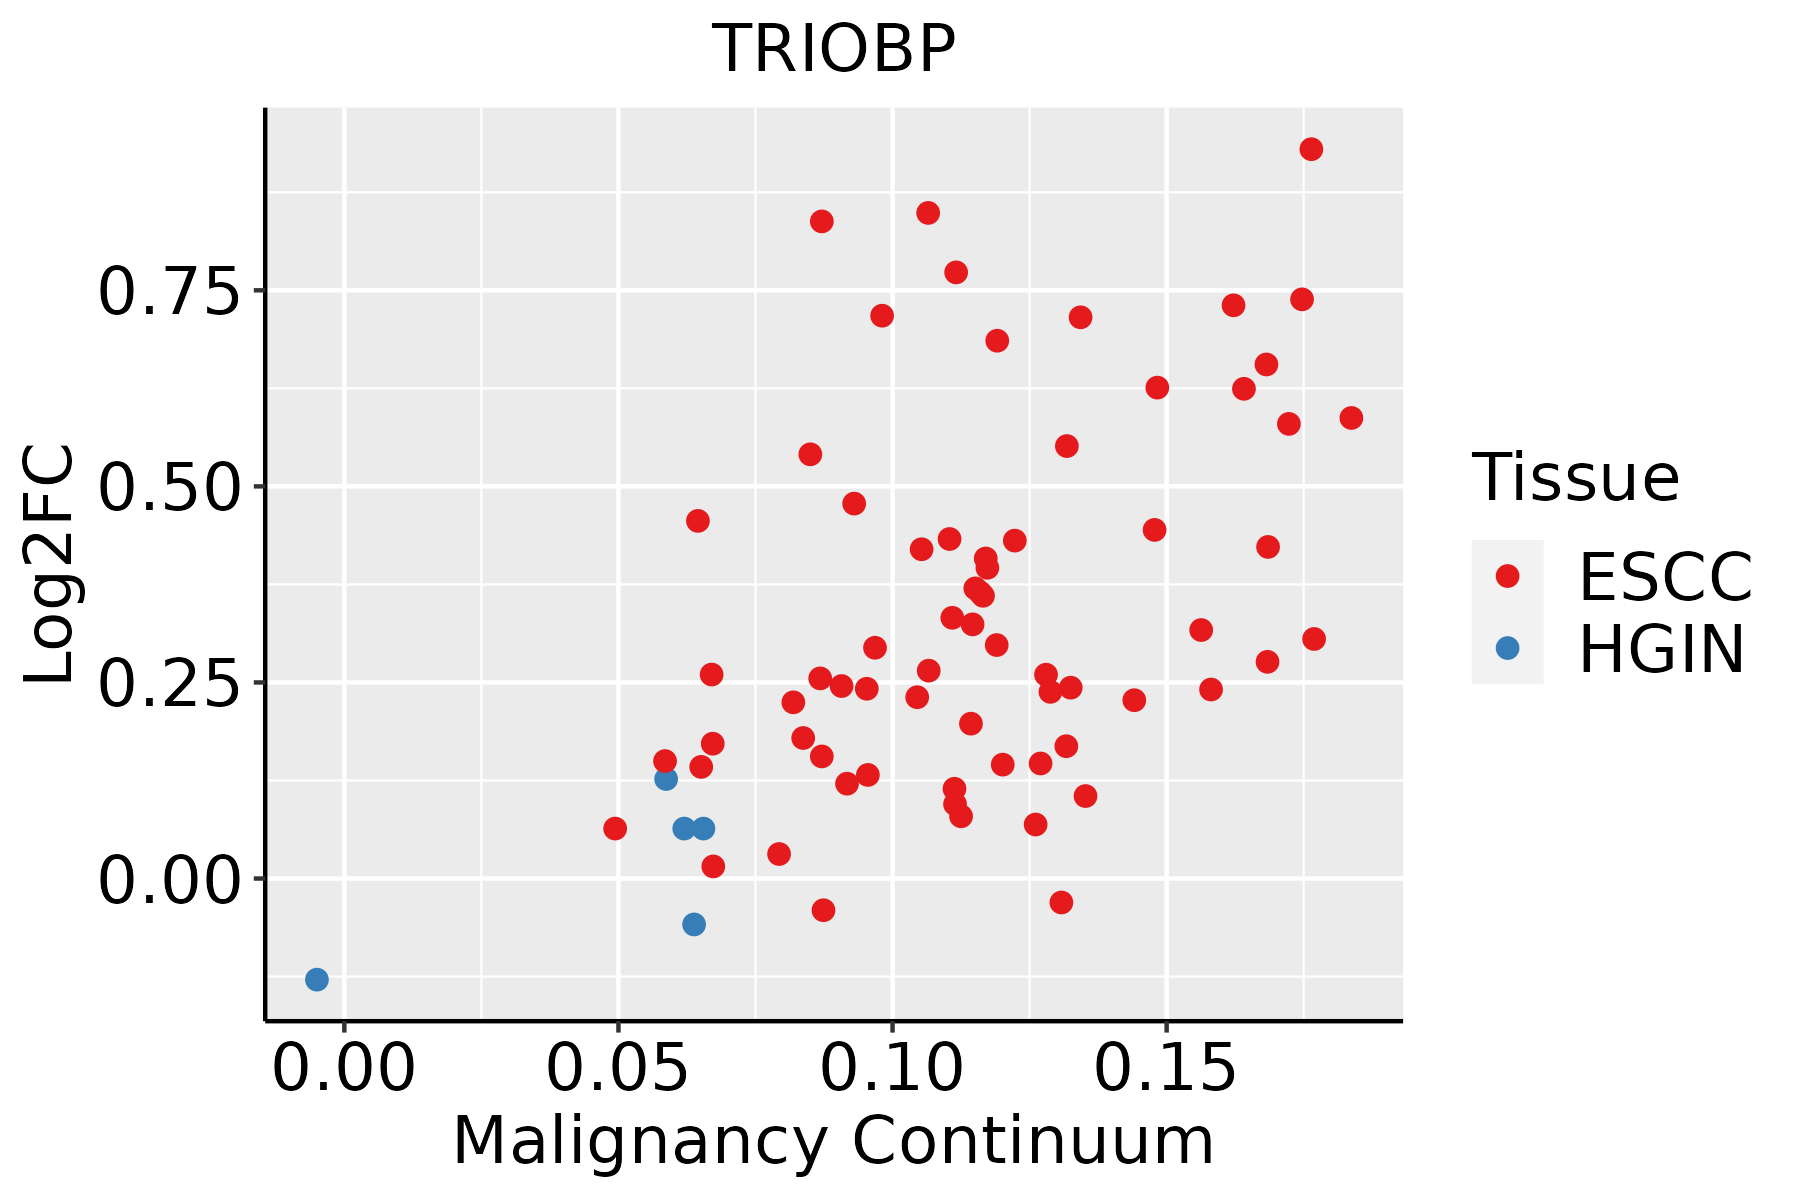 | ESCC: Esophageal squamous cell carcinoma |
| HGIN: High-grade intraepithelial neoplasias | ||
| LGIN: Low-grade intraepithelial neoplasias | ||
| Liver |  | HCC: Hepatocellular carcinoma |
| NAFLD: Non-alcoholic fatty liver disease | ||
| Oral Cavity | 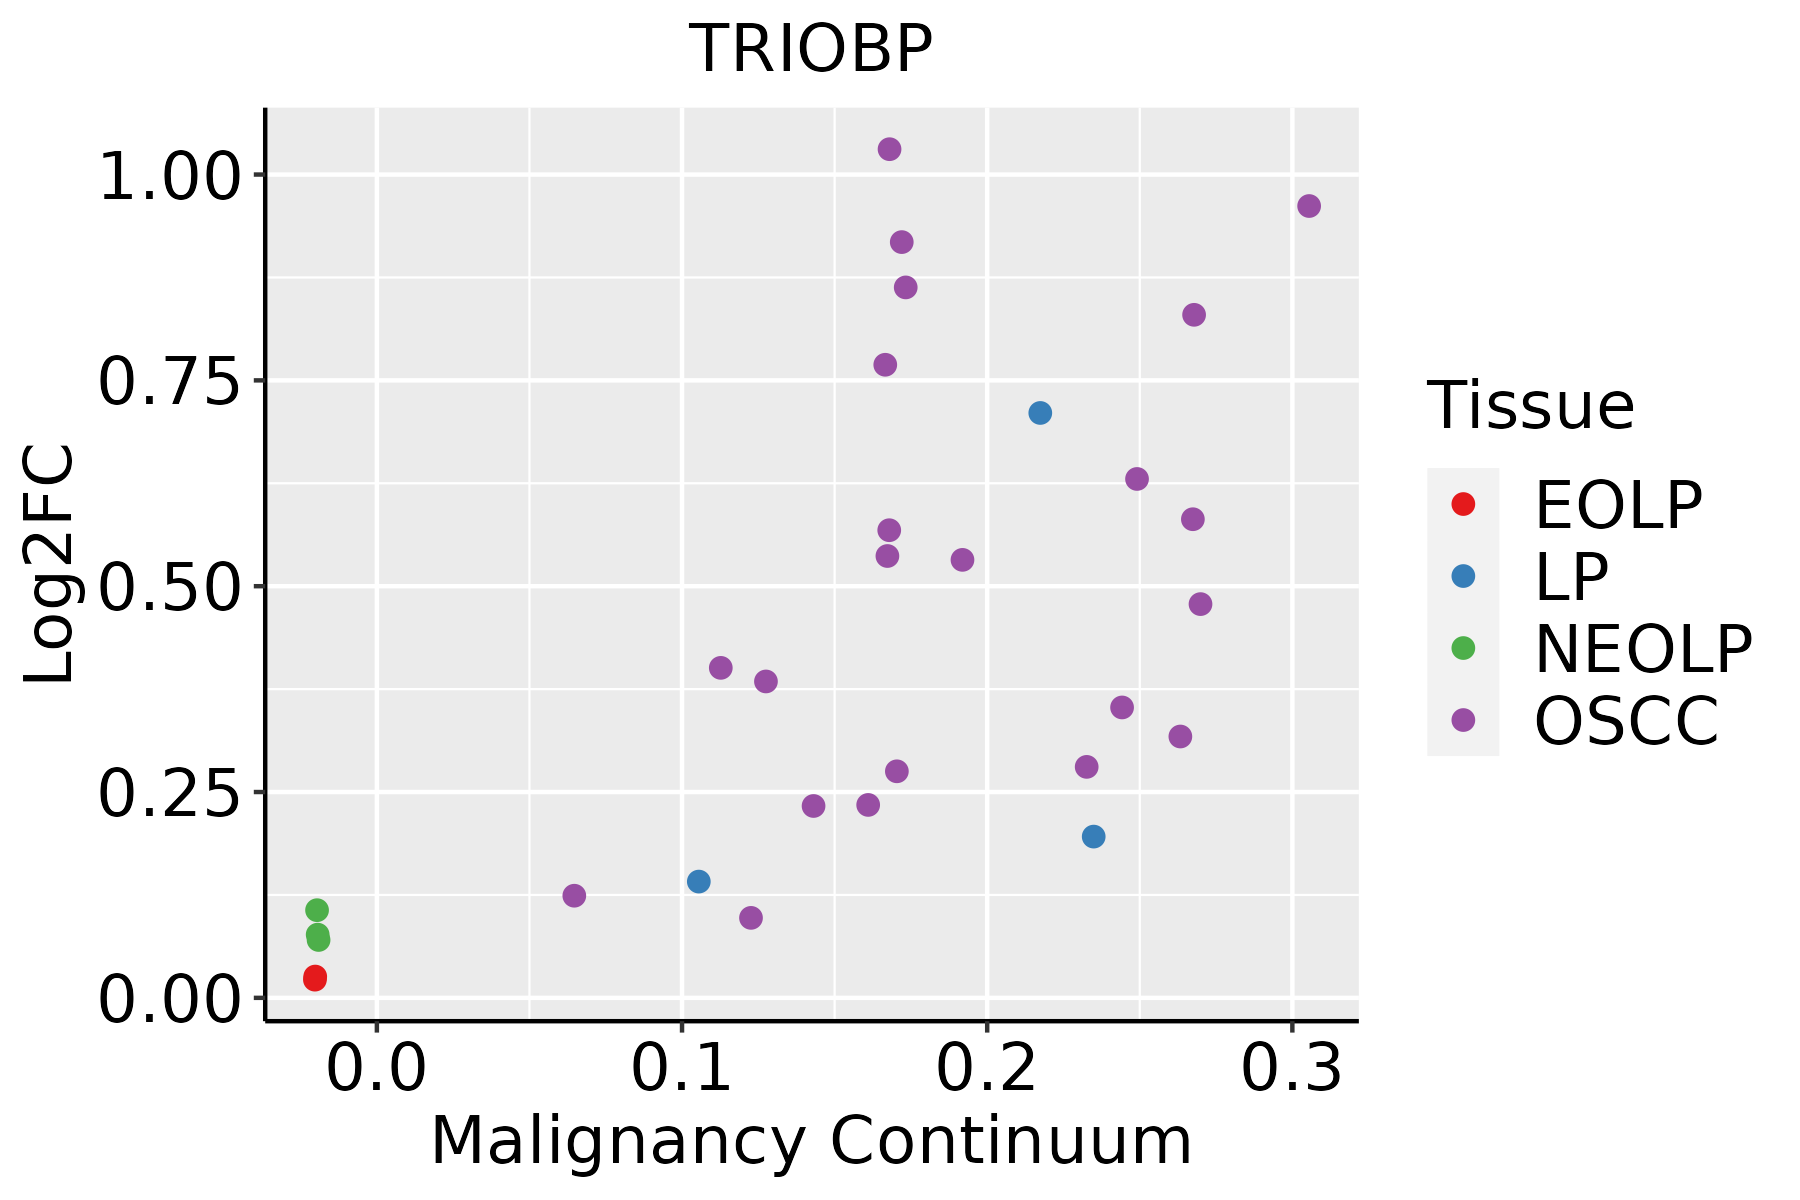 | EOLP: Erosive Oral lichen planus |
| LP: leukoplakia | ||
| NEOLP: Non-erosive oral lichen planus | ||
| OSCC: Oral squamous cell carcinoma | ||
| Thyroid |  | ATC: Anaplastic thyroid cancer |
| HT: Hashimoto's thyroiditis | ||
| PTC: Papillary thyroid cancer |
| ∗log2FC in expression of this searched gene in stem-like cells from each diseased tissue sample relative to stem-like cells in normal samples in each tissue plotted against the malignancy continuum. Samples are colored based on if they are from different disease stage. |
Top |
Malignant transformation related pathway analysis |
| Find out the enriched GO biological processes and KEGG pathways involved in transition from healthy to precancer to cancer |
| Tissue | Disease Stage | Enriched GO biological Processes |
| Colorectum | AD |  |
| Colorectum | SER |  |
| Colorectum | MSS |  |
| Colorectum | MSI-H |  |
| Colorectum | FAP |  |
| ∗Top 15 enriched GO BP terms are showed in the bar plot of each disease state in each tissue. Each row represents a significant GO biological process which is colored according to the -log10(p.adjust). |
| Page: 1 2 3 4 5 6 7 8 9 |
| GO ID | Tissue | Disease Stage | Description | Gene Ratio | Bg Ratio | pvalue | p.adjust | Count |
| GO:0007015 | Colorectum | AD | actin filament organization | 167/3918 | 442/18723 | 1.65e-16 | 7.94e-14 | 167 |
| GO:0032535 | Colorectum | AD | regulation of cellular component size | 142/3918 | 383/18723 | 1.74e-13 | 3.41e-11 | 142 |
| GO:1902903 | Colorectum | AD | regulation of supramolecular fiber organization | 139/3918 | 383/18723 | 2.01e-12 | 3.19e-10 | 139 |
| GO:0032970 | Colorectum | AD | regulation of actin filament-based process | 142/3918 | 397/18723 | 4.05e-12 | 5.90e-10 | 142 |
| GO:0110053 | Colorectum | AD | regulation of actin filament organization | 108/3918 | 278/18723 | 5.02e-12 | 6.98e-10 | 108 |
| GO:0008154 | Colorectum | AD | actin polymerization or depolymerization | 90/3918 | 218/18723 | 6.14e-12 | 8.23e-10 | 90 |
| GO:0032271 | Colorectum | AD | regulation of protein polymerization | 94/3918 | 233/18723 | 1.01e-11 | 1.29e-09 | 94 |
| GO:0030041 | Colorectum | AD | actin filament polymerization | 81/3918 | 191/18723 | 1.35e-11 | 1.69e-09 | 81 |
| GO:0051258 | Colorectum | AD | protein polymerization | 112/3918 | 297/18723 | 1.85e-11 | 2.27e-09 | 112 |
| GO:0043254 | Colorectum | AD | regulation of protein-containing complex assembly | 148/3918 | 428/18723 | 2.64e-11 | 3.18e-09 | 148 |
| GO:0002064 | Colorectum | AD | epithelial cell development | 89/3918 | 220/18723 | 2.98e-11 | 3.52e-09 | 89 |
| GO:0008064 | Colorectum | AD | regulation of actin polymerization or depolymerization | 79/3918 | 188/18723 | 4.17e-11 | 4.74e-09 | 79 |
| GO:0030833 | Colorectum | AD | regulation of actin filament polymerization | 74/3918 | 172/18723 | 4.50e-11 | 5.03e-09 | 74 |
| GO:0030832 | Colorectum | AD | regulation of actin filament length | 79/3918 | 189/18723 | 5.71e-11 | 6.27e-09 | 79 |
| GO:0032956 | Colorectum | AD | regulation of actin cytoskeleton organization | 127/3918 | 358/18723 | 1.03e-10 | 1.04e-08 | 127 |
| GO:0022411 | Colorectum | AD | cellular component disassembly | 147/3918 | 443/18723 | 8.53e-10 | 6.76e-08 | 147 |
| GO:0022604 | Colorectum | AD | regulation of cell morphogenesis | 109/3918 | 309/18723 | 3.08e-09 | 2.07e-07 | 109 |
| GO:0010811 | Colorectum | AD | positive regulation of cell-substrate adhesion | 53/3918 | 123/18723 | 2.30e-08 | 1.27e-06 | 53 |
| GO:0010810 | Colorectum | AD | regulation of cell-substrate adhesion | 81/3918 | 221/18723 | 4.80e-08 | 2.55e-06 | 81 |
| GO:0032984 | Colorectum | AD | protein-containing complex disassembly | 81/3918 | 224/18723 | 9.41e-08 | 4.65e-06 | 81 |
| Page: 1 2 3 4 5 6 7 8 9 10 11 12 13 14 15 16 17 18 19 20 21 22 23 24 |
| Pathway ID | Tissue | Disease Stage | Description | Gene Ratio | Bg Ratio | pvalue | p.adjust | qvalue | Count |
| Page: 1 |
Top |
Cell-cell communication analysis |
| Identification of potential cell-cell interactions between two cell types and their ligand-receptor pairs for different disease states |
| Ligand | Receptor | LRpair | Pathway | Tissue | Disease Stage |
| Page: 1 |
Top |
Single-cell gene regulatory network inference analysis |
| Find out the significant the regulons (TFs) and the target genes of each regulon across cell types for different disease states |
| TF | Cell Type | Tissue | Disease Stage | Target Gene | RSS | Regulon Activity |
| ∗The dot plots of a searched regulon are shown for all cell subpopulations in each disease state of each tissue based on the regulon specific score inferred using pySCENIC and by calculating the average expression. |
| Page: 1 |
Top |
Somatic mutation of malignant transformation related genes |
| Annotation of somatic variants for genes involved in malignant transformation |
| Hugo Symbol | Variant Class | Variant Classification | dbSNP RS | HGVSc | HGVSp | HGVSp Short | SWISSPROT | BIOTYPE | SIFT | PolyPhen | Tumor Sample Barcode | Tissue | Histology | Sex | Age | Stage | Therapy Types | Drugs | Outcome |
| TRIOBP | SNV | Missense_Mutation | c.3142N>C | p.Glu1048Gln | p.E1048Q | Q9H2D6 | protein_coding | deleterious_low_confidence(0) | probably_damaging(0.994) | TCGA-AC-A23H-01 | Breast | breast invasive carcinoma | Female | >=65 | I/II | Unknown | Unknown | PD | |
| TRIOBP | SNV | Missense_Mutation | c.2179C>T | p.Arg727Trp | p.R727W | Q9H2D6 | protein_coding | deleterious_low_confidence(0.01) | benign(0.005) | TCGA-AR-A0TW-01 | Breast | breast invasive carcinoma | Female | <65 | III/IV | Chemotherapy | doxorubicin | PD | |
| TRIOBP | SNV | Missense_Mutation | c.2252N>A | p.Arg751Gln | p.R751Q | Q9H2D6 | protein_coding | tolerated_low_confidence(0.11) | benign(0.003) | TCGA-B6-A0RL-01 | Breast | breast invasive carcinoma | Female | <65 | I/II | Unknown | Unknown | SD | |
| TRIOBP | SNV | Missense_Mutation | rs560619122 | c.3755N>T | p.Ser1252Phe | p.S1252F | Q9H2D6 | protein_coding | deleterious_low_confidence(0) | benign(0.117) | TCGA-BH-A0B6-01 | Breast | breast invasive carcinoma | Female | <65 | I/II | Unknown | Unknown | SD |
| TRIOBP | SNV | Missense_Mutation | c.1982N>A | p.Ser661Tyr | p.S661Y | Q9H2D6 | protein_coding | deleterious_low_confidence(0) | benign(0.246) | TCGA-C8-A135-01 | Breast | breast invasive carcinoma | Female | <65 | I/II | Chemotherapy | 5-fluorouracil | CR | |
| TRIOBP | SNV | Missense_Mutation | rs572969683 | c.3218C>T | p.Ala1073Val | p.A1073V | Q9H2D6 | protein_coding | deleterious_low_confidence(0) | possibly_damaging(0.861) | TCGA-E2-A153-01 | Breast | breast invasive carcinoma | Female | <65 | I/II | Chemotherapy | doxorubicin | SD |
| TRIOBP | SNV | Missense_Mutation | novel | c.1067C>A | p.Thr356Asn | p.T356N | Q9H2D6 | protein_coding | tolerated_low_confidence(0.23) | benign(0.367) | TCGA-LD-A74U-01 | Breast | breast invasive carcinoma | Female | >=65 | III/IV | Chemotherapy | taxotere | SD |
| TRIOBP | SNV | Missense_Mutation | novel | c.2785C>G | p.Gln929Glu | p.Q929E | Q9H2D6 | protein_coding | deleterious_low_confidence(0) | benign(0.173) | TCGA-LL-A6FR-01 | Breast | breast invasive carcinoma | Female | <65 | I/II | Chemotherapy | adriamycin | SD |
| TRIOBP | SNV | Missense_Mutation | novel | c.4398N>G | p.Ser1466Arg | p.S1466R | Q9H2D6 | protein_coding | tolerated_low_confidence(0.1) | benign(0) | TCGA-OL-A66P-01 | Breast | breast invasive carcinoma | Female | >=65 | I/II | Chemotherapy | cytoxan | CR |
| TRIOBP | insertion | Nonsense_Mutation | novel | c.939_940insGGGTAGGAACATTTGGATACAAAAAACAGGGGCTTTC | p.Ser314GlyfsTer2 | p.S314Gfs*2 | Q9H2D6 | protein_coding | TCGA-B6-A0RI-01 | Breast | breast invasive carcinoma | Female | <65 | III/IV | Unknown | Unknown | PD |
| Page: 1 2 3 4 5 6 7 8 9 10 11 12 13 14 15 16 17 18 19 20 21 22 23 24 25 26 |
Top |
Related drugs of malignant transformation related genes |
| Identification of chemicals and drugs interact with genes involved in malignant transfromation |
| (DGIdb 4.0) |
| Entrez ID | Symbol | Category | Interaction Types | Drug Claim Name | Drug Name | PMIDs |
| Page: 1 |

Copyright 2023-Present -The University of Texas Health Science Center at Houston |