
|
|||||
|
 | |
| |
| |
| |
| |
| |
|
Gene: TRIML2 |
Gene summary for TRIML2 |
| Gene information | Species | Human | Gene symbol | TRIML2 | Gene ID | 205860 |
| Gene name | tripartite motif family like 2 | |
| Gene Alias | SPRYD6 | |
| Cytomap | 4q35.2 | |
| Gene Type | protein-coding | GO ID | GO:0000209 | UniProtAcc | B7ZLC3 |
Top |
Malignant transformation analysis |
| Identification of the aberrant gene expression in precancerous and cancerous lesions by comparing the gene expression of stem-like cells in diseased tissues with normal stem cells |
| Entrez ID | Symbol | Replicates | Species | Organ | Tissue | Adj P-value | Log2FC | Malignancy |
| 205860 | TRIML2 | C04 | Human | Oral cavity | OSCC | 1.91e-07 | 5.67e-01 | 0.2633 |
| 205860 | TRIML2 | C21 | Human | Oral cavity | OSCC | 1.09e-41 | 1.76e+00 | 0.2678 |
| 205860 | TRIML2 | ATC09 | Human | Thyroid | ATC | 9.00e-08 | 3.19e-01 | 0.2871 |
| 205860 | TRIML2 | ATC12 | Human | Thyroid | ATC | 1.81e-60 | 1.68e+00 | 0.34 |
| 205860 | TRIML2 | ATC1 | Human | Thyroid | ATC | 1.26e-09 | 3.83e-01 | 0.2878 |
| 205860 | TRIML2 | ATC2 | Human | Thyroid | ATC | 3.39e-19 | 1.55e+00 | 0.34 |
| 205860 | TRIML2 | ATC4 | Human | Thyroid | ATC | 3.43e-68 | 1.95e+00 | 0.34 |
| Page: 1 |
| Tissue | Expression Dynamics | Abbreviation |
| Oral Cavity | 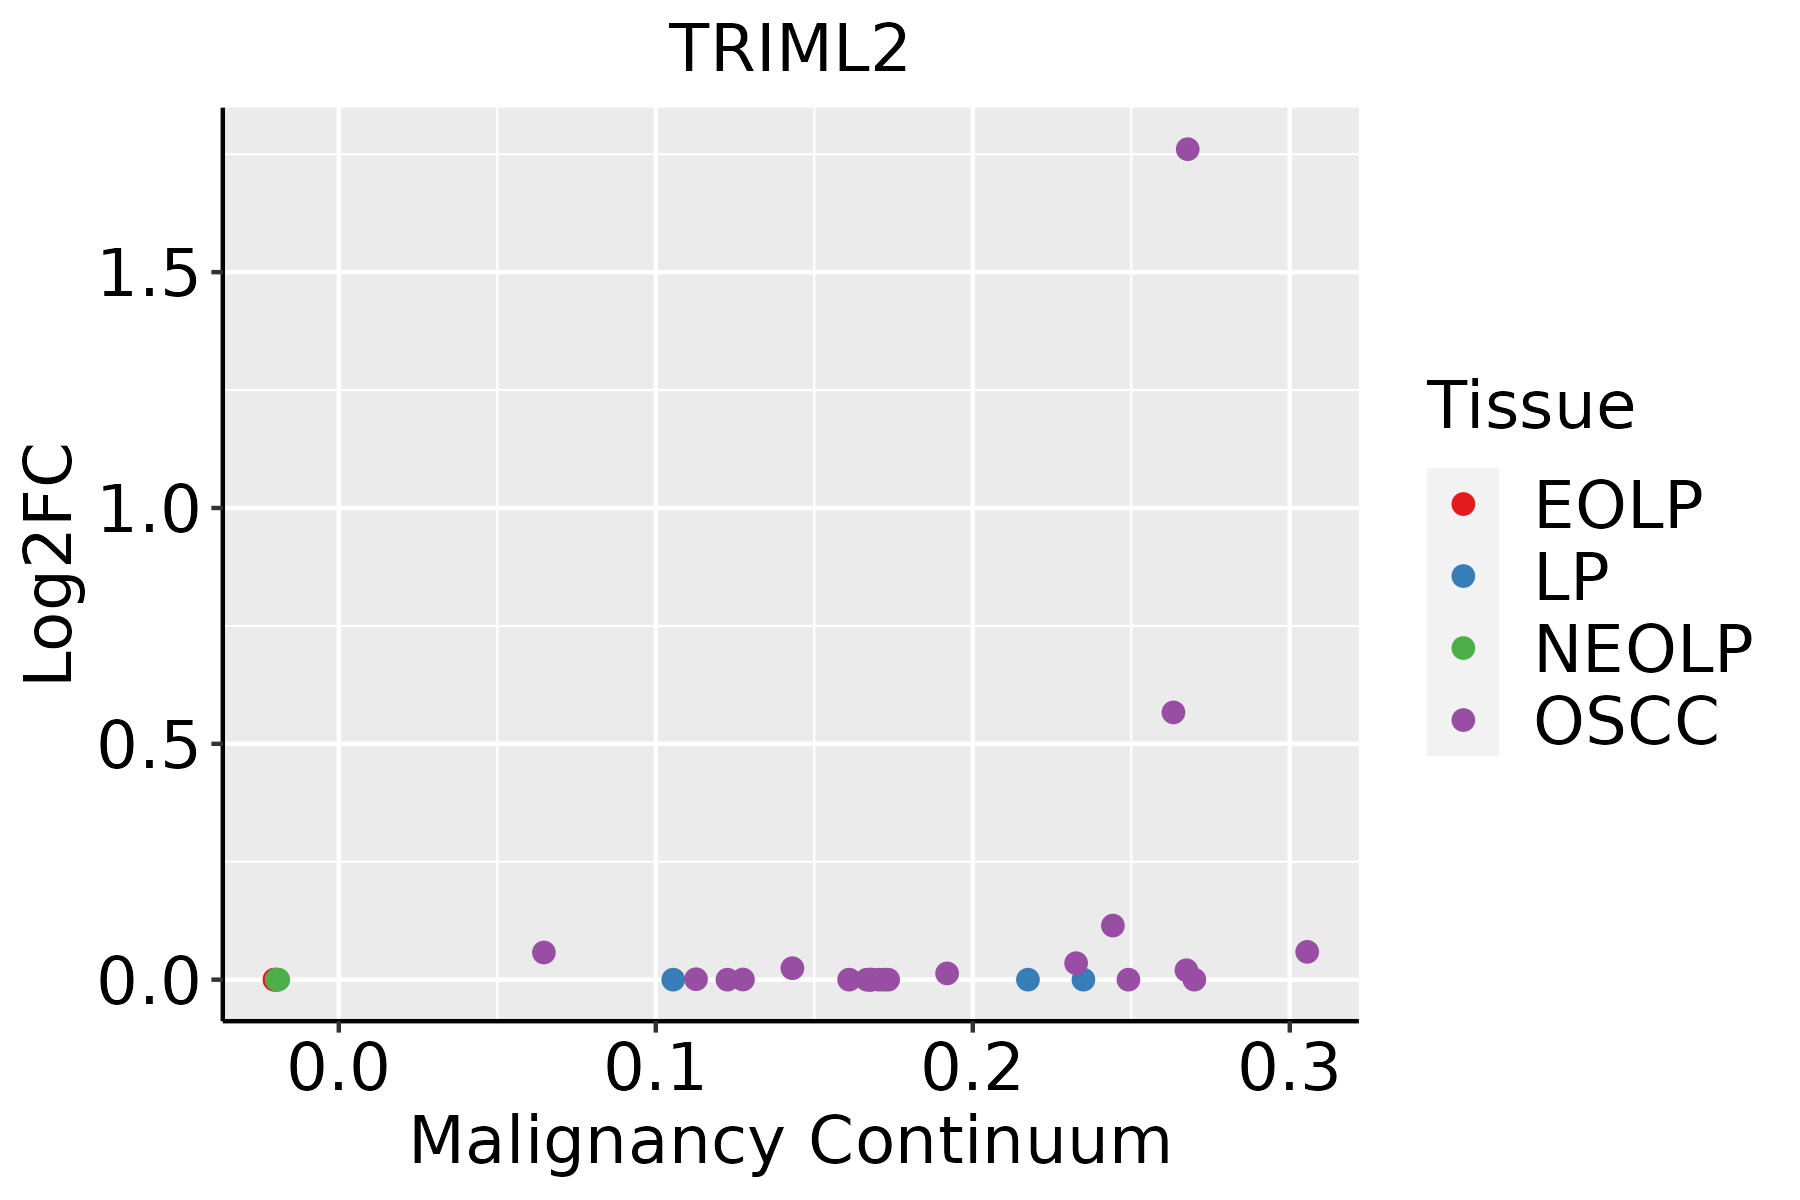 | EOLP: Erosive Oral lichen planus |
| LP: leukoplakia | ||
| NEOLP: Non-erosive oral lichen planus | ||
| OSCC: Oral squamous cell carcinoma | ||
| Thyroid | 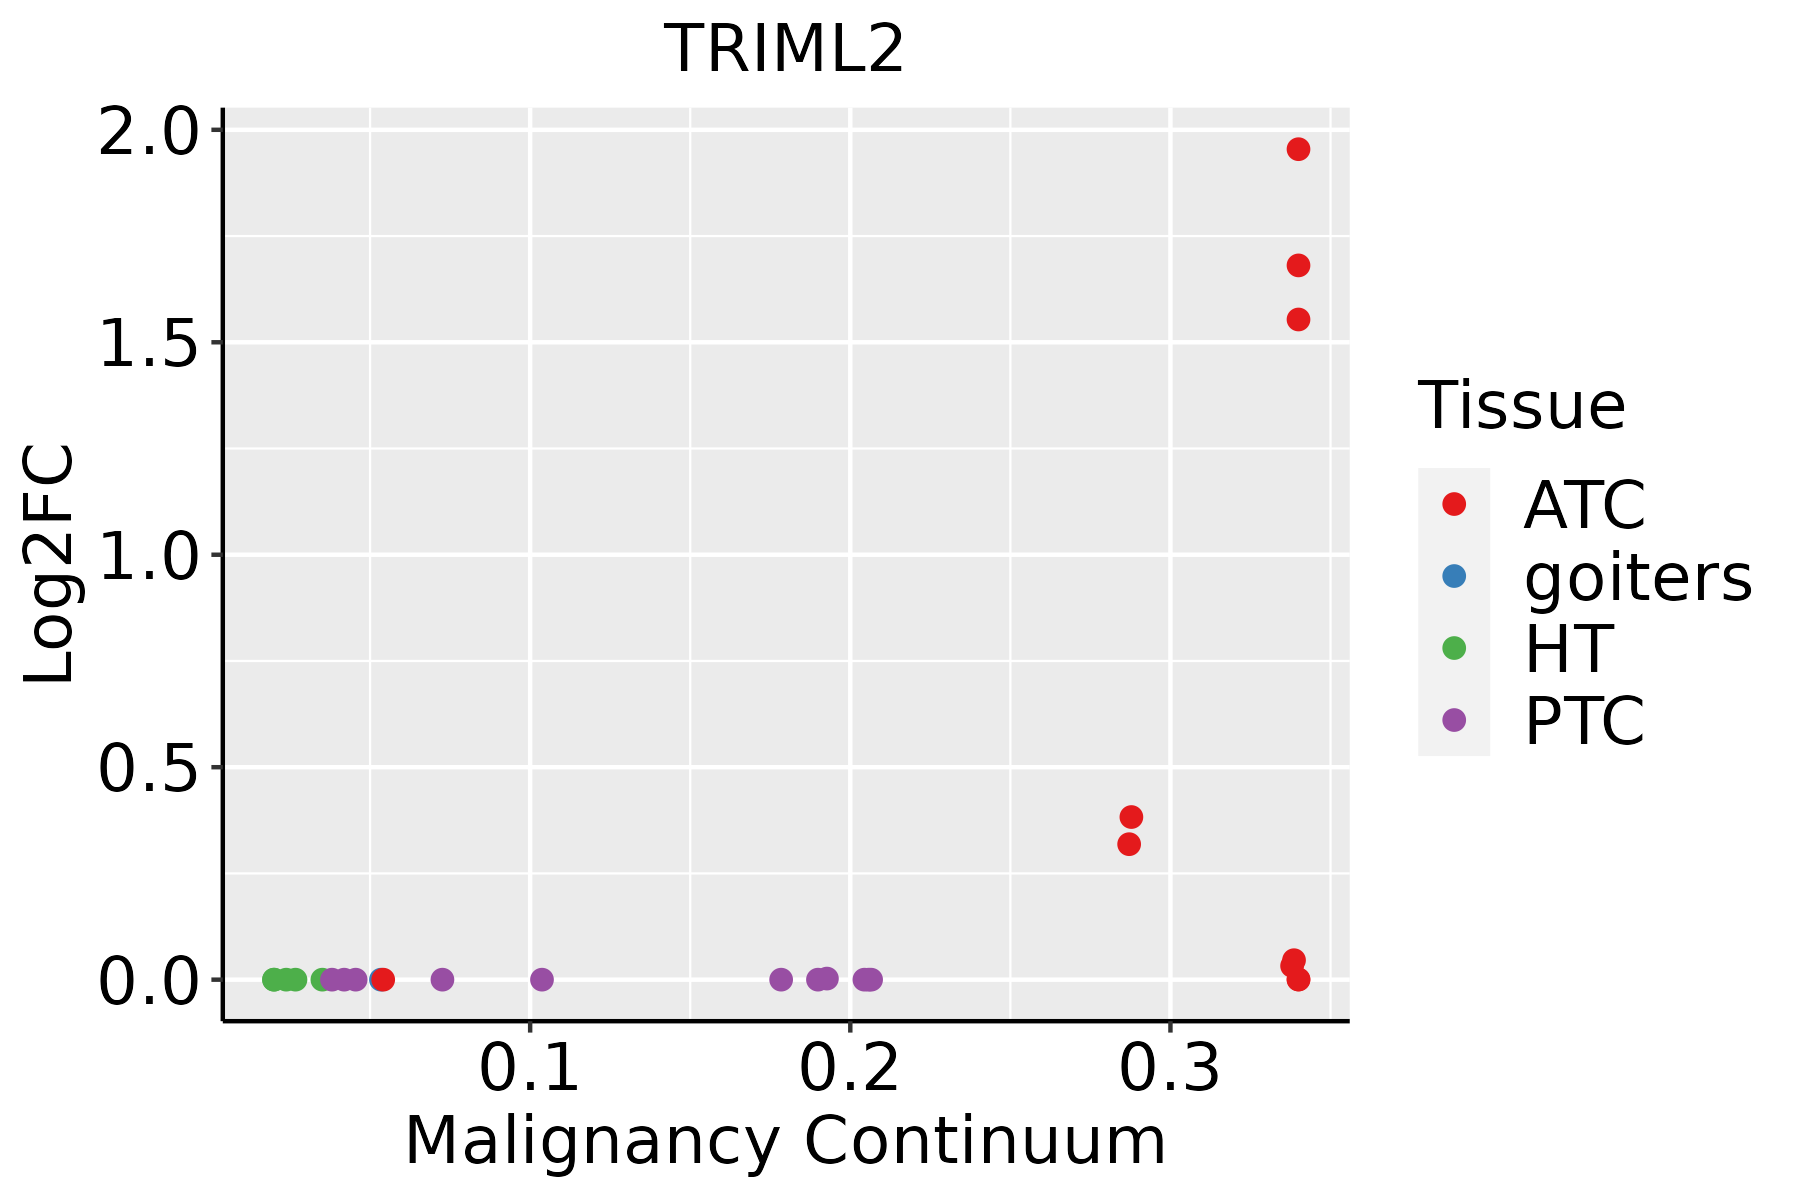 | ATC: Anaplastic thyroid cancer |
| HT: Hashimoto's thyroiditis | ||
| PTC: Papillary thyroid cancer |
| ∗log2FC in expression of this searched gene in stem-like cells from each diseased tissue sample relative to stem-like cells in normal samples in each tissue plotted against the malignancy continuum. Samples are colored based on if they are from different disease stage. |
Top |
Malignant transformation related pathway analysis |
| Find out the enriched GO biological processes and KEGG pathways involved in transition from healthy to precancer to cancer |
| Tissue | Disease Stage | Enriched GO biological Processes |
| Colorectum | AD |  |
| Colorectum | SER |  |
| Colorectum | MSS |  |
| Colorectum | MSI-H |  |
| Colorectum | FAP |  |
| ∗Top 15 enriched GO BP terms are showed in the bar plot of each disease state in each tissue. Each row represents a significant GO biological process which is colored according to the -log10(p.adjust). |
| Page: 1 2 3 4 5 6 7 8 9 |
| GO ID | Tissue | Disease Stage | Description | Gene Ratio | Bg Ratio | pvalue | p.adjust | Count |
| GO:001603220 | Oral cavity | OSCC | viral process | 274/7305 | 415/18723 | 2.42e-29 | 1.70e-26 | 274 |
| GO:000989620 | Oral cavity | OSCC | positive regulation of catabolic process | 307/7305 | 492/18723 | 2.29e-26 | 7.64e-24 | 307 |
| GO:003133120 | Oral cavity | OSCC | positive regulation of cellular catabolic process | 273/7305 | 427/18723 | 6.39e-26 | 2.02e-23 | 273 |
| GO:001905820 | Oral cavity | OSCC | viral life cycle | 208/7305 | 317/18723 | 4.59e-22 | 1.00e-19 | 208 |
| GO:001050610 | Oral cavity | OSCC | regulation of autophagy | 198/7305 | 317/18723 | 1.63e-17 | 1.51e-15 | 198 |
| GO:000020910 | Oral cavity | OSCC | protein polyubiquitination | 150/7305 | 236/18723 | 1.59e-14 | 9.27e-13 | 150 |
| GO:004312218 | Oral cavity | OSCC | regulation of I-kappaB kinase/NF-kappaB signaling | 155/7305 | 249/18723 | 7.79e-14 | 4.14e-12 | 155 |
| GO:004312310 | Oral cavity | OSCC | positive regulation of I-kappaB kinase/NF-kappaB signaling | 122/7305 | 186/18723 | 1.68e-13 | 8.52e-12 | 122 |
| GO:000724910 | Oral cavity | OSCC | I-kappaB kinase/NF-kappaB signaling | 169/7305 | 281/18723 | 4.69e-13 | 2.25e-11 | 169 |
| GO:004440320 | Oral cavity | OSCC | biological process involved in symbiotic interaction | 173/7305 | 290/18723 | 6.80e-13 | 3.19e-11 | 173 |
| GO:005079220 | Oral cavity | OSCC | regulation of viral process | 109/7305 | 164/18723 | 8.95e-13 | 4.10e-11 | 109 |
| GO:190390020 | Oral cavity | OSCC | regulation of viral life cycle | 97/7305 | 148/18723 | 5.34e-11 | 1.67e-09 | 97 |
| GO:005170120 | Oral cavity | OSCC | biological process involved in interaction with host | 125/7305 | 203/18723 | 5.60e-11 | 1.74e-09 | 125 |
| GO:005212620 | Oral cavity | OSCC | movement in host environment | 106/7305 | 175/18723 | 5.84e-09 | 1.26e-07 | 106 |
| GO:00105087 | Oral cavity | OSCC | positive regulation of autophagy | 77/7305 | 124/18723 | 1.59e-07 | 2.61e-06 | 77 |
| GO:00510907 | Oral cavity | OSCC | regulation of DNA-binding transcription factor activity | 221/7305 | 440/18723 | 9.06e-07 | 1.23e-05 | 221 |
| GO:004440920 | Oral cavity | OSCC | entry into host | 86/7305 | 151/18723 | 5.74e-06 | 6.37e-05 | 86 |
| GO:004671820 | Oral cavity | OSCC | viral entry into host cell | 81/7305 | 144/18723 | 1.98e-05 | 1.89e-04 | 81 |
| GO:00510917 | Oral cavity | OSCC | positive regulation of DNA-binding transcription factor activity | 134/7305 | 260/18723 | 2.52e-05 | 2.35e-04 | 134 |
| GO:004390319 | Oral cavity | OSCC | regulation of biological process involved in symbiotic interaction | 44/7305 | 72/18723 | 1.20e-04 | 8.57e-04 | 44 |
| Page: 1 2 3 |
| Pathway ID | Tissue | Disease Stage | Description | Gene Ratio | Bg Ratio | pvalue | p.adjust | qvalue | Count |
| Page: 1 |
Top |
Cell-cell communication analysis |
| Identification of potential cell-cell interactions between two cell types and their ligand-receptor pairs for different disease states |
| Ligand | Receptor | LRpair | Pathway | Tissue | Disease Stage |
| Page: 1 |
Top |
Single-cell gene regulatory network inference analysis |
| Find out the significant the regulons (TFs) and the target genes of each regulon across cell types for different disease states |
| TF | Cell Type | Tissue | Disease Stage | Target Gene | RSS | Regulon Activity |
| ∗The dot plots of a searched regulon are shown for all cell subpopulations in each disease state of each tissue based on the regulon specific score inferred using pySCENIC and by calculating the average expression. |
| Page: 1 |
Top |
Somatic mutation of malignant transformation related genes |
| Annotation of somatic variants for genes involved in malignant transformation |
| Hugo Symbol | Variant Class | Variant Classification | dbSNP RS | HGVSc | HGVSp | HGVSp Short | SWISSPROT | BIOTYPE | SIFT | PolyPhen | Tumor Sample Barcode | Tissue | Histology | Sex | Age | Stage | Therapy Types | Drugs | Outcome |
| TRIML2 | SNV | Missense_Mutation | novel | c.1303N>T | p.Val435Phe | p.V435F | Q8N7C3 | protein_coding | tolerated_low_confidence(0.05) | benign(0.178) | TCGA-EW-A1PC-01 | Breast | breast invasive carcinoma | Female | >=65 | I/II | Hormone Therapy | tamoxiphen | SD |
| TRIML2 | SNV | Missense_Mutation | c.1052C>A | p.Thr351Asn | p.T351N | Q8N7C3 | protein_coding | deleterious(0.01) | probably_damaging(0.982) | TCGA-C5-A8YQ-01 | Cervix | cervical & endocervical cancer | Female | >=65 | I/II | Chemotherapy | cisplatin | PD | |
| TRIML2 | SNV | Missense_Mutation | rs753157392 | c.97G>A | p.Asp33Asn | p.D33N | Q8N7C3 | protein_coding | deleterious(0) | probably_damaging(0.999) | TCGA-DR-A0ZM-01 | Cervix | cervical & endocervical cancer | Female | <65 | III/IV | Unspecific | Cisplatin | SD |
| TRIML2 | SNV | Missense_Mutation | c.902N>T | p.Ser301Leu | p.S301L | Q8N7C3 | protein_coding | deleterious(0.01) | possibly_damaging(0.654) | TCGA-VS-A953-01 | Cervix | cervical & endocervical cancer | Female | <65 | I/II | Unknown | Unknown | PD | |
| TRIML2 | SNV | Missense_Mutation | c.626N>A | p.Ala209Glu | p.A209E | Q8N7C3 | protein_coding | deleterious(0.01) | probably_damaging(0.939) | TCGA-AA-3502-01 | Colorectum | colon adenocarcinoma | Male | >=65 | I/II | Unknown | Unknown | SD | |
| TRIML2 | SNV | Missense_Mutation | c.815G>T | p.Arg272Ile | p.R272I | Q8N7C3 | protein_coding | deleterious(0) | benign(0.251) | TCGA-AA-3510-01 | Colorectum | colon adenocarcinoma | Male | >=65 | I/II | Unknown | Unknown | SD | |
| TRIML2 | SNV | Missense_Mutation | c.862N>A | p.Asp288Asn | p.D288N | Q8N7C3 | protein_coding | deleterious(0.02) | possibly_damaging(0.527) | TCGA-AD-6964-01 | Colorectum | colon adenocarcinoma | Male | <65 | III/IV | Chemotherapy | folfox | PD | |
| TRIML2 | SNV | Missense_Mutation | c.968N>T | p.Gly323Val | p.G323V | Q8N7C3 | protein_coding | deleterious(0.01) | benign(0.009) | TCGA-AZ-4682-01 | Colorectum | colon adenocarcinoma | Male | <65 | I/II | Chemotherapy | camptosar | PD | |
| TRIML2 | SNV | Missense_Mutation | c.1018N>A | p.Leu340Met | p.L340M | Q8N7C3 | protein_coding | tolerated(0.1) | probably_damaging(0.997) | TCGA-AZ-6601-01 | Colorectum | colon adenocarcinoma | Male | >=65 | I/II | Unknown | Unknown | PD | |
| TRIML2 | SNV | Missense_Mutation | rs758977958 | c.218C>T | p.Ser73Leu | p.S73L | Q8N7C3 | protein_coding | tolerated(1) | benign(0) | TCGA-CA-6718-01 | Colorectum | colon adenocarcinoma | Male | <65 | I/II | Unknown | Unknown | PD |
| Page: 1 2 3 4 5 6 7 8 9 10 11 |
Top |
Related drugs of malignant transformation related genes |
| Identification of chemicals and drugs interact with genes involved in malignant transfromation |
| (DGIdb 4.0) |
| Entrez ID | Symbol | Category | Interaction Types | Drug Claim Name | Drug Name | PMIDs |
| Page: 1 |

Copyright 2023-Present -The University of Texas Health Science Center at Houston |