
|
|||||
|
 | |
| |
| |
| |
| |
| |
|
Gene: TRIM7 |
Gene summary for TRIM7 |
| Gene information | Species | Human | Gene symbol | TRIM7 | Gene ID | 81786 |
| Gene name | tripartite motif containing 7 | |
| Gene Alias | GNIP | |
| Cytomap | 5q35.3 | |
| Gene Type | protein-coding | GO ID | GO:0006464 | UniProtAcc | Q9C029 |
Top |
Malignant transformation analysis |
| Identification of the aberrant gene expression in precancerous and cancerous lesions by comparing the gene expression of stem-like cells in diseased tissues with normal stem cells |
| Entrez ID | Symbol | Replicates | Species | Organ | Tissue | Adj P-value | Log2FC | Malignancy |
| 81786 | TRIM7 | LZE20T | Human | Esophagus | ESCC | 3.71e-03 | 1.88e-01 | 0.0662 |
| 81786 | TRIM7 | LZE24T | Human | Esophagus | ESCC | 1.88e-08 | 1.26e-01 | 0.0596 |
| 81786 | TRIM7 | LZE21T | Human | Esophagus | ESCC | 4.72e-02 | 2.92e-01 | 0.0655 |
| 81786 | TRIM7 | P1T-E | Human | Esophagus | ESCC | 6.77e-04 | 2.65e-01 | 0.0875 |
| 81786 | TRIM7 | P2T-E | Human | Esophagus | ESCC | 1.57e-06 | 5.42e-02 | 0.1177 |
| 81786 | TRIM7 | P4T-E | Human | Esophagus | ESCC | 3.91e-05 | 1.66e-01 | 0.1323 |
| 81786 | TRIM7 | P5T-E | Human | Esophagus | ESCC | 1.26e-29 | 4.95e-01 | 0.1327 |
| 81786 | TRIM7 | P8T-E | Human | Esophagus | ESCC | 1.05e-02 | 2.25e-02 | 0.0889 |
| 81786 | TRIM7 | P9T-E | Human | Esophagus | ESCC | 1.37e-30 | 7.35e-01 | 0.1131 |
| 81786 | TRIM7 | P10T-E | Human | Esophagus | ESCC | 2.55e-15 | 1.87e-01 | 0.116 |
| 81786 | TRIM7 | P11T-E | Human | Esophagus | ESCC | 3.46e-08 | 3.05e-01 | 0.1426 |
| 81786 | TRIM7 | P12T-E | Human | Esophagus | ESCC | 4.93e-13 | 2.59e-01 | 0.1122 |
| 81786 | TRIM7 | P15T-E | Human | Esophagus | ESCC | 4.23e-10 | 2.54e-01 | 0.1149 |
| 81786 | TRIM7 | P17T-E | Human | Esophagus | ESCC | 3.96e-05 | 2.99e-01 | 0.1278 |
| 81786 | TRIM7 | P19T-E | Human | Esophagus | ESCC | 2.46e-02 | 2.84e-01 | 0.1662 |
| 81786 | TRIM7 | P20T-E | Human | Esophagus | ESCC | 1.38e-27 | 5.26e-01 | 0.1124 |
| 81786 | TRIM7 | P21T-E | Human | Esophagus | ESCC | 2.17e-34 | 6.32e-01 | 0.1617 |
| 81786 | TRIM7 | P22T-E | Human | Esophagus | ESCC | 1.80e-27 | 5.38e-01 | 0.1236 |
| 81786 | TRIM7 | P23T-E | Human | Esophagus | ESCC | 3.00e-12 | 4.55e-01 | 0.108 |
| 81786 | TRIM7 | P24T-E | Human | Esophagus | ESCC | 1.14e-12 | 2.48e-01 | 0.1287 |
| Page: 1 2 3 4 5 |
| Tissue | Expression Dynamics | Abbreviation |
| Esophagus | 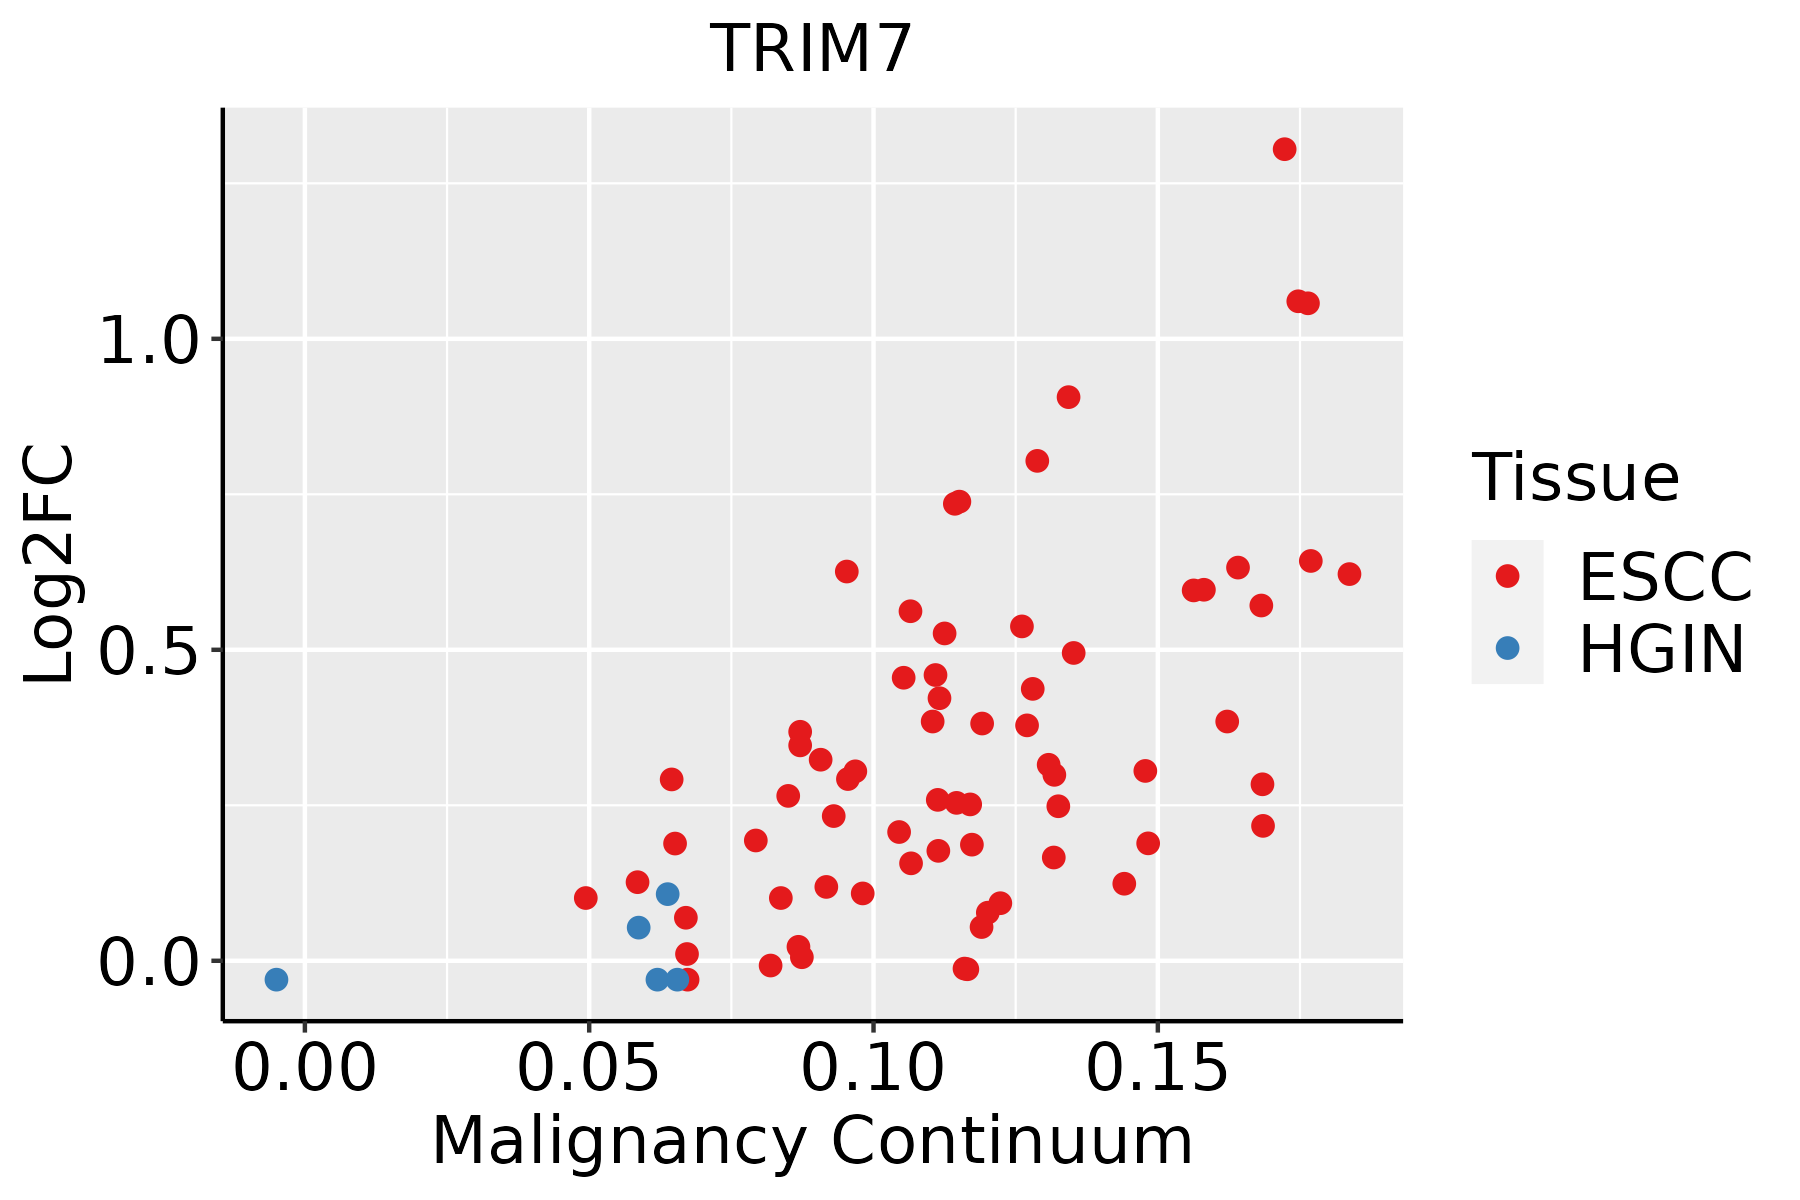 | ESCC: Esophageal squamous cell carcinoma |
| HGIN: High-grade intraepithelial neoplasias | ||
| LGIN: Low-grade intraepithelial neoplasias | ||
| Oral Cavity | 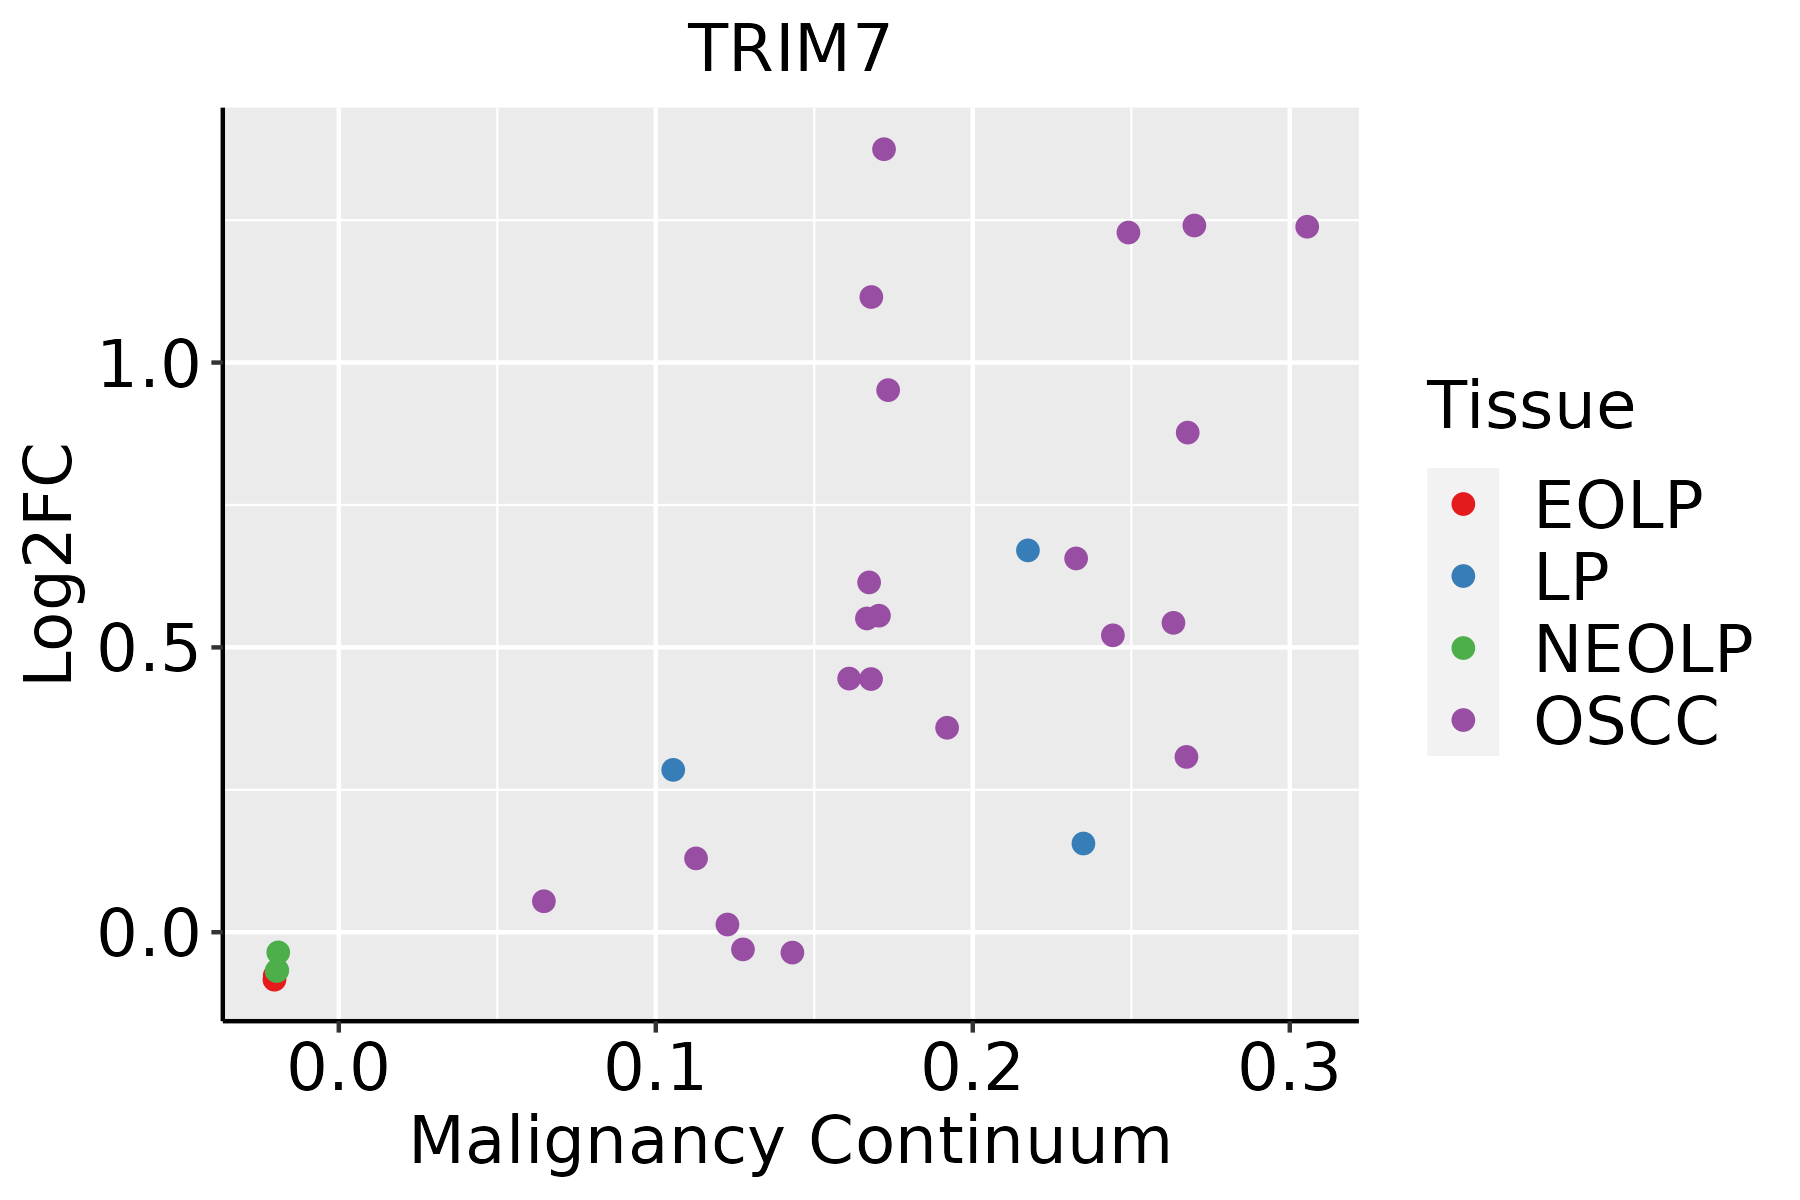 | EOLP: Erosive Oral lichen planus |
| LP: leukoplakia | ||
| NEOLP: Non-erosive oral lichen planus | ||
| OSCC: Oral squamous cell carcinoma | ||
| Skin | 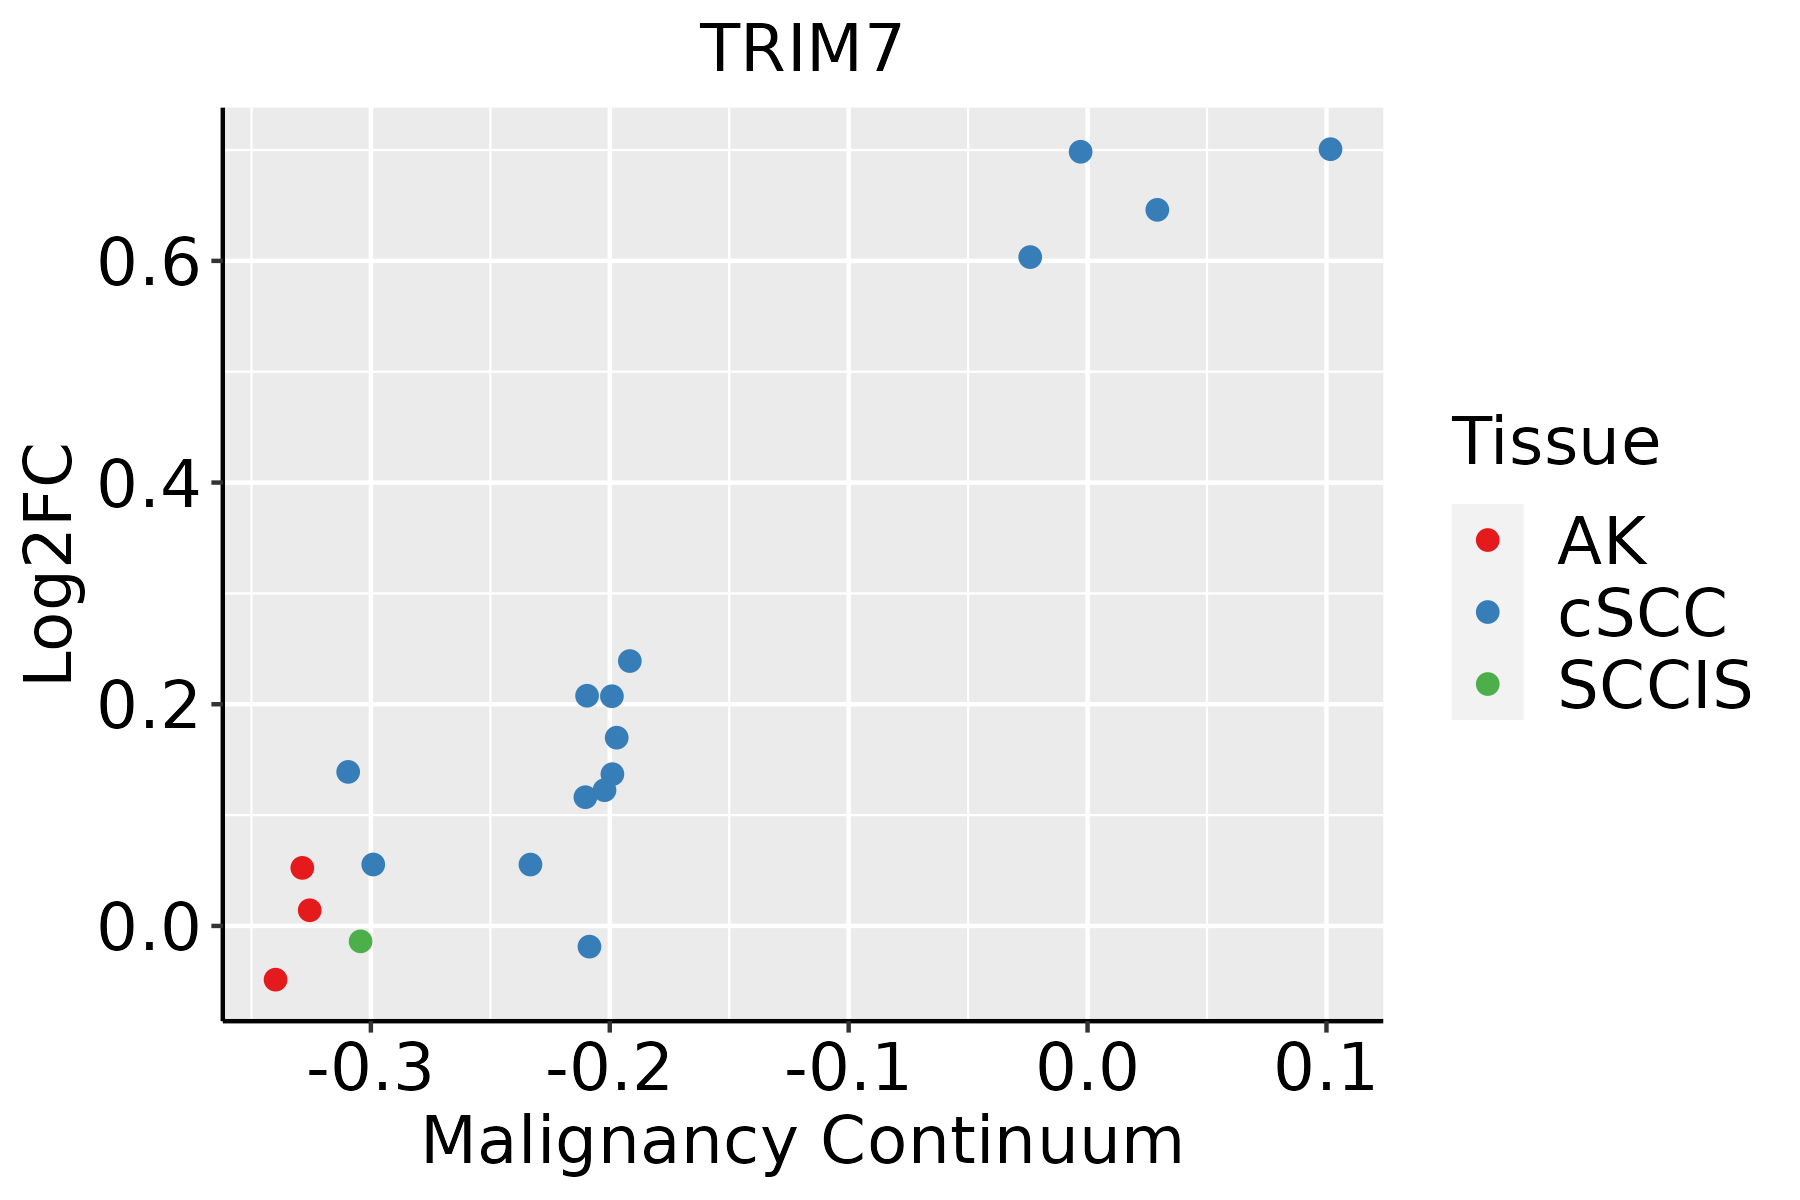 | AK: Actinic keratosis |
| cSCC: Cutaneous squamous cell carcinoma | ||
| SCCIS:squamous cell carcinoma in situ | ||
| Thyroid |  | ATC: Anaplastic thyroid cancer |
| HT: Hashimoto's thyroiditis | ||
| PTC: Papillary thyroid cancer |
| ∗log2FC in expression of this searched gene in stem-like cells from each diseased tissue sample relative to stem-like cells in normal samples in each tissue plotted against the malignancy continuum. Samples are colored based on if they are from different disease stage. |
Top |
Malignant transformation related pathway analysis |
| Find out the enriched GO biological processes and KEGG pathways involved in transition from healthy to precancer to cancer |
| Tissue | Disease Stage | Enriched GO biological Processes |
| Colorectum | AD |  |
| Colorectum | SER |  |
| Colorectum | MSS |  |
| Colorectum | MSI-H |  |
| Colorectum | FAP |  |
| ∗Top 15 enriched GO BP terms are showed in the bar plot of each disease state in each tissue. Each row represents a significant GO biological process which is colored according to the -log10(p.adjust). |
| Page: 1 2 3 4 5 6 7 8 9 |
| GO ID | Tissue | Disease Stage | Description | Gene Ratio | Bg Ratio | pvalue | p.adjust | Count |
| GO:001049822 | Liver | HCC | proteasomal protein catabolic process | 351/7958 | 490/18723 | 6.92e-40 | 1.46e-36 | 351 |
| GO:004316122 | Liver | HCC | proteasome-mediated ubiquitin-dependent protein catabolic process | 299/7958 | 412/18723 | 7.82e-36 | 8.27e-33 | 299 |
| GO:00346601 | Liver | HCC | ncRNA metabolic process | 332/7958 | 485/18723 | 1.48e-31 | 7.80e-29 | 332 |
| GO:000989622 | Liver | HCC | positive regulation of catabolic process | 335/7958 | 492/18723 | 3.83e-31 | 1.87e-28 | 335 |
| GO:003133122 | Liver | HCC | positive regulation of cellular catabolic process | 295/7958 | 427/18723 | 3.20e-29 | 1.45e-26 | 295 |
| GO:004427021 | Liver | HCC | cellular nitrogen compound catabolic process | 303/7958 | 451/18723 | 9.76e-27 | 3.64e-24 | 303 |
| GO:004670021 | Liver | HCC | heterocycle catabolic process | 299/7958 | 445/18723 | 2.07e-26 | 7.29e-24 | 299 |
| GO:190136121 | Liver | HCC | organic cyclic compound catabolic process | 325/7958 | 495/18723 | 6.52e-26 | 2.18e-23 | 325 |
| GO:001943921 | Liver | HCC | aromatic compound catabolic process | 309/7958 | 467/18723 | 1.56e-25 | 4.94e-23 | 309 |
| GO:000640121 | Liver | HCC | RNA catabolic process | 201/7958 | 278/18723 | 3.88e-24 | 1.02e-21 | 201 |
| GO:003465521 | Liver | HCC | nucleobase-containing compound catabolic process | 273/7958 | 407/18723 | 4.84e-24 | 1.23e-21 | 273 |
| GO:190331121 | Liver | HCC | regulation of mRNA metabolic process | 205/7958 | 288/18723 | 3.38e-23 | 6.90e-21 | 205 |
| GO:000640221 | Liver | HCC | mRNA catabolic process | 169/7958 | 232/18723 | 4.50e-21 | 6.96e-19 | 169 |
| GO:000641722 | Liver | HCC | regulation of translation | 287/7958 | 468/18723 | 8.79e-17 | 8.08e-15 | 287 |
| GO:004348721 | Liver | HCC | regulation of RNA stability | 119/7958 | 170/18723 | 3.20e-13 | 1.71e-11 | 119 |
| GO:004348821 | Liver | HCC | regulation of mRNA stability | 110/7958 | 158/18723 | 4.36e-12 | 1.93e-10 | 110 |
| GO:006101321 | Liver | HCC | regulation of mRNA catabolic process | 114/7958 | 166/18723 | 7.38e-12 | 3.12e-10 | 114 |
| GO:000020921 | Liver | HCC | protein polyubiquitination | 151/7958 | 236/18723 | 1.90e-11 | 7.59e-10 | 151 |
| GO:190331321 | Liver | HCC | positive regulation of mRNA metabolic process | 85/7958 | 118/18723 | 7.10e-11 | 2.56e-09 | 85 |
| GO:00447722 | Liver | HCC | mitotic cell cycle phase transition | 240/7958 | 424/18723 | 2.47e-09 | 6.84e-08 | 240 |
| Page: 1 2 3 |
| Pathway ID | Tissue | Disease Stage | Description | Gene Ratio | Bg Ratio | pvalue | p.adjust | qvalue | Count |
| Page: 1 |
Top |
Cell-cell communication analysis |
| Identification of potential cell-cell interactions between two cell types and their ligand-receptor pairs for different disease states |
| Ligand | Receptor | LRpair | Pathway | Tissue | Disease Stage |
| Page: 1 |
Top |
Single-cell gene regulatory network inference analysis |
| Find out the significant the regulons (TFs) and the target genes of each regulon across cell types for different disease states |
| TF | Cell Type | Tissue | Disease Stage | Target Gene | RSS | Regulon Activity |
| ∗The dot plots of a searched regulon are shown for all cell subpopulations in each disease state of each tissue based on the regulon specific score inferred using pySCENIC and by calculating the average expression. |
| Page: 1 |
Top |
Somatic mutation of malignant transformation related genes |
| Annotation of somatic variants for genes involved in malignant transformation |
| Hugo Symbol | Variant Class | Variant Classification | dbSNP RS | HGVSc | HGVSp | HGVSp Short | SWISSPROT | BIOTYPE | SIFT | PolyPhen | Tumor Sample Barcode | Tissue | Histology | Sex | Age | Stage | Therapy Types | Drugs | Outcome |
| TRIM7 | SNV | Missense_Mutation | c.872N>A | p.Arg291Lys | p.R291K | Q9C029 | protein_coding | tolerated(0.12) | benign(0.001) | TCGA-E9-A22G-01 | Breast | breast invasive carcinoma | Female | <65 | I/II | Chemotherapy | doxorubicin | SD | |
| TRIM7 | SNV | Missense_Mutation | c.475N>G | p.Arg159Gly | p.R159G | Q9C029 | protein_coding | deleterious(0.03) | possibly_damaging(0.579) | TCGA-DR-A0ZM-01 | Cervix | cervical & endocervical cancer | Female | <65 | III/IV | Unspecific | Cisplatin | SD | |
| TRIM7 | SNV | Missense_Mutation | c.855C>A | p.Phe285Leu | p.F285L | Q9C029 | protein_coding | tolerated(0.21) | benign(0) | TCGA-EA-A3QE-01 | Cervix | cervical & endocervical cancer | Female | <65 | I/II | Unknown | Unknown | SD | |
| TRIM7 | SNV | Missense_Mutation | c.1102N>A | p.Glu368Lys | p.E368K | Q9C029 | protein_coding | tolerated(0.88) | benign(0.025) | TCGA-FU-A3HZ-01 | Cervix | cervical & endocervical cancer | Female | <65 | I/II | Chemotherapy | cisplatin | CR | |
| TRIM7 | SNV | Missense_Mutation | c.944N>G | p.Ser315Cys | p.S315C | Q9C029 | protein_coding | deleterious(0) | possibly_damaging(0.818) | TCGA-MA-AA41-01 | Cervix | cervical & endocervical cancer | Female | <65 | I/II | Unknown | Unknown | SD | |
| TRIM7 | SNV | Missense_Mutation | c.1015N>C | p.Glu339Gln | p.E339Q | Q9C029 | protein_coding | tolerated(0.12) | possibly_damaging(0.868) | TCGA-Q1-A73O-01 | Cervix | cervical & endocervical cancer | Female | <65 | I/II | Chemotherapy | cisplatin | CR | |
| TRIM7 | SNV | Missense_Mutation | novel | c.1114G>C | p.Asp372His | p.D372H | Q9C029 | protein_coding | tolerated(0.09) | probably_damaging(0.993) | TCGA-VS-A9UH-01 | Cervix | cervical & endocervical cancer | Female | <65 | I/II | Chemotherapy | cisplatin | CR |
| TRIM7 | SNV | Missense_Mutation | c.950A>C | p.Lys317Thr | p.K317T | Q9C029 | protein_coding | deleterious(0) | benign(0.321) | TCGA-AA-3715-01 | Colorectum | colon adenocarcinoma | Male | >=65 | I/II | Unknown | Unknown | PD | |
| TRIM7 | SNV | Missense_Mutation | rs267600589 | c.850N>A | p.Glu284Lys | p.E284K | Q9C029 | protein_coding | deleterious(0.01) | benign(0.024) | TCGA-AA-A010-01 | Colorectum | colon adenocarcinoma | Female | <65 | I/II | Chemotherapy | folinic | CR |
| TRIM7 | SNV | Missense_Mutation | c.1378C>T | p.Arg460Cys | p.R460C | Q9C029 | protein_coding | deleterious(0) | probably_damaging(0.993) | TCGA-AD-5900-01 | Colorectum | colon adenocarcinoma | Male | >=65 | I/II | Unknown | Unknown | SD |
| Page: 1 2 3 4 5 |
Top |
Related drugs of malignant transformation related genes |
| Identification of chemicals and drugs interact with genes involved in malignant transfromation |
| (DGIdb 4.0) |
| Entrez ID | Symbol | Category | Interaction Types | Drug Claim Name | Drug Name | PMIDs |
| Page: 1 |

Copyright 2023-Present -The University of Texas Health Science Center at Houston |