Schematic overview of the cellular and molecular mechanisms involved in the cancer progression, including the proposed cellular and molecular mechanisms in cancer cells trajectory. AT1: alveolar type 1 cells; AT2: alveolar type 2 cells; AAH: atypical adenomatous hyperplasia; AIS: adenocarcinoma in situ; MIA: minimally invasive adenocarcinoma; IA: invasive adenocarcinoma; EMT: epithelial-mesenchymal transition

Home

Download

Statistics

Help

Contact

Center for Computational Systems Medicine
leaf

Gene summary

leaf

Malignant transformation analysis

leaf

Malignant transformation related pathway analysis

leaf

Cell-cell communication analysis

leaf

Single-cell gene regulatory network inference analysis

leaf

Somatic mutation of malignant transformation related genes

leaf

Related drugs of malignant transformation related genes

Gene: TRIM56

Gene summary for TRIM56

check button Gene summary.

Gene informationSpeciesHuman
Gene symbol

TRIM56

Gene ID

81844

Gene nametripartite motif containing 56
Gene AliasRNF109
Cytomap7q22.1
Gene Typeprotein-coding
GO ID

GO:0000209

UniProtAcc

Q9BRZ2


Top

Malignant transformation analysis

check button Identification of the aberrant gene expression in precancerous and cancerous lesions by comparing the gene expression of stem-like cells in diseased tissues with normal stem cells
check button Malignant transformation involving gene list.
Entrez IDSymbolReplicatesSpeciesOrganTissueAdj P-valueLog2FCMalignancy
81844TRIM56CCI_2HumanCervixCC1.87e-046.79e-010.5249
81844TRIM56CCI_3HumanCervixCC3.14e-025.00e-010.516
81844TRIM56HTA11_3410_2000001011HumanColorectumAD4.71e-042.76e-010.0155
81844TRIM56HTA11_2487_2000001011HumanColorectumSER1.19e-106.15e-01-0.1808
81844TRIM56HTA11_1938_2000001011HumanColorectumAD1.06e-105.70e-01-0.0811
81844TRIM56HTA11_78_2000001011HumanColorectumAD8.80e-106.31e-01-0.1088
81844TRIM56HTA11_347_2000001011HumanColorectumAD4.58e-288.26e-01-0.1954
81844TRIM56HTA11_411_2000001011HumanColorectumSER1.10e-061.14e+00-0.2602
81844TRIM56HTA11_2112_2000001011HumanColorectumSER4.98e-058.31e-01-0.2196
81844TRIM56HTA11_3361_2000001011HumanColorectumAD4.62e-086.08e-01-0.1207
81844TRIM56HTA11_83_2000001011HumanColorectumSER1.23e-096.23e-01-0.1526
81844TRIM56HTA11_696_2000001011HumanColorectumAD1.47e-307.85e-01-0.1464
81844TRIM56HTA11_866_2000001011HumanColorectumAD4.75e-247.19e-01-0.1001
81844TRIM56HTA11_1391_2000001011HumanColorectumAD6.33e-199.06e-01-0.059
81844TRIM56HTA11_2992_2000001011HumanColorectumSER1.12e-025.98e-01-0.1706
81844TRIM56HTA11_546_2000001011HumanColorectumAD5.50e-128.15e-01-0.0842
81844TRIM56HTA11_866_3004761011HumanColorectumAD3.61e-196.67e-010.096
81844TRIM56HTA11_8622_2000001021HumanColorectumSER1.18e-036.62e-010.0528
81844TRIM56HTA11_7663_2000001011HumanColorectumSER8.83e-046.87e-010.0131
81844TRIM56HTA11_10623_2000001011HumanColorectumAD9.17e-077.73e-01-0.0177
Page: 1 2 3 4 5 6 7 8 9 

check button Transcriptomic changes along malignancy continuum.
TissueExpression DynamicsAbbreviation
CervixThe image shows the transcriptomic changes along malignancy continuum.log2FC in expression of this searched gene in stem-like cells from each diseased tissue sample relative to stem-like cells in normal samples in each tissue plotted against the malignancy continuum. Samples are colored based on if they are from different disease stage.CC: Cervix cancer
HSIL_HPV: HPV-infected high-grade squamous intraepithelial lesions
N_HPV: HPV-infected normal cervix
Colorectum (GSE201348)The image shows the transcriptomic changes along malignancy continuum.log2FC in expression of this searched gene in stem-like cells from each diseased tissue sample relative to stem-like cells in normal samples in each tissue plotted against the malignancy continuum. Samples are colored based on if they are from different disease stage.FAP: Familial adenomatous polyposis
CRC: Colorectal cancer
Colorectum (HTA11)The image shows the transcriptomic changes along malignancy continuum.log2FC in expression of this searched gene in stem-like cells from each diseased tissue sample relative to stem-like cells in normal samples in each tissue plotted against the malignancy continuum. Samples are colored based on if they are from different disease stage.AD: Adenomas
SER: Sessile serrated lesions
MSI-H: Microsatellite-high colorectal cancer
MSS: Microsatellite stable colorectal cancer
EsophagusThe image shows the transcriptomic changes along malignancy continuum.log2FC in expression of this searched gene in stem-like cells from each diseased tissue sample relative to stem-like cells in normal samples in each tissue plotted against the malignancy continuum. Samples are colored based on if they are from different disease stage.
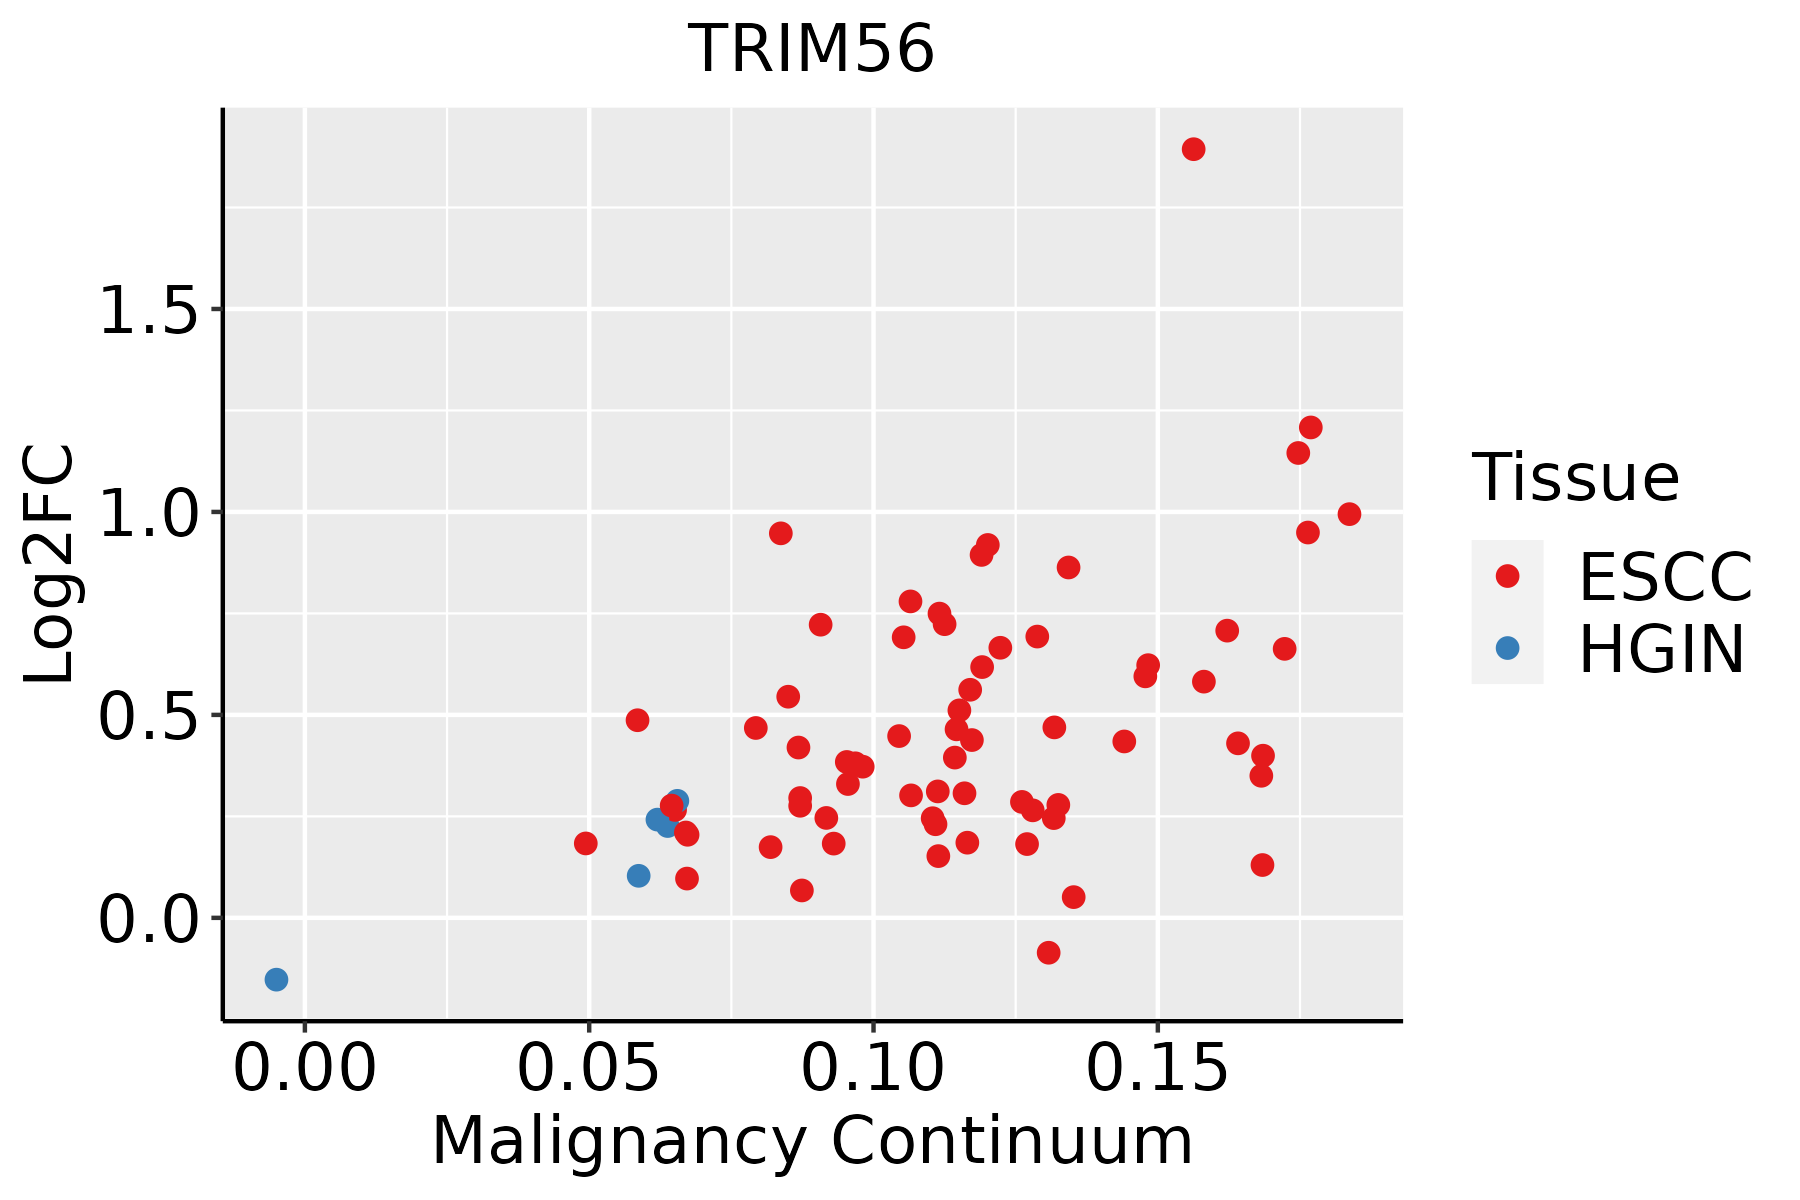
ESCC: Esophageal squamous cell carcinoma
HGIN: High-grade intraepithelial neoplasias
LGIN: Low-grade intraepithelial neoplasias
LiverThe image shows the transcriptomic changes along malignancy continuum.log2FC in expression of this searched gene in stem-like cells from each diseased tissue sample relative to stem-like cells in normal samples in each tissue plotted against the malignancy continuum. Samples are colored based on if they are from different disease stage.
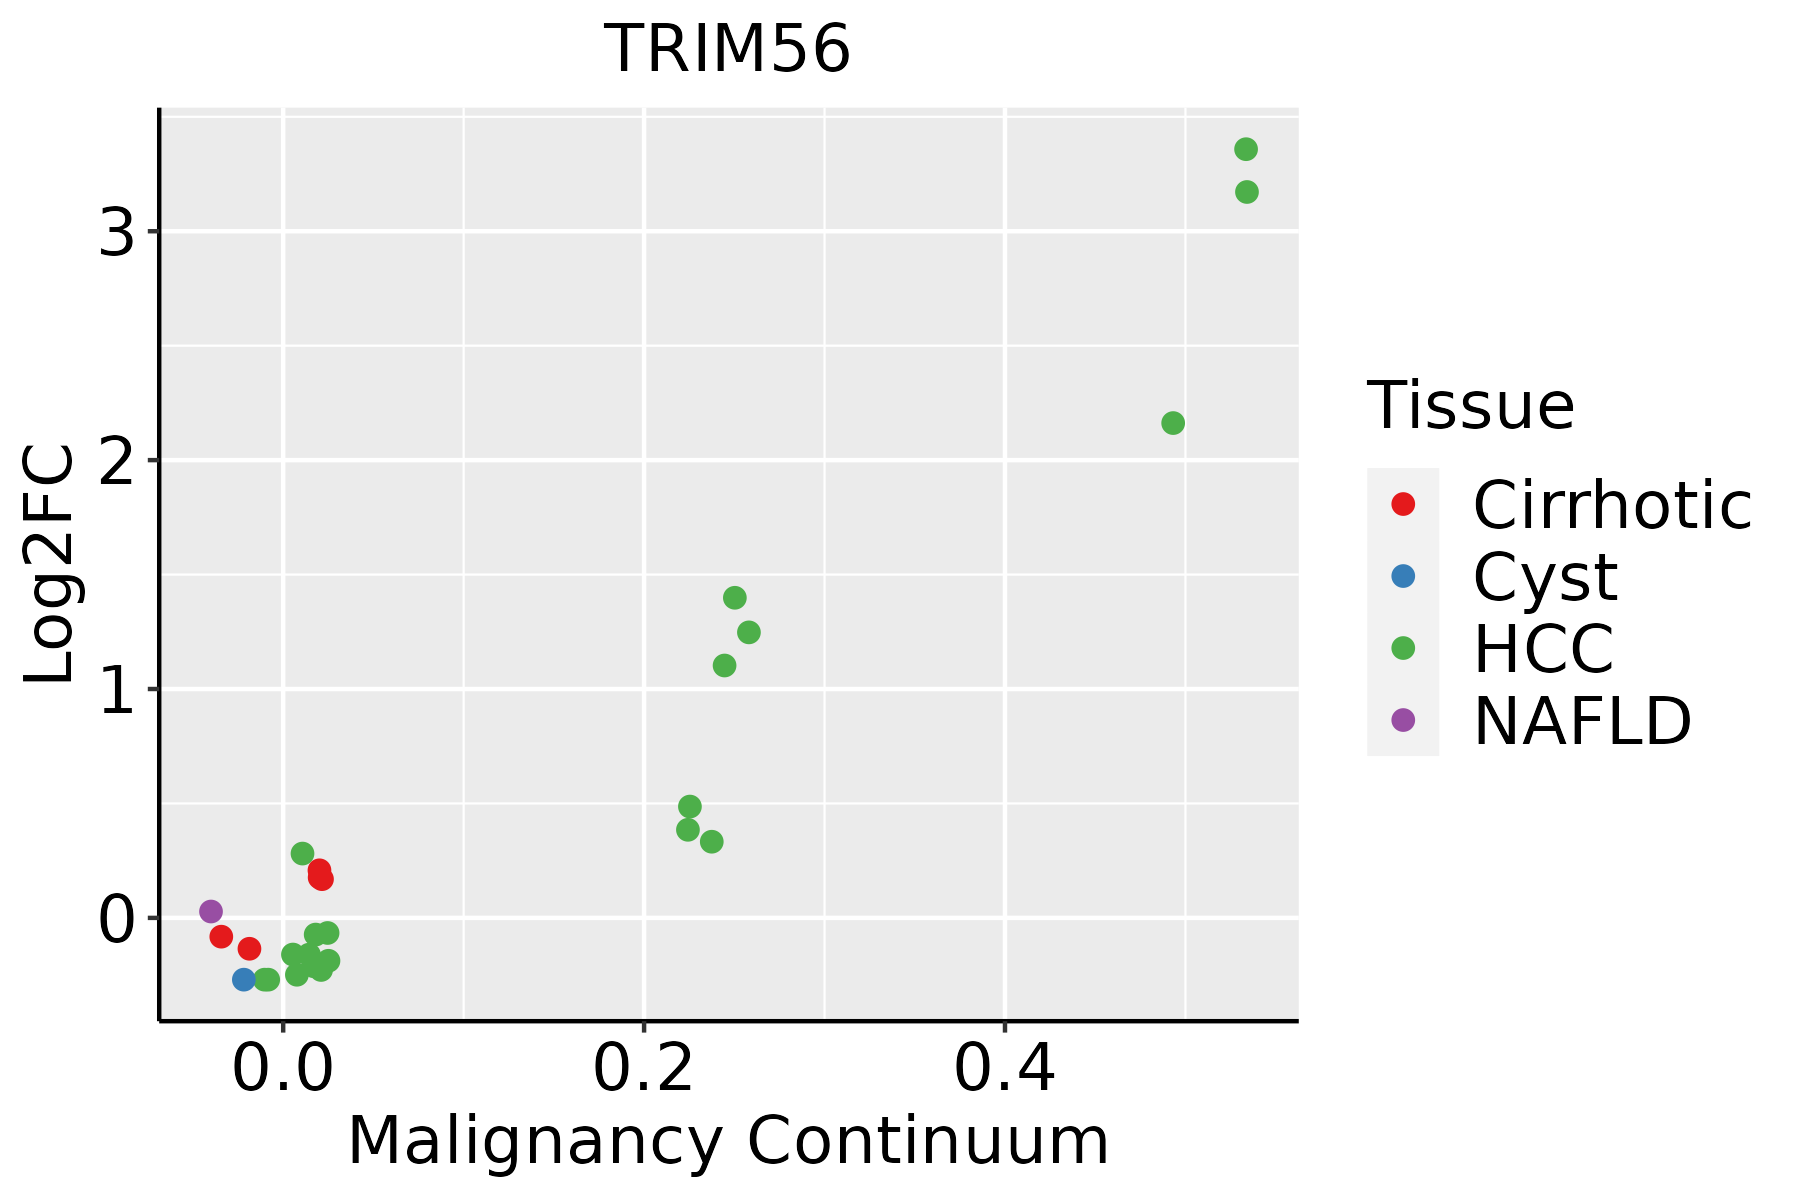
HCC: Hepatocellular carcinoma
NAFLD: Non-alcoholic fatty liver disease
Oral CavityThe image shows the transcriptomic changes along malignancy continuum.log2FC in expression of this searched gene in stem-like cells from each diseased tissue sample relative to stem-like cells in normal samples in each tissue plotted against the malignancy continuum. Samples are colored based on if they are from different disease stage.EOLP: Erosive Oral lichen planus
LP: leukoplakia
NEOLP: Non-erosive oral lichen planus
OSCC: Oral squamous cell carcinoma
ProstateThe image shows the transcriptomic changes along malignancy continuum.log2FC in expression of this searched gene in stem-like cells from each diseased tissue sample relative to stem-like cells in normal samples in each tissue plotted against the malignancy continuum. Samples are colored based on if they are from different disease stage.
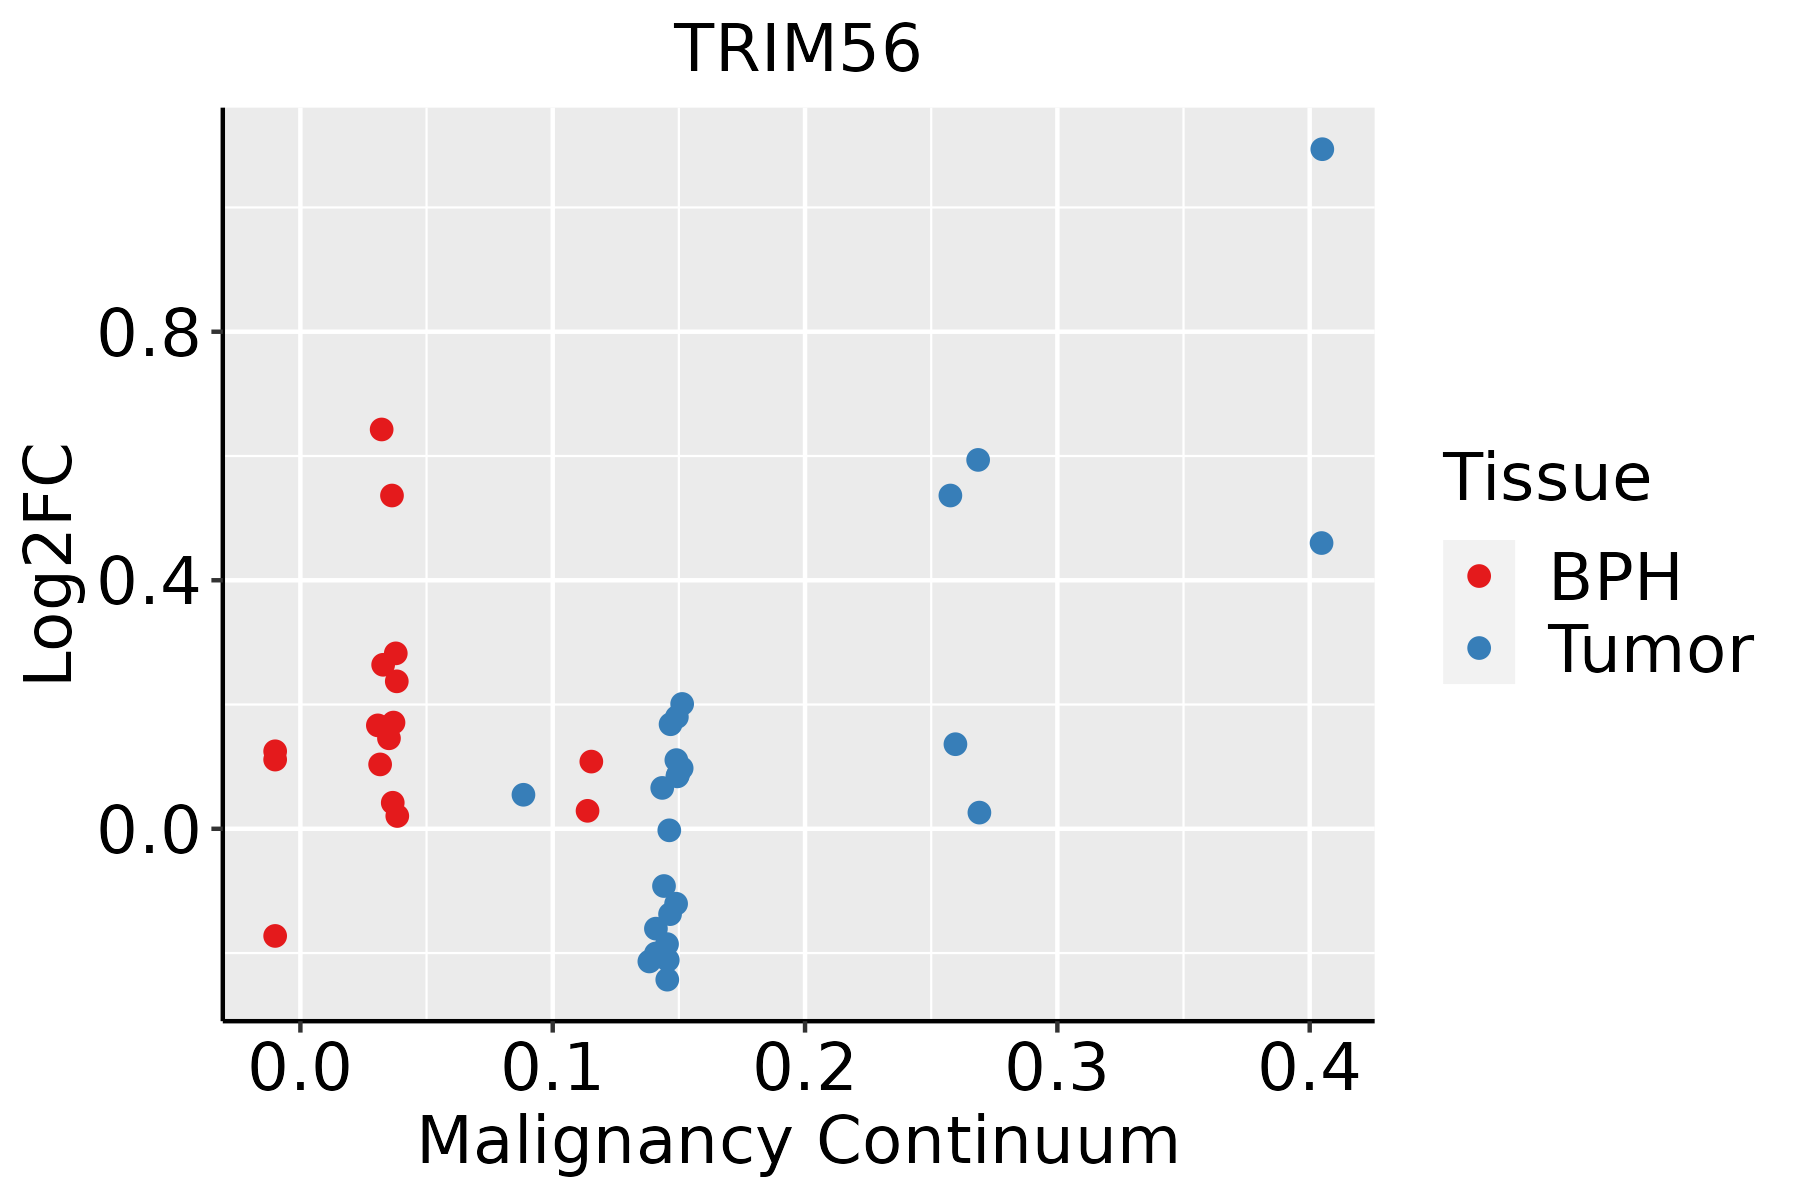
BPH: Benign Prostatic Hyperplasia
ThyroidThe image shows the transcriptomic changes along malignancy continuum.log2FC in expression of this searched gene in stem-like cells from each diseased tissue sample relative to stem-like cells in normal samples in each tissue plotted against the malignancy continuum. Samples are colored based on if they are from different disease stage.ATC: Anaplastic thyroid cancer
HT: Hashimoto's thyroiditis
PTC: Papillary thyroid cancer
∗log2FC in expression of this searched gene in stem-like cells from each diseased tissue sample relative to stem-like cells in normal samples in each tissue plotted against the malignancy continuum. Samples are colored based on if they are from different disease stage.

Top

Malignant transformation related pathway analysis

check buttonFind out the enriched GO biological processes and KEGG pathways involved in transition from healthy to precancer to cancer
check button Figure of enriched GO biological processes.
TissueDisease StageEnriched GO biological Processes
ColorectumADGO analysis - Figure of enriched GO biological processes: Top 15 enriched GO BP terms are showed in the bar plot of each disease state in each tissue. Each row represents a significant GO biological process which is colored according to the -log10(p.adjust).
ColorectumSERGO analysis - Figure of enriched GO biological processes: Top 15 enriched GO BP terms are showed in the bar plot of each disease state in each tissue. Each row represents a significant GO biological process which is colored according to the -log10(p.adjust).
ColorectumMSSGO analysis - Figure of enriched GO biological processes: Top 15 enriched GO BP terms are showed in the bar plot of each disease state in each tissue. Each row represents a significant GO biological process which is colored according to the -log10(p.adjust).
ColorectumMSI-HGO analysis - Figure of enriched GO biological processes: Top 15 enriched GO BP terms are showed in the bar plot of each disease state in each tissue. Each row represents a significant GO biological process which is colored according to the -log10(p.adjust).
ColorectumFAPGO analysis - Figure of enriched GO biological processes: Top 15 enriched GO BP terms are showed in the bar plot of each disease state in each tissue. Each row represents a significant GO biological process which is colored according to the -log10(p.adjust).
∗Top 15 enriched GO BP terms are showed in the bar plot of each disease state in each tissue. Each row represents a significant GO biological process which is colored according to the -log10(p.adjust).
Page: 1 2 3 4 5 6 7 8 9 

check button Enriched GO biological processes.
GO IDTissueDisease StageDescriptionGene RatioBg Ratiopvaluep.adjustCount
GO:00002097CervixCCprotein polyubiquitination58/2311236/187231.57e-077.41e-0658
GO:00018197CervixCCpositive regulation of cytokine production95/2311467/187234.88e-071.85e-0595
GO:00096158CervixCCresponse to virus73/2311367/187232.22e-053.95e-0473
GO:00324791CervixCCregulation of type I interferon production21/231195/187235.32e-033.10e-0221
GO:00326061CervixCCtype I interferon production21/231195/187235.32e-033.10e-0221
GO:00705343CervixCCprotein K63-linked ubiquitination14/231156/187236.93e-033.74e-0214
GO:00324815CervixCCpositive regulation of type I interferon production14/231158/187239.57e-034.73e-0214
GO:00516072CervixCCdefense response to virus46/2311265/187231.04e-024.97e-0246
GO:01405462CervixCCdefense response to symbiont46/2311265/187231.04e-024.97e-0246
GO:0000209ColorectumADprotein polyubiquitination78/3918236/187238.71e-062.06e-0478
GO:0032481ColorectumADpositive regulation of type I interferon production23/391858/187238.82e-048.53e-0323
GO:0034340ColorectumADresponse to type I interferon22/391858/187232.23e-031.75e-0222
GO:0070534ColorectumADprotein K63-linked ubiquitination20/391856/187237.57e-034.58e-0220
GO:00002091ColorectumSERprotein polyubiquitination58/2897236/187231.69e-043.18e-0358
GO:00343401ColorectumSERresponse to type I interferon17/289758/187235.50e-034.07e-0217
GO:00002092ColorectumMSSprotein polyubiquitination72/3467236/187235.19e-061.42e-0472
GO:00705341ColorectumMSSprotein K63-linked ubiquitination21/346756/187236.51e-047.06e-0321
GO:00324811ColorectumMSSpositive regulation of type I interferon production20/346758/187232.82e-032.20e-0220
GO:00343402ColorectumMSSresponse to type I interferon20/346758/187232.82e-032.20e-0220
GO:00343403ColorectumMSI-Hresponse to type I interferon13/131958/187231.58e-044.52e-0313
Page: 1 2 3 4 5 

check button Enriched KEGG pathways.
Pathway IDTissueDisease StageDescriptionGene RatioBg Ratiopvaluep.adjustqvalueCount
Page: 1 

Top

Cell-cell communication analysis

check buttonIdentification of potential cell-cell interactions between two cell types and their ligand-receptor pairs for different disease states
LigandReceptorLRpairPathwayTissueDisease Stage
Page: 1 

Top

Single-cell gene regulatory network inference analysis

check buttonFind out the significant the regulons (TFs) and the target genes of each regulon across cell types for different disease states
TFCell TypeTissueDisease StageTarget GeneRSSRegulon Activity
∗The dot plots of a searched regulon are shown for all cell subpopulations in each disease state of each tissue based on the regulon specific score inferred using pySCENIC and by calculating the average expression.
Page: 1 

Top

Somatic mutation of malignant transformation related genes

check buttonAnnotation of somatic variants for genes involved in malignant transformation
Hugo SymbolVariant ClassVariant ClassificationdbSNP RSHGVScHGVSpHGVSp ShortSWISSPROTBIOTYPESIFTPolyPhenTumor Sample BarcodeTissueHistologySexAgeStageTherapy TypesDrugsOutcome
TRIM56SNVMissense_Mutationc.1525C>Gp.Arg509Glyp.R509GQ9BRZ2protein_codingdeleterious(0.01)benign(0.238)TCGA-A8-A06X-01Breastbreast invasive carcinomaFemale>=65I/IIUnknownUnknownSD
TRIM56SNVMissense_Mutationc.49N>Tp.Asp17Tyrp.D17YQ9BRZ2protein_codingdeleterious(0)probably_damaging(0.968)TCGA-AO-A124-01Breastbreast invasive carcinomaFemale<65I/IIChemotherapydoxorubicinSD
TRIM56SNVMissense_Mutationc.1534N>Ap.Gly512Argp.G512RQ9BRZ2protein_codingdeleterious(0)probably_damaging(0.981)TCGA-D8-A1Y1-01Breastbreast invasive carcinomaFemale>=65III/IVHormone TherapytamoxiphenPD
TRIM56SNVMissense_Mutationnovelc.1594N>Gp.Lys532Glup.K532EQ9BRZ2protein_codingdeleterious(0)possibly_damaging(0.803)TCGA-E2-A155-01Breastbreast invasive carcinomaFemale<65I/IIChemotherapycytoxanSD
TRIM56insertionNonsense_Mutationnovelc.59_60insTCAAACTCTCGGTTTGATGATGTGGCATTTAGCATGAGTGAp.Cys21GlnfsTer12p.C21Qfs*12Q9BRZ2protein_codingTCGA-A8-A07J-01Breastbreast invasive carcinomaFemale<65I/IIChemotherapy5-fluorouracilCR
TRIM56SNVMissense_Mutationrs200430251c.1831G>Ap.Val611Metp.V611MQ9BRZ2protein_codingdeleterious(0)probably_damaging(0.988)TCGA-2W-A8YY-01Cervixcervical & endocervical cancerFemale<65I/IIChemotherapycisplatinCR
TRIM56SNVMissense_Mutationc.397N>Tp.Asp133Tyrp.D133YQ9BRZ2protein_codingdeleterious(0.03)probably_damaging(0.984)TCGA-C5-A1BL-01Cervixcervical & endocervical cancerFemale<65I/IIUnknownUnknownSD
TRIM56SNVMissense_Mutationnovelc.1462N>Ap.Leu488Ilep.L488IQ9BRZ2protein_codingtolerated(0.07)possibly_damaging(0.522)TCGA-VS-A9UJ-01Cervixcervical & endocervical cancerFemale<65I/IIUnknownUnknownPD
TRIM56SNVMissense_Mutationc.1864N>Tp.Thr622Serp.T622SQ9BRZ2protein_codingtolerated(0.95)probably_damaging(0.935)TCGA-A6-5666-01Colorectumcolon adenocarcinomaMale>=65I/IIUnknownUnknownPD
TRIM56SNVMissense_Mutationrs546901188c.2252G>Ap.Arg751Hisp.R751HQ9BRZ2protein_codingdeleterious_low_confidence(0.03)benign(0.382)TCGA-AA-3492-01Colorectumcolon adenocarcinomaFemale>=65I/IIUnknownUnknownSD
Page: 1 2 3 4 5 6 7 8 

Top

Related drugs of malignant transformation related genes

check buttonIdentification of chemicals and drugs interact with genes involved in malignant transfromation
(DGIdb 4.0)
Entrez IDSymbolCategoryInteraction TypesDrug Claim NameDrug NamePMIDs
Page: 1