
|
|||||
|
 | |
| |
| |
| |
| |
| |
|
Gene: TRIM5 |
Gene summary for TRIM5 |
| Gene information | Species | Human | Gene symbol | TRIM5 | Gene ID | 85363 |
| Gene name | tripartite motif containing 5 | |
| Gene Alias | RNF88 | |
| Cytomap | 11p15.4 | |
| Gene Type | protein-coding | GO ID | GO:0000165 | UniProtAcc | Q9C035 |
Top |
Malignant transformation analysis |
| Identification of the aberrant gene expression in precancerous and cancerous lesions by comparing the gene expression of stem-like cells in diseased tissues with normal stem cells |
| Entrez ID | Symbol | Replicates | Species | Organ | Tissue | Adj P-value | Log2FC | Malignancy |
| 85363 | TRIM5 | HTA11_3410_2000001011 | Human | Colorectum | AD | 2.00e-02 | 1.41e-01 | 0.0155 |
| 85363 | TRIM5 | HTA11_1938_2000001011 | Human | Colorectum | AD | 1.07e-05 | 3.08e-01 | -0.0811 |
| 85363 | TRIM5 | HTA11_78_2000001011 | Human | Colorectum | AD | 1.82e-03 | 2.79e-01 | -0.1088 |
| 85363 | TRIM5 | HTA11_347_2000001011 | Human | Colorectum | AD | 7.64e-09 | 3.08e-01 | -0.1954 |
| 85363 | TRIM5 | HTA11_696_2000001011 | Human | Colorectum | AD | 1.44e-03 | 1.88e-01 | -0.1464 |
| 85363 | TRIM5 | HTA11_866_2000001011 | Human | Colorectum | AD | 1.72e-06 | 2.15e-01 | -0.1001 |
| 85363 | TRIM5 | HTA11_1391_2000001011 | Human | Colorectum | AD | 8.45e-07 | 3.33e-01 | -0.059 |
| 85363 | TRIM5 | HTA11_546_2000001011 | Human | Colorectum | AD | 4.07e-09 | 4.35e-01 | -0.0842 |
| 85363 | TRIM5 | HTA11_866_3004761011 | Human | Colorectum | AD | 2.47e-03 | 1.90e-01 | 0.096 |
| 85363 | TRIM5 | HTA11_7663_2000001011 | Human | Colorectum | SER | 7.67e-04 | 4.66e-01 | 0.0131 |
| 85363 | TRIM5 | HTA11_10711_2000001011 | Human | Colorectum | AD | 1.22e-05 | 2.52e-01 | 0.0338 |
| 85363 | TRIM5 | HTA11_7696_3000711011 | Human | Colorectum | AD | 1.13e-05 | 1.98e-01 | 0.0674 |
| 85363 | TRIM5 | HTA11_6818_2000001011 | Human | Colorectum | AD | 1.40e-02 | 3.44e-01 | 0.0112 |
| 85363 | TRIM5 | HTA11_6818_2000001021 | Human | Colorectum | AD | 3.07e-03 | 2.67e-01 | 0.0588 |
| 85363 | TRIM5 | HTA11_99999970781_79442 | Human | Colorectum | MSS | 3.59e-21 | 6.51e-01 | 0.294 |
| 85363 | TRIM5 | HTA11_99999965104_69814 | Human | Colorectum | MSS | 4.33e-03 | 2.97e-01 | 0.281 |
| 85363 | TRIM5 | HTA11_99999971662_82457 | Human | Colorectum | MSS | 8.05e-13 | 3.32e-01 | 0.3859 |
| 85363 | TRIM5 | HTA11_99999974143_84620 | Human | Colorectum | MSS | 1.85e-10 | 2.82e-01 | 0.3005 |
| 85363 | TRIM5 | LZE8T | Human | Esophagus | ESCC | 2.13e-02 | 1.03e-01 | 0.067 |
| 85363 | TRIM5 | LZE24T | Human | Esophagus | ESCC | 3.70e-08 | 2.95e-01 | 0.0596 |
| Page: 1 2 3 4 |
| Tissue | Expression Dynamics | Abbreviation |
| Colorectum (GSE201348) |  | FAP: Familial adenomatous polyposis |
| CRC: Colorectal cancer | ||
| Colorectum (HTA11) |  | AD: Adenomas |
| SER: Sessile serrated lesions | ||
| MSI-H: Microsatellite-high colorectal cancer | ||
| MSS: Microsatellite stable colorectal cancer | ||
| Esophagus | 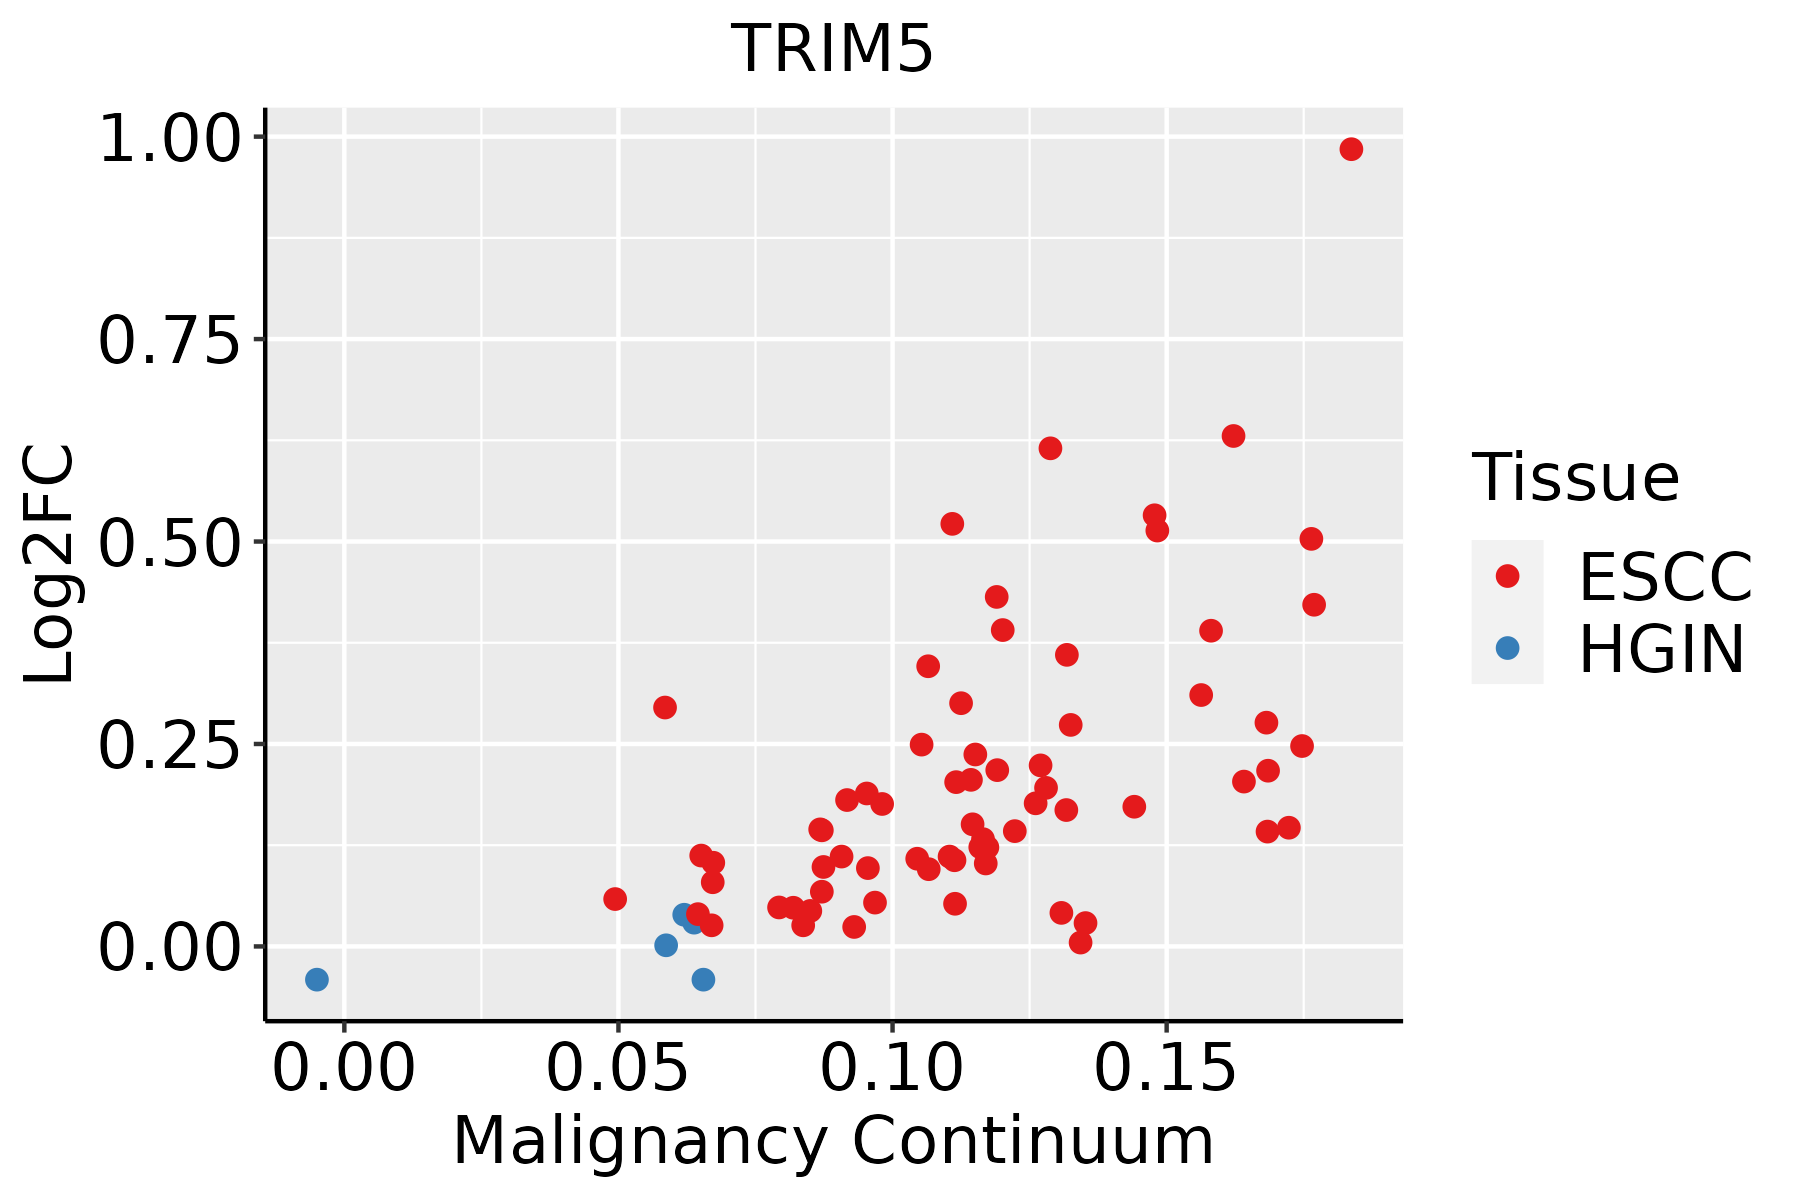 | ESCC: Esophageal squamous cell carcinoma |
| HGIN: High-grade intraepithelial neoplasias | ||
| LGIN: Low-grade intraepithelial neoplasias | ||
| Liver | 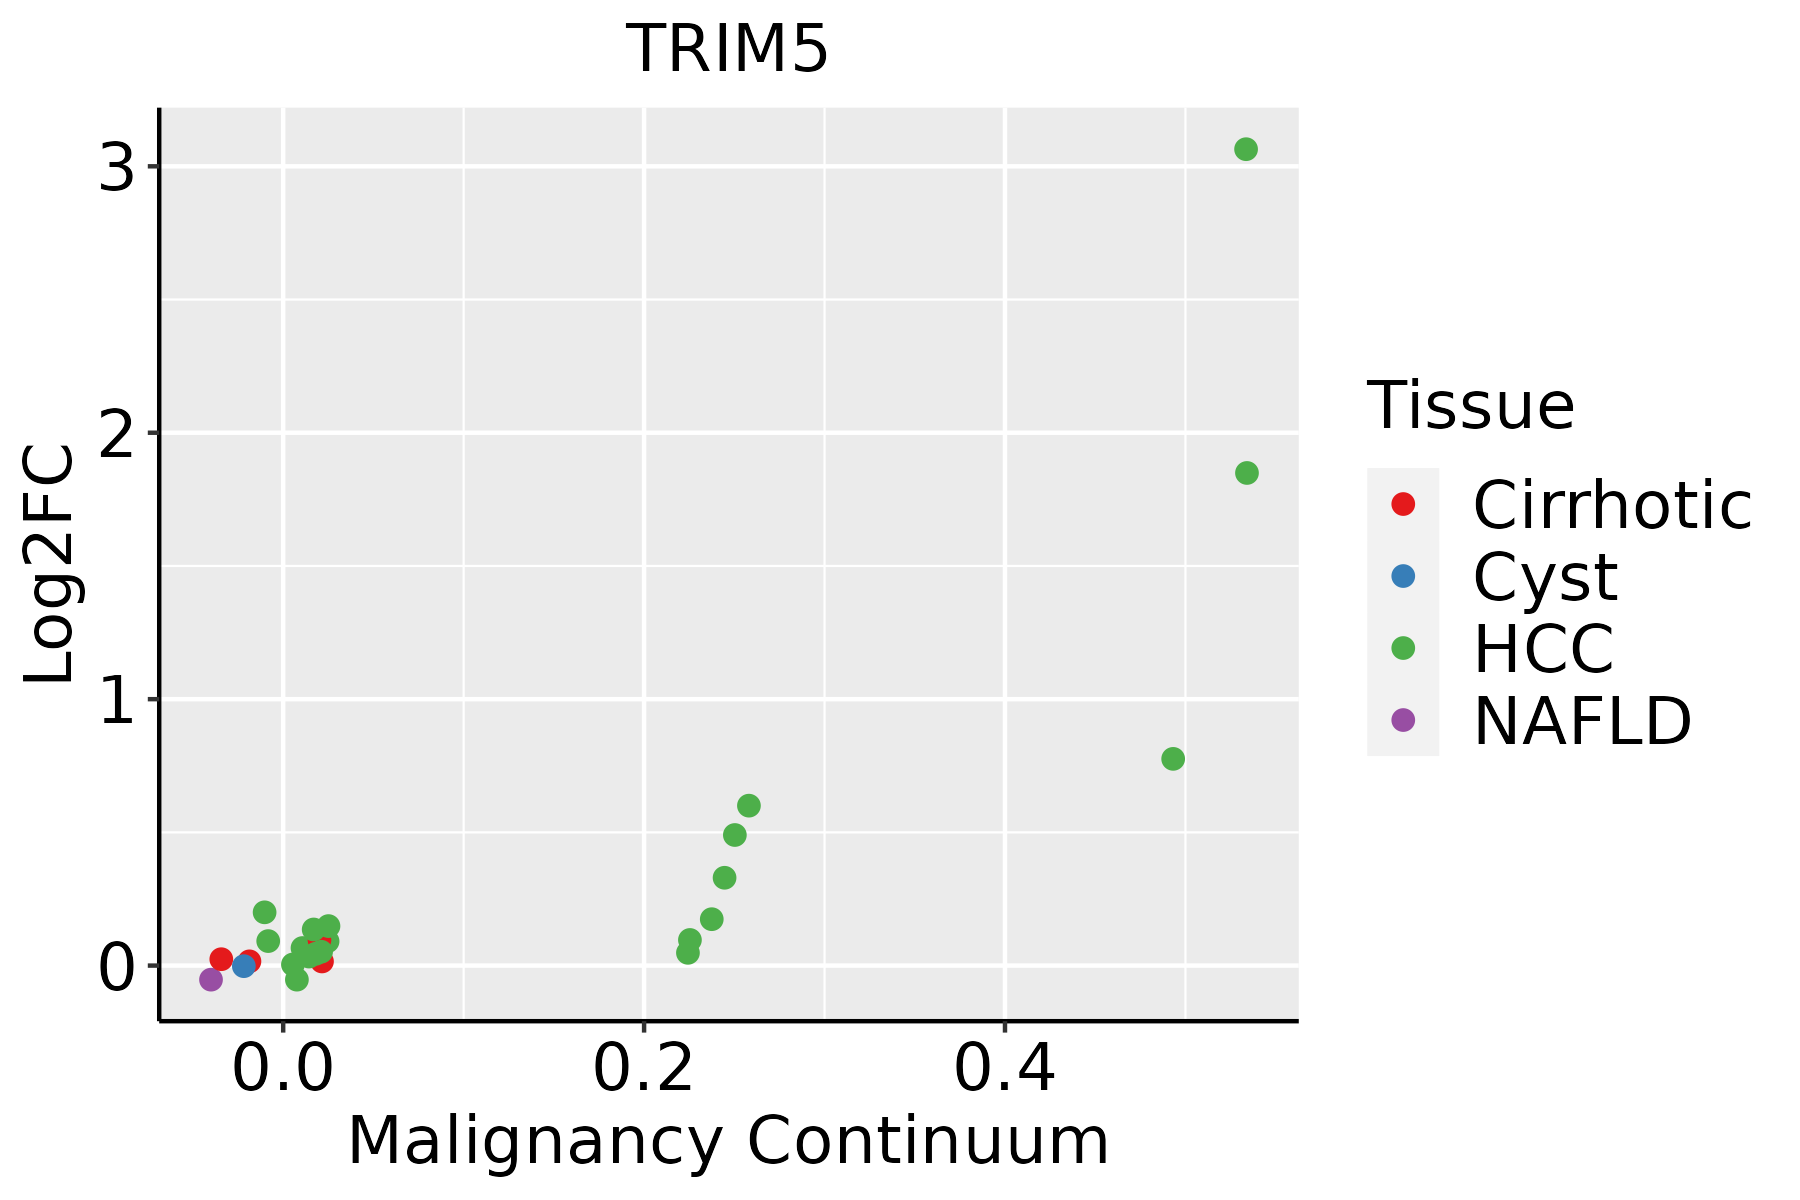 | HCC: Hepatocellular carcinoma |
| NAFLD: Non-alcoholic fatty liver disease |
| ∗log2FC in expression of this searched gene in stem-like cells from each diseased tissue sample relative to stem-like cells in normal samples in each tissue plotted against the malignancy continuum. Samples are colored based on if they are from different disease stage. |
Top |
Malignant transformation related pathway analysis |
| Find out the enriched GO biological processes and KEGG pathways involved in transition from healthy to precancer to cancer |
| Tissue | Disease Stage | Enriched GO biological Processes |
| Colorectum | AD |  |
| Colorectum | SER |  |
| Colorectum | MSS |  |
| Colorectum | MSI-H |  |
| Colorectum | FAP |  |
| ∗Top 15 enriched GO BP terms are showed in the bar plot of each disease state in each tissue. Each row represents a significant GO biological process which is colored according to the -log10(p.adjust). |
| Page: 1 2 3 4 5 6 7 8 9 |
| GO ID | Tissue | Disease Stage | Description | Gene Ratio | Bg Ratio | pvalue | p.adjust | Count |
| GO:00002097 | Cervix | CC | protein polyubiquitination | 58/2311 | 236/18723 | 1.57e-07 | 7.41e-06 | 58 |
| GO:00018197 | Cervix | CC | positive regulation of cytokine production | 95/2311 | 467/18723 | 4.88e-07 | 1.85e-05 | 95 |
| GO:00096158 | Cervix | CC | response to virus | 73/2311 | 367/18723 | 2.22e-05 | 3.95e-04 | 73 |
| GO:00324791 | Cervix | CC | regulation of type I interferon production | 21/2311 | 95/18723 | 5.32e-03 | 3.10e-02 | 21 |
| GO:00326061 | Cervix | CC | type I interferon production | 21/2311 | 95/18723 | 5.32e-03 | 3.10e-02 | 21 |
| GO:00705343 | Cervix | CC | protein K63-linked ubiquitination | 14/2311 | 56/18723 | 6.93e-03 | 3.74e-02 | 14 |
| GO:00324815 | Cervix | CC | positive regulation of type I interferon production | 14/2311 | 58/18723 | 9.57e-03 | 4.73e-02 | 14 |
| GO:00516072 | Cervix | CC | defense response to virus | 46/2311 | 265/18723 | 1.04e-02 | 4.97e-02 | 46 |
| GO:01405462 | Cervix | CC | defense response to symbiont | 46/2311 | 265/18723 | 1.04e-02 | 4.97e-02 | 46 |
| GO:0016032 | Colorectum | AD | viral process | 168/3918 | 415/18723 | 4.67e-20 | 3.66e-17 | 168 |
| GO:0009896 | Colorectum | AD | positive regulation of catabolic process | 180/3918 | 492/18723 | 4.33e-16 | 1.94e-13 | 180 |
| GO:0031331 | Colorectum | AD | positive regulation of cellular catabolic process | 156/3918 | 427/18723 | 4.68e-14 | 1.05e-11 | 156 |
| GO:0019058 | Colorectum | AD | viral life cycle | 119/3918 | 317/18723 | 6.18e-12 | 8.23e-10 | 119 |
| GO:0010506 | Colorectum | AD | regulation of autophagy | 111/3918 | 317/18723 | 3.57e-09 | 2.35e-07 | 111 |
| GO:0044403 | Colorectum | AD | biological process involved in symbiotic interaction | 99/3918 | 290/18723 | 1.02e-07 | 4.93e-06 | 99 |
| GO:0051701 | Colorectum | AD | biological process involved in interaction with host | 73/3918 | 203/18723 | 5.08e-07 | 1.88e-05 | 73 |
| GO:0052126 | Colorectum | AD | movement in host environment | 63/3918 | 175/18723 | 2.85e-06 | 8.11e-05 | 63 |
| GO:0050792 | Colorectum | AD | regulation of viral process | 59/3918 | 164/18723 | 5.95e-06 | 1.52e-04 | 59 |
| GO:0000209 | Colorectum | AD | protein polyubiquitination | 78/3918 | 236/18723 | 8.71e-06 | 2.06e-04 | 78 |
| GO:0046718 | Colorectum | AD | viral entry into host cell | 51/3918 | 144/18723 | 3.99e-05 | 7.16e-04 | 51 |
| Page: 1 2 3 4 5 6 7 8 9 10 11 12 |
| Pathway ID | Tissue | Disease Stage | Description | Gene Ratio | Bg Ratio | pvalue | p.adjust | qvalue | Count |
| hsa05170 | Colorectum | AD | Human immunodeficiency virus 1 infection | 72/2092 | 212/8465 | 1.40e-03 | 8.46e-03 | 5.39e-03 | 72 |
| hsa051701 | Colorectum | AD | Human immunodeficiency virus 1 infection | 72/2092 | 212/8465 | 1.40e-03 | 8.46e-03 | 5.39e-03 | 72 |
| hsa051704 | Colorectum | MSS | Human immunodeficiency virus 1 infection | 69/1875 | 212/8465 | 2.66e-04 | 1.98e-03 | 1.21e-03 | 69 |
| hsa03250 | Colorectum | MSS | Viral life cycle - HIV-1 | 23/1875 | 63/8465 | 6.55e-03 | 2.64e-02 | 1.62e-02 | 23 |
| hsa051705 | Colorectum | MSS | Human immunodeficiency virus 1 infection | 69/1875 | 212/8465 | 2.66e-04 | 1.98e-03 | 1.21e-03 | 69 |
| hsa032501 | Colorectum | MSS | Viral life cycle - HIV-1 | 23/1875 | 63/8465 | 6.55e-03 | 2.64e-02 | 1.62e-02 | 23 |
| hsa032509 | Esophagus | ESCC | Viral life cycle - HIV-1 | 54/4205 | 63/8465 | 2.01e-09 | 2.17e-08 | 1.11e-08 | 54 |
| hsa05170210 | Esophagus | ESCC | Human immunodeficiency virus 1 infection | 147/4205 | 212/8465 | 3.37e-09 | 3.53e-08 | 1.81e-08 | 147 |
| hsa0325014 | Esophagus | ESCC | Viral life cycle - HIV-1 | 54/4205 | 63/8465 | 2.01e-09 | 2.17e-08 | 1.11e-08 | 54 |
| hsa0517038 | Esophagus | ESCC | Human immunodeficiency virus 1 infection | 147/4205 | 212/8465 | 3.37e-09 | 3.53e-08 | 1.81e-08 | 147 |
| hsa032502 | Liver | HCC | Viral life cycle - HIV-1 | 46/4020 | 63/8465 | 3.25e-05 | 1.88e-04 | 1.04e-04 | 46 |
| hsa051709 | Liver | HCC | Human immunodeficiency virus 1 infection | 125/4020 | 212/8465 | 4.51e-04 | 1.94e-03 | 1.08e-03 | 125 |
| hsa0325011 | Liver | HCC | Viral life cycle - HIV-1 | 46/4020 | 63/8465 | 3.25e-05 | 1.88e-04 | 1.04e-04 | 46 |
| hsa0517012 | Liver | HCC | Human immunodeficiency virus 1 infection | 125/4020 | 212/8465 | 4.51e-04 | 1.94e-03 | 1.08e-03 | 125 |
| Page: 1 |
Top |
Cell-cell communication analysis |
| Identification of potential cell-cell interactions between two cell types and their ligand-receptor pairs for different disease states |
| Ligand | Receptor | LRpair | Pathway | Tissue | Disease Stage |
| Page: 1 |
Top |
Single-cell gene regulatory network inference analysis |
| Find out the significant the regulons (TFs) and the target genes of each regulon across cell types for different disease states |
| TF | Cell Type | Tissue | Disease Stage | Target Gene | RSS | Regulon Activity |
| ∗The dot plots of a searched regulon are shown for all cell subpopulations in each disease state of each tissue based on the regulon specific score inferred using pySCENIC and by calculating the average expression. |
| Page: 1 |
Top |
Somatic mutation of malignant transformation related genes |
| Annotation of somatic variants for genes involved in malignant transformation |
| Hugo Symbol | Variant Class | Variant Classification | dbSNP RS | HGVSc | HGVSp | HGVSp Short | SWISSPROT | BIOTYPE | SIFT | PolyPhen | Tumor Sample Barcode | Tissue | Histology | Sex | Age | Stage | Therapy Types | Drugs | Outcome |
| TRIM5 | SNV | Missense_Mutation | novel | c.814C>G | p.Gln272Glu | p.Q272E | Q9C035 | protein_coding | tolerated(1) | benign(0.001) | TCGA-3C-AALI-01 | Breast | breast invasive carcinoma | Female | <65 | I/II | Unspecific | Poly E | Complete Response |
| TRIM5 | SNV | Missense_Mutation | c.1052N>G | p.Ser351Cys | p.S351C | Q9C035 | protein_coding | tolerated(0.28) | benign(0.033) | TCGA-BH-A0B5-01 | Breast | breast invasive carcinoma | Female | <65 | III/IV | Chemotherapy | adriamycin | CR | |
| TRIM5 | SNV | Missense_Mutation | novel | c.1444N>C | p.Cys482Arg | p.C482R | Q9C035 | protein_coding | deleterious(0) | benign(0.35) | TCGA-2W-A8YY-01 | Cervix | cervical & endocervical cancer | Female | <65 | I/II | Chemotherapy | cisplatin | CR |
| TRIM5 | SNV | Missense_Mutation | novel | c.465N>C | p.Glu155Asp | p.E155D | Q9C035 | protein_coding | tolerated(0.08) | benign(0.049) | TCGA-2W-A8YY-01 | Cervix | cervical & endocervical cancer | Female | <65 | I/II | Chemotherapy | cisplatin | CR |
| TRIM5 | SNV | Missense_Mutation | c.262N>C | p.Glu88Gln | p.E88Q | Q9C035 | protein_coding | tolerated(0.13) | possibly_damaging(0.77) | TCGA-Q1-A73O-01 | Cervix | cervical & endocervical cancer | Female | <65 | I/II | Chemotherapy | cisplatin | CR | |
| TRIM5 | insertion | In_Frame_Ins | novel | c.261_262insCAG | p.Pro87_Glu88insGln | p.P87_E88insQ | Q9C035 | protein_coding | TCGA-DS-A1OB-01 | Cervix | cervical & endocervical cancer | Female | <65 | I/II | Chemotherapy | carboplatin | PD | ||
| TRIM5 | SNV | Missense_Mutation | c.1024T>G | p.Phe342Val | p.F342V | Q9C035 | protein_coding | tolerated(0.49) | benign(0.001) | TCGA-A6-6141-01 | Colorectum | colon adenocarcinoma | Male | <65 | I/II | Chemotherapy | 5-fu | SD | |
| TRIM5 | SNV | Missense_Mutation | rs759560671 | c.830G>A | p.Arg277Gln | p.R277Q | Q9C035 | protein_coding | tolerated(0.48) | benign(0.094) | TCGA-AA-A00N-01 | Colorectum | colon adenocarcinoma | Male | >=65 | I/II | Unknown | Unknown | PD |
| TRIM5 | SNV | Missense_Mutation | c.1340G>A | p.Cys447Tyr | p.C447Y | Q9C035 | protein_coding | deleterious(0.01) | possibly_damaging(0.689) | TCGA-CM-5861-01 | Colorectum | colon adenocarcinoma | Female | <65 | I/II | Unknown | Unknown | PD | |
| TRIM5 | insertion | Frame_Shift_Ins | novel | c.1169dupA | p.Asn390LysfsTer2 | p.N390Kfs*2 | Q9C035 | protein_coding | TCGA-G4-6628-01 | Colorectum | colon adenocarcinoma | Male | >=65 | I/II | Unknown | Unknown | SD |
| Page: 1 2 3 4 5 6 |
Top |
Related drugs of malignant transformation related genes |
| Identification of chemicals and drugs interact with genes involved in malignant transfromation |
| (DGIdb 4.0) |
| Entrez ID | Symbol | Category | Interaction Types | Drug Claim Name | Drug Name | PMIDs |
| 85363 | TRIM5 | ENZYME, B30_2 SPRY DOMAIN, DRUGGABLE GENOME | carboplatin | CARBOPLATIN | ||
| 85363 | TRIM5 | ENZYME, B30_2 SPRY DOMAIN, DRUGGABLE GENOME | paclitaxel | PACLITAXEL |
| Page: 1 |

Copyright 2023-Present -The University of Texas Health Science Center at Houston |