
|
|||||
|
 | |
| |
| |
| |
| |
| |
|
Gene: TRIM47 |
Gene summary for TRIM47 |
| Gene information | Species | Human | Gene symbol | TRIM47 | Gene ID | 91107 |
| Gene name | tripartite motif containing 47 | |
| Gene Alias | GOA | |
| Cytomap | 17q25.1 | |
| Gene Type | protein-coding | GO ID | GO:0006464 | UniProtAcc | Q96LD4 |
Top |
Malignant transformation analysis |
| Identification of the aberrant gene expression in precancerous and cancerous lesions by comparing the gene expression of stem-like cells in diseased tissues with normal stem cells |
| Entrez ID | Symbol | Replicates | Species | Organ | Tissue | Adj P-value | Log2FC | Malignancy |
| 91107 | TRIM47 | LZE4T | Human | Esophagus | ESCC | 7.87e-05 | 1.50e-02 | 0.0811 |
| 91107 | TRIM47 | LZE7T | Human | Esophagus | ESCC | 2.19e-03 | 2.13e-02 | 0.0667 |
| 91107 | TRIM47 | LZE8T | Human | Esophagus | ESCC | 1.63e-06 | 1.39e-01 | 0.067 |
| 91107 | TRIM47 | LZE20T | Human | Esophagus | ESCC | 6.29e-05 | 9.25e-02 | 0.0662 |
| 91107 | TRIM47 | LZE22T | Human | Esophagus | ESCC | 2.38e-09 | 6.80e-01 | 0.068 |
| 91107 | TRIM47 | P1T-E | Human | Esophagus | ESCC | 7.85e-16 | 5.60e-01 | 0.0875 |
| 91107 | TRIM47 | P2T-E | Human | Esophagus | ESCC | 1.20e-37 | 8.95e-01 | 0.1177 |
| 91107 | TRIM47 | P4T-E | Human | Esophagus | ESCC | 2.97e-15 | 3.71e-01 | 0.1323 |
| 91107 | TRIM47 | P5T-E | Human | Esophagus | ESCC | 3.30e-14 | 2.66e-01 | 0.1327 |
| 91107 | TRIM47 | P8T-E | Human | Esophagus | ESCC | 1.55e-22 | 4.55e-01 | 0.0889 |
| 91107 | TRIM47 | P9T-E | Human | Esophagus | ESCC | 8.39e-12 | 1.77e-01 | 0.1131 |
| 91107 | TRIM47 | P11T-E | Human | Esophagus | ESCC | 2.46e-38 | 2.13e+00 | 0.1426 |
| 91107 | TRIM47 | P12T-E | Human | Esophagus | ESCC | 1.20e-08 | 2.10e-01 | 0.1122 |
| 91107 | TRIM47 | P15T-E | Human | Esophagus | ESCC | 1.74e-10 | 2.19e-01 | 0.1149 |
| 91107 | TRIM47 | P16T-E | Human | Esophagus | ESCC | 1.81e-21 | 4.21e-01 | 0.1153 |
| 91107 | TRIM47 | P17T-E | Human | Esophagus | ESCC | 3.12e-14 | 7.17e-01 | 0.1278 |
| 91107 | TRIM47 | P19T-E | Human | Esophagus | ESCC | 1.81e-12 | 9.02e-01 | 0.1662 |
| 91107 | TRIM47 | P20T-E | Human | Esophagus | ESCC | 5.90e-78 | 2.09e+00 | 0.1124 |
| 91107 | TRIM47 | P21T-E | Human | Esophagus | ESCC | 8.69e-58 | 1.03e+00 | 0.1617 |
| 91107 | TRIM47 | P22T-E | Human | Esophagus | ESCC | 3.82e-22 | 4.40e-01 | 0.1236 |
| Page: 1 2 3 4 5 6 7 |
| Tissue | Expression Dynamics | Abbreviation |
| Esophagus | 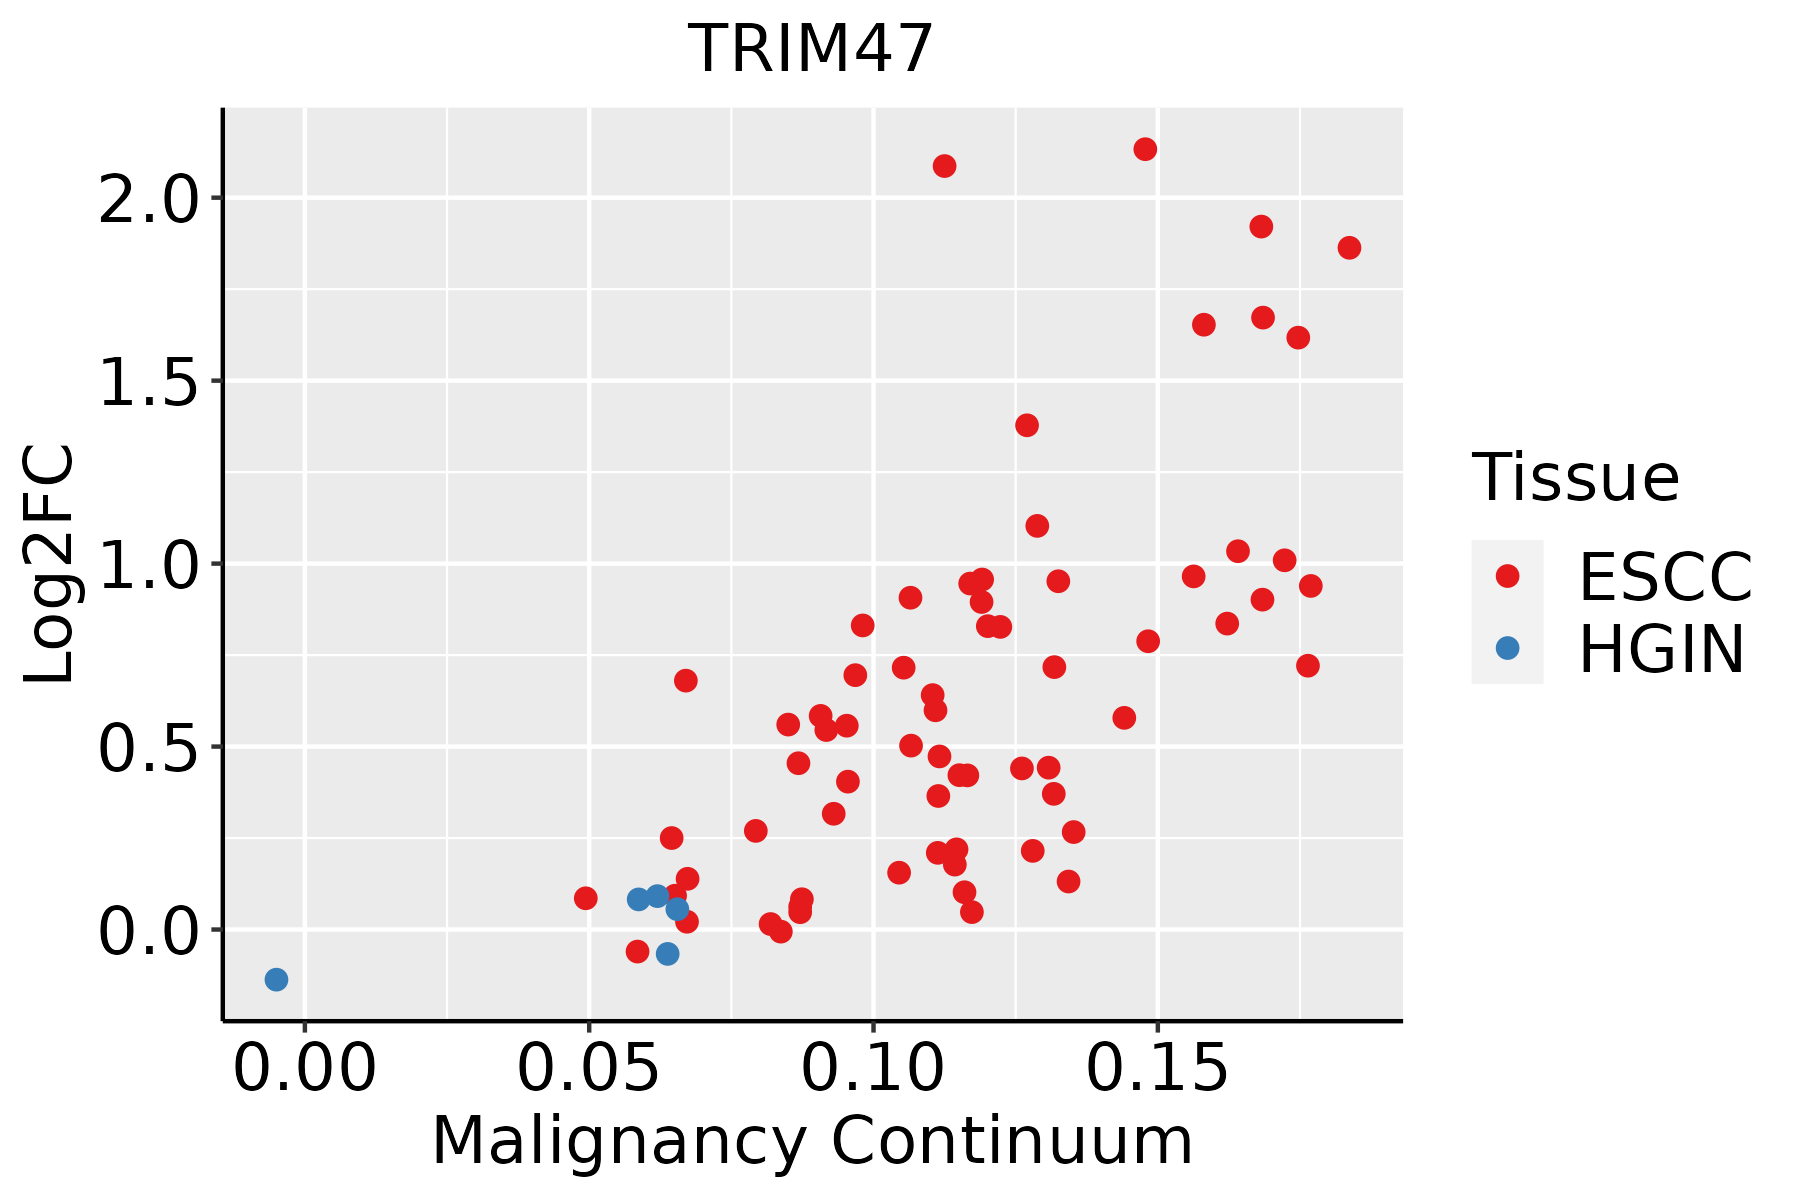 | ESCC: Esophageal squamous cell carcinoma |
| HGIN: High-grade intraepithelial neoplasias | ||
| LGIN: Low-grade intraepithelial neoplasias | ||
| Liver | 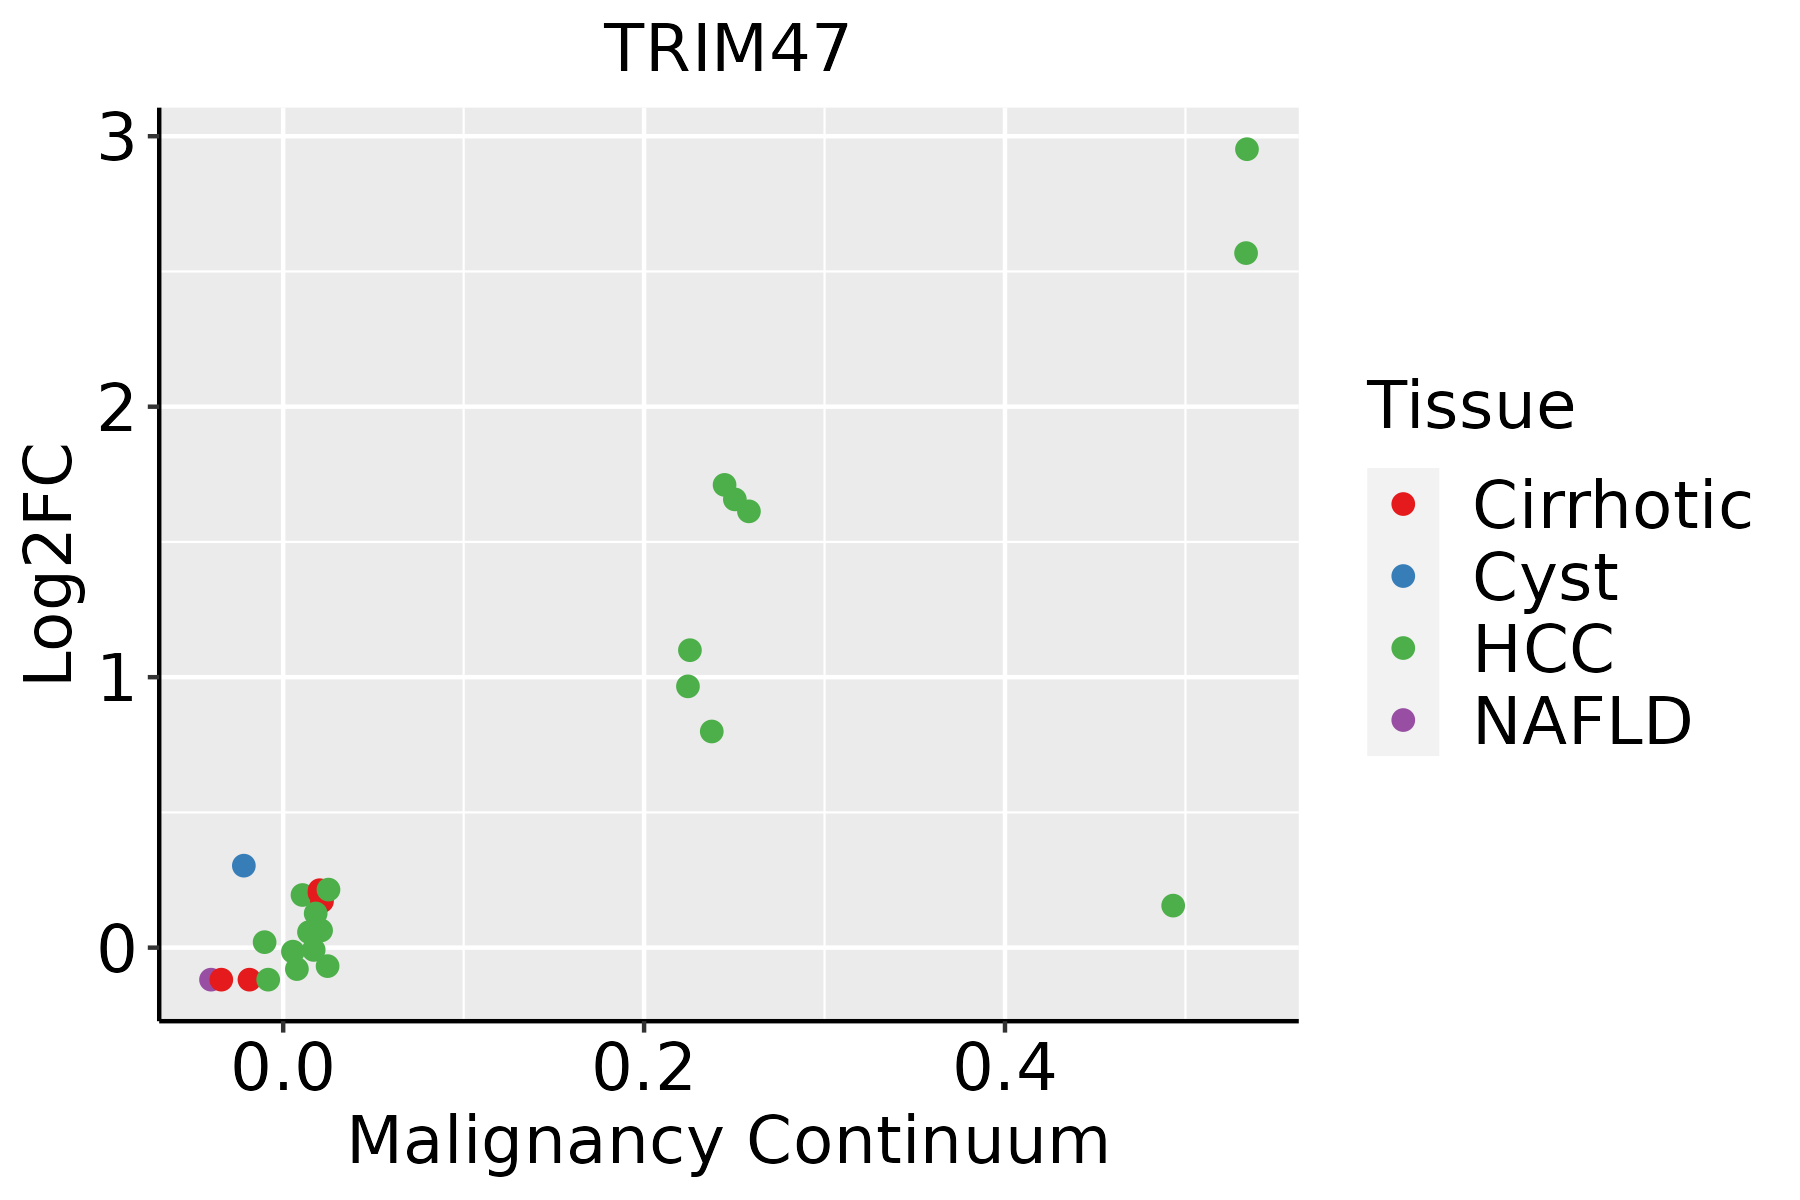 | HCC: Hepatocellular carcinoma |
| NAFLD: Non-alcoholic fatty liver disease | ||
| Oral Cavity | 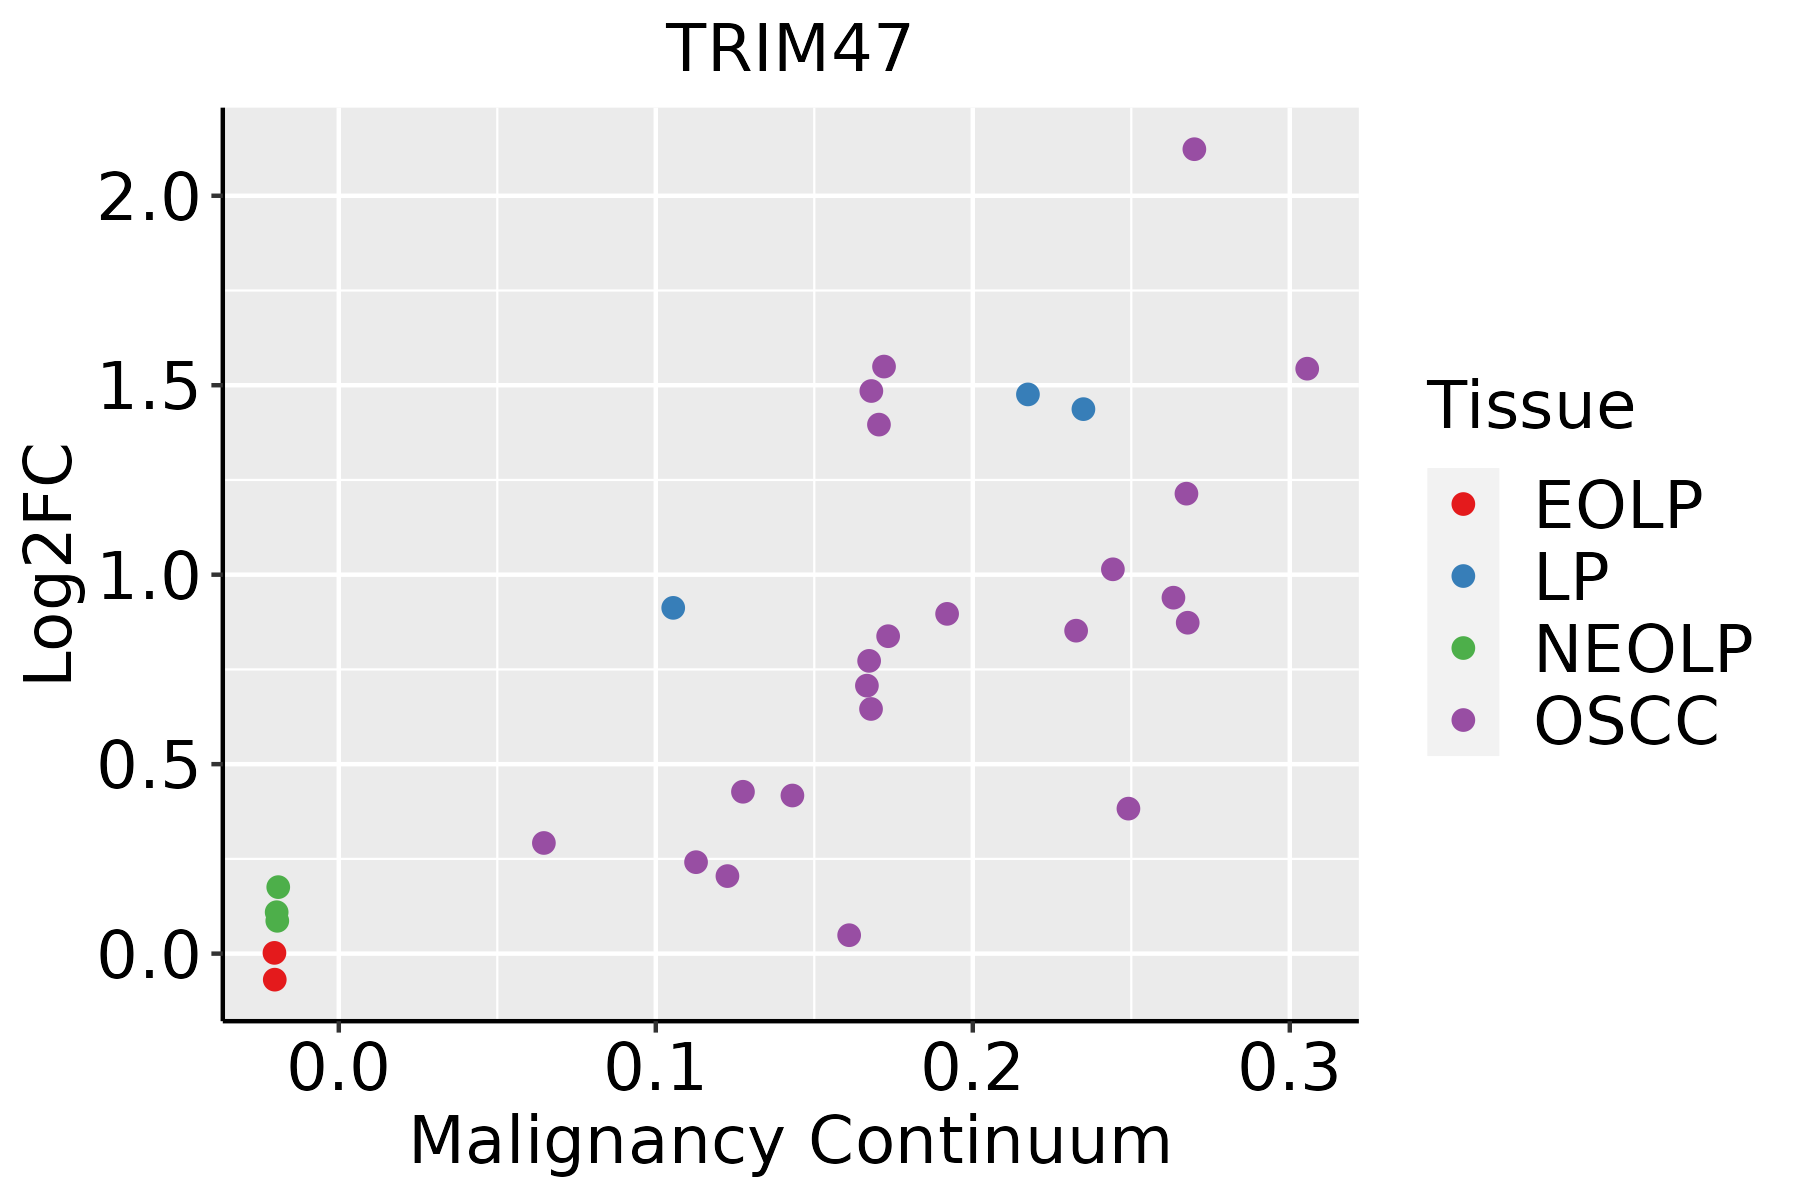 | EOLP: Erosive Oral lichen planus |
| LP: leukoplakia | ||
| NEOLP: Non-erosive oral lichen planus | ||
| OSCC: Oral squamous cell carcinoma | ||
| Skin | 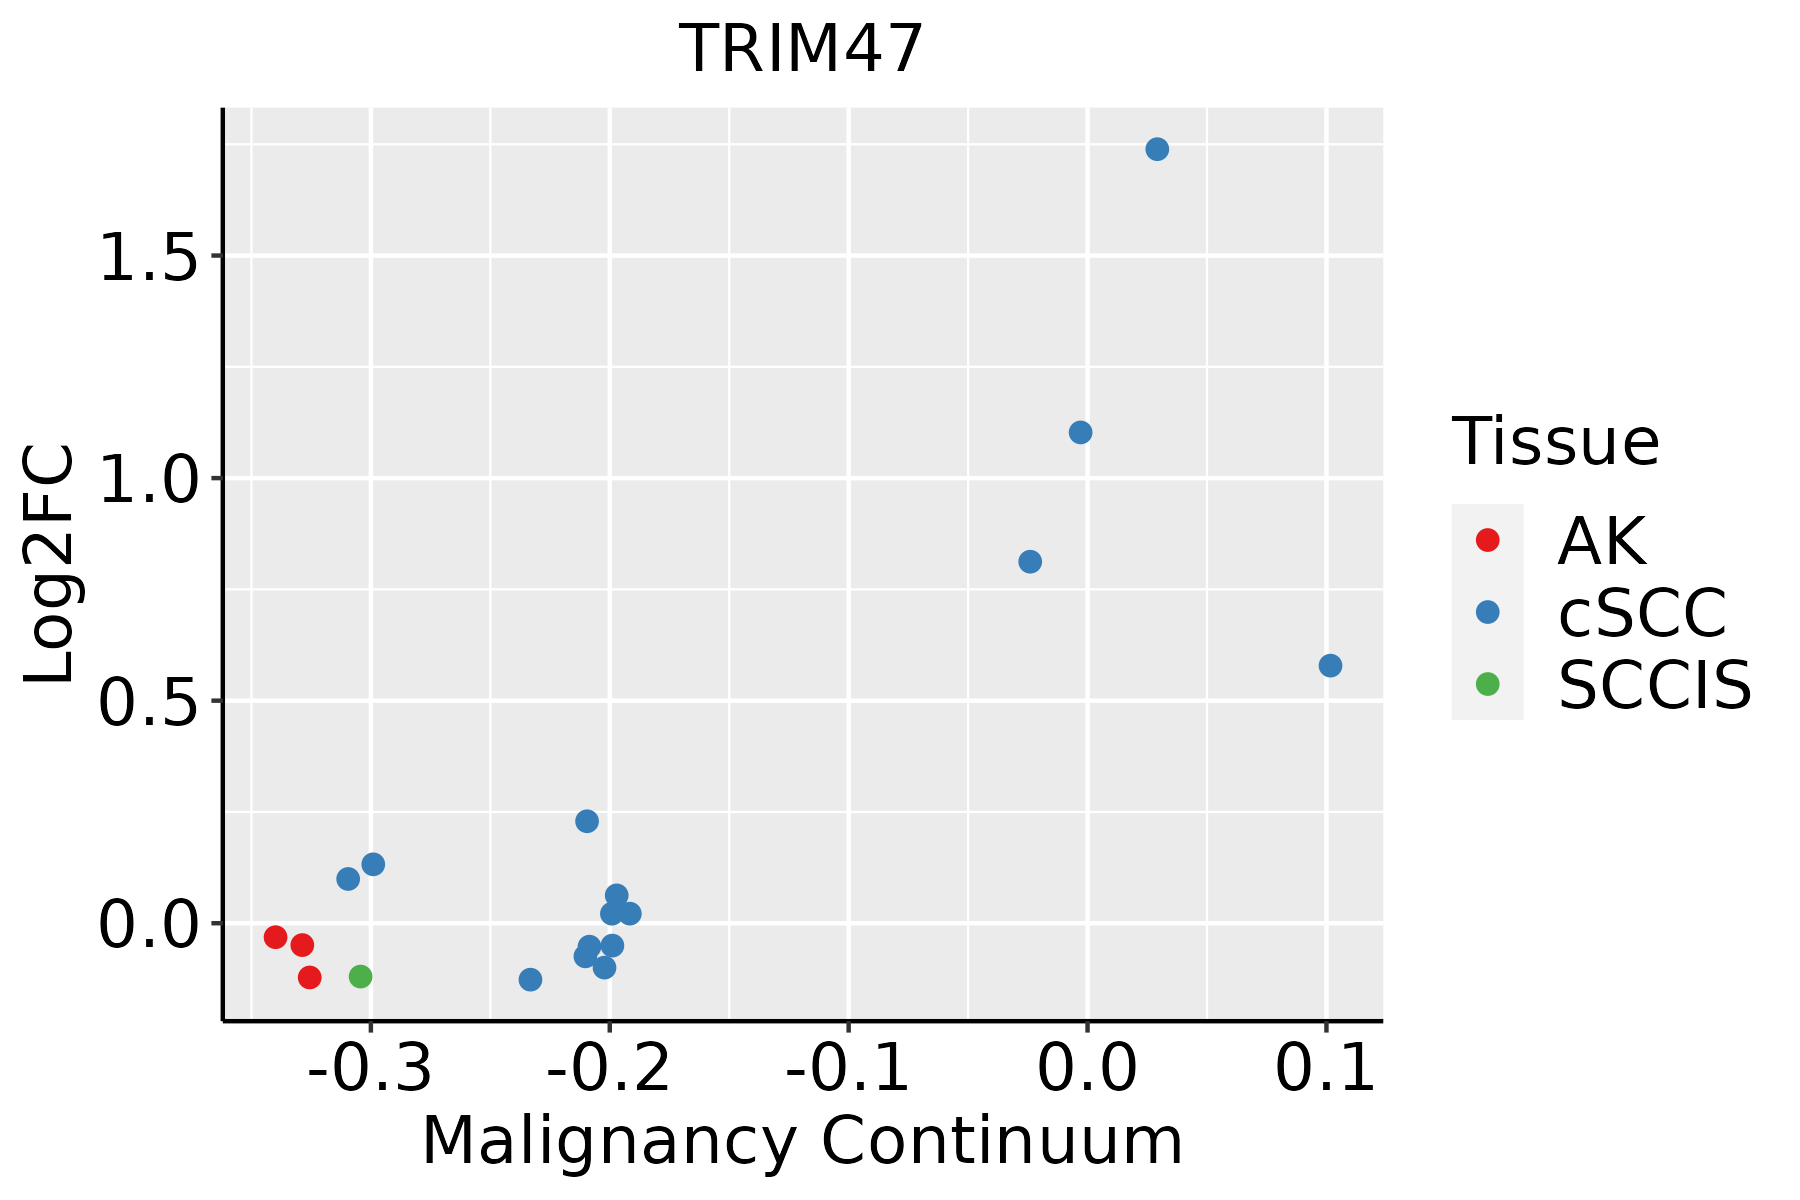 | AK: Actinic keratosis |
| cSCC: Cutaneous squamous cell carcinoma | ||
| SCCIS:squamous cell carcinoma in situ | ||
| Thyroid | 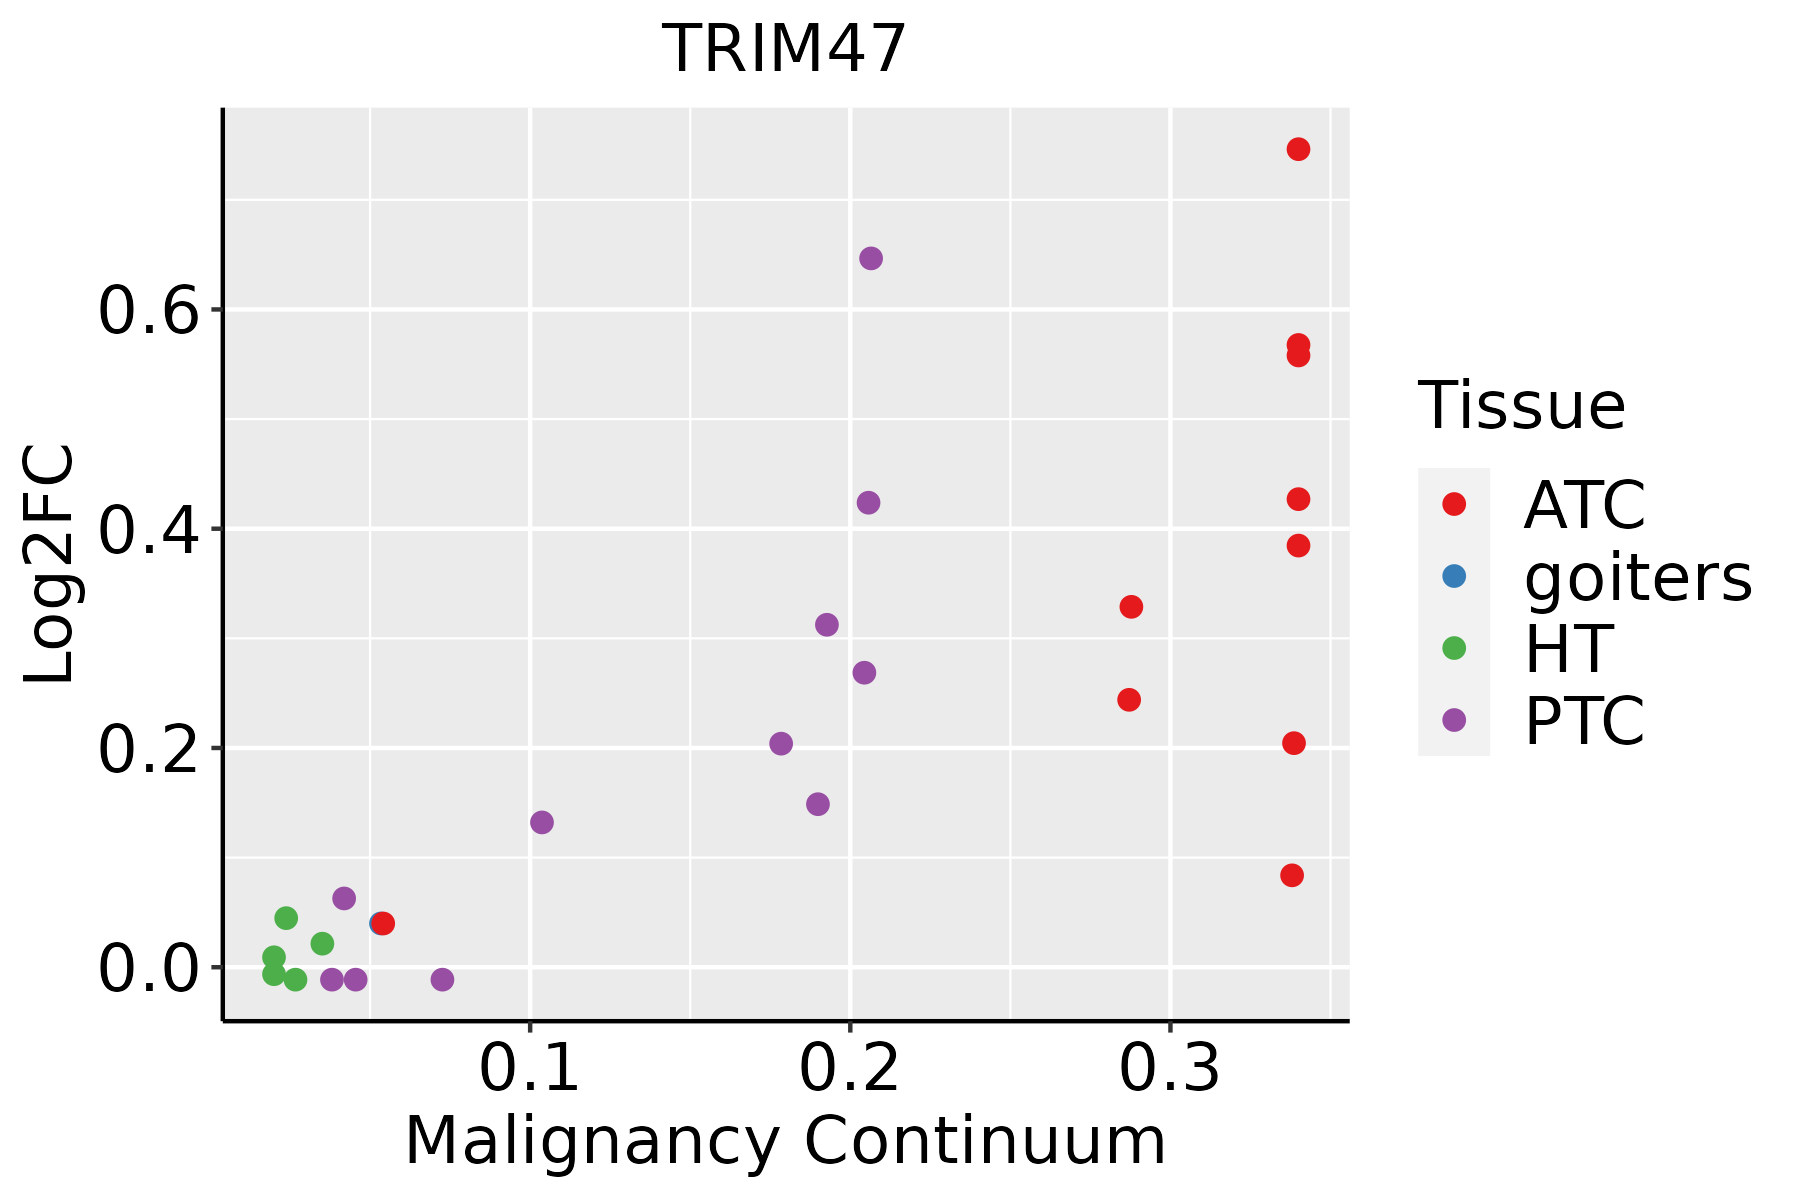 | ATC: Anaplastic thyroid cancer |
| HT: Hashimoto's thyroiditis | ||
| PTC: Papillary thyroid cancer |
| ∗log2FC in expression of this searched gene in stem-like cells from each diseased tissue sample relative to stem-like cells in normal samples in each tissue plotted against the malignancy continuum. Samples are colored based on if they are from different disease stage. |
Top |
Malignant transformation related pathway analysis |
| Find out the enriched GO biological processes and KEGG pathways involved in transition from healthy to precancer to cancer |
| Tissue | Disease Stage | Enriched GO biological Processes |
| Colorectum | AD |  |
| Colorectum | SER |  |
| Colorectum | MSS |  |
| Colorectum | MSI-H |  |
| Colorectum | FAP |  |
| ∗Top 15 enriched GO BP terms are showed in the bar plot of each disease state in each tissue. Each row represents a significant GO biological process which is colored according to the -log10(p.adjust). |
| Page: 1 2 3 4 5 6 7 8 9 |
| GO ID | Tissue | Disease Stage | Description | Gene Ratio | Bg Ratio | pvalue | p.adjust | Count |
| Page: 1 |
| Pathway ID | Tissue | Disease Stage | Description | Gene Ratio | Bg Ratio | pvalue | p.adjust | qvalue | Count |
| Page: 1 |
Top |
Cell-cell communication analysis |
| Identification of potential cell-cell interactions between two cell types and their ligand-receptor pairs for different disease states |
| Ligand | Receptor | LRpair | Pathway | Tissue | Disease Stage |
| Page: 1 |
Top |
Single-cell gene regulatory network inference analysis |
| Find out the significant the regulons (TFs) and the target genes of each regulon across cell types for different disease states |
| TF | Cell Type | Tissue | Disease Stage | Target Gene | RSS | Regulon Activity |
| ∗The dot plots of a searched regulon are shown for all cell subpopulations in each disease state of each tissue based on the regulon specific score inferred using pySCENIC and by calculating the average expression. |
| Page: 1 |
Top |
Somatic mutation of malignant transformation related genes |
| Annotation of somatic variants for genes involved in malignant transformation |
| Hugo Symbol | Variant Class | Variant Classification | dbSNP RS | HGVSc | HGVSp | HGVSp Short | SWISSPROT | BIOTYPE | SIFT | PolyPhen | Tumor Sample Barcode | Tissue | Histology | Sex | Age | Stage | Therapy Types | Drugs | Outcome |
| TRIM47 | SNV | Missense_Mutation | c.957G>C | p.Gln319His | p.Q319H | Q96LD4 | protein_coding | tolerated(0.53) | benign(0) | TCGA-D8-A27G-01 | Breast | breast invasive carcinoma | Female | >=65 | I/II | Unknown | Unknown | SD | |
| TRIM47 | SNV | Missense_Mutation | c.1225N>C | p.Glu409Gln | p.E409Q | Q96LD4 | protein_coding | tolerated(0.11) | benign(0.051) | TCGA-C5-A1M6-01 | Cervix | cervical & endocervical cancer | Female | <65 | I/II | Chemotherapy | cisplatin | PD | |
| TRIM47 | SNV | Missense_Mutation | novel | c.1688N>A | p.Ala563Asp | p.A563D | Q96LD4 | protein_coding | deleterious(0) | benign(0.31) | TCGA-C5-A2LT-01 | Cervix | cervical & endocervical cancer | Female | <65 | I/II | Chemotherapy | cisplatin | SD |
| TRIM47 | SNV | Missense_Mutation | c.1273N>G | p.Lys425Glu | p.K425E | Q96LD4 | protein_coding | deleterious(0.01) | benign(0.129) | TCGA-AA-3713-01 | Colorectum | colon adenocarcinoma | Male | >=65 | III/IV | Chemotherapy | 5-fluorouracil | PR | |
| TRIM47 | SNV | Missense_Mutation | rs763705777 | c.1669N>T | p.Arg557Cys | p.R557C | Q96LD4 | protein_coding | deleterious(0.01) | possibly_damaging(0.659) | TCGA-AD-5900-01 | Colorectum | colon adenocarcinoma | Male | >=65 | I/II | Unknown | Unknown | SD |
| TRIM47 | SNV | Missense_Mutation | rs369775248 | c.1858N>A | p.Ala620Thr | p.A620T | Q96LD4 | protein_coding | deleterious_low_confidence(0) | probably_damaging(0.996) | TCGA-AZ-6601-01 | Colorectum | colon adenocarcinoma | Male | >=65 | I/II | Unknown | Unknown | PD |
| TRIM47 | SNV | Missense_Mutation | c.1823G>A | p.Arg608Lys | p.R608K | Q96LD4 | protein_coding | tolerated_low_confidence(0.65) | benign(0) | TCGA-CK-4951-01 | Colorectum | colon adenocarcinoma | Female | >=65 | I/II | Unknown | Unknown | PD | |
| TRIM47 | SNV | Missense_Mutation | c.1648N>C | p.Val550Leu | p.V550L | Q96LD4 | protein_coding | deleterious(0.01) | benign(0.018) | TCGA-QG-A5Z2-01 | Colorectum | colon adenocarcinoma | Male | <65 | I/II | Unknown | Unknown | SD | |
| TRIM47 | SNV | Missense_Mutation | novel | c.1132N>A | p.Val378Ile | p.V378I | Q96LD4 | protein_coding | tolerated(0.25) | benign(0) | TCGA-A5-A0G2-01 | Endometrium | uterine corpus endometrioid carcinoma | Female | <65 | III/IV | Unknown | Unknown | SD |
| TRIM47 | SNV | Missense_Mutation | novel | c.1174G>T | p.Asp392Tyr | p.D392Y | Q96LD4 | protein_coding | tolerated(0.22) | benign(0.033) | TCGA-B5-A1MX-01 | Endometrium | uterine corpus endometrioid carcinoma | Female | <65 | I/II | Hormone Therapy | megace | SD |
| Page: 1 2 3 |
Top |
Related drugs of malignant transformation related genes |
| Identification of chemicals and drugs interact with genes involved in malignant transfromation |
| (DGIdb 4.0) |
| Entrez ID | Symbol | Category | Interaction Types | Drug Claim Name | Drug Name | PMIDs |
| Page: 1 |

Copyright 2023-Present -The University of Texas Health Science Center at Houston |