Schematic overview of the cellular and molecular mechanisms involved in the cancer progression, including the proposed cellular and molecular mechanisms in cancer cells trajectory. AT1: alveolar type 1 cells; AT2: alveolar type 2 cells; AAH: atypical adenomatous hyperplasia; AIS: adenocarcinoma in situ; MIA: minimally invasive adenocarcinoma; IA: invasive adenocarcinoma; EMT: epithelial-mesenchymal transition

Home

Download

Statistics

Help

Contact

Center for Computational Systems Medicine
leaf

Gene summary

leaf

Malignant transformation analysis

leaf

Malignant transformation related pathway analysis

leaf

Cell-cell communication analysis

leaf

Single-cell gene regulatory network inference analysis

leaf

Somatic mutation of malignant transformation related genes

leaf

Related drugs of malignant transformation related genes

Gene: TRIM38

Gene summary for TRIM38

check button Gene summary.

Gene informationSpeciesHuman
Gene symbol

TRIM38

Gene ID

10475

Gene nametripartite motif containing 38
Gene AliasRNF15
Cytomap6p22.2
Gene Typeprotein-coding
GO ID

GO:0000209

UniProtAcc

A0A024QZY4


Top

Malignant transformation analysis

check button Identification of the aberrant gene expression in precancerous and cancerous lesions by comparing the gene expression of stem-like cells in diseased tissues with normal stem cells
check button Malignant transformation involving gene list.
Entrez IDSymbolReplicatesSpeciesOrganTissueAdj P-valueLog2FCMalignancy
10475TRIM38LZE4THumanEsophagusESCC2.08e-031.06e-010.0811
10475TRIM38LZE5THumanEsophagusESCC5.11e-052.11e-010.0514
10475TRIM38LZE7THumanEsophagusESCC8.58e-052.54e-010.0667
10475TRIM38LZE8THumanEsophagusESCC5.86e-081.68e-010.067
10475TRIM38LZE20THumanEsophagusESCC3.00e-021.54e-010.0662
10475TRIM38LZE21D1HumanEsophagusHGIN3.66e-033.59e-010.0632
10475TRIM38LZE24THumanEsophagusESCC7.86e-104.32e-010.0596
10475TRIM38LZE21THumanEsophagusESCC4.44e-053.93e-010.0655
10475TRIM38LZE6THumanEsophagusESCC1.20e-031.23e-010.0845
10475TRIM38P1T-EHumanEsophagusESCC1.06e-104.88e-010.0875
10475TRIM38P2T-EHumanEsophagusESCC1.64e-427.30e-010.1177
10475TRIM38P4T-EHumanEsophagusESCC1.45e-113.57e-010.1323
10475TRIM38P5T-EHumanEsophagusESCC8.06e-035.60e-020.1327
10475TRIM38P8T-EHumanEsophagusESCC6.55e-173.35e-010.0889
10475TRIM38P9T-EHumanEsophagusESCC1.43e-204.66e-010.1131
10475TRIM38P10T-EHumanEsophagusESCC6.17e-081.04e-010.116
10475TRIM38P11T-EHumanEsophagusESCC9.08e-093.81e-010.1426
10475TRIM38P12T-EHumanEsophagusESCC9.77e-122.23e-010.1122
10475TRIM38P15T-EHumanEsophagusESCC2.46e-092.14e-010.1149
10475TRIM38P16T-EHumanEsophagusESCC1.73e-078.98e-020.1153
Page: 1 2 3 4 5 6 

check button Transcriptomic changes along malignancy continuum.
TissueExpression DynamicsAbbreviation
EsophagusThe image shows the transcriptomic changes along malignancy continuum.log2FC in expression of this searched gene in stem-like cells from each diseased tissue sample relative to stem-like cells in normal samples in each tissue plotted against the malignancy continuum. Samples are colored based on if they are from different disease stage.
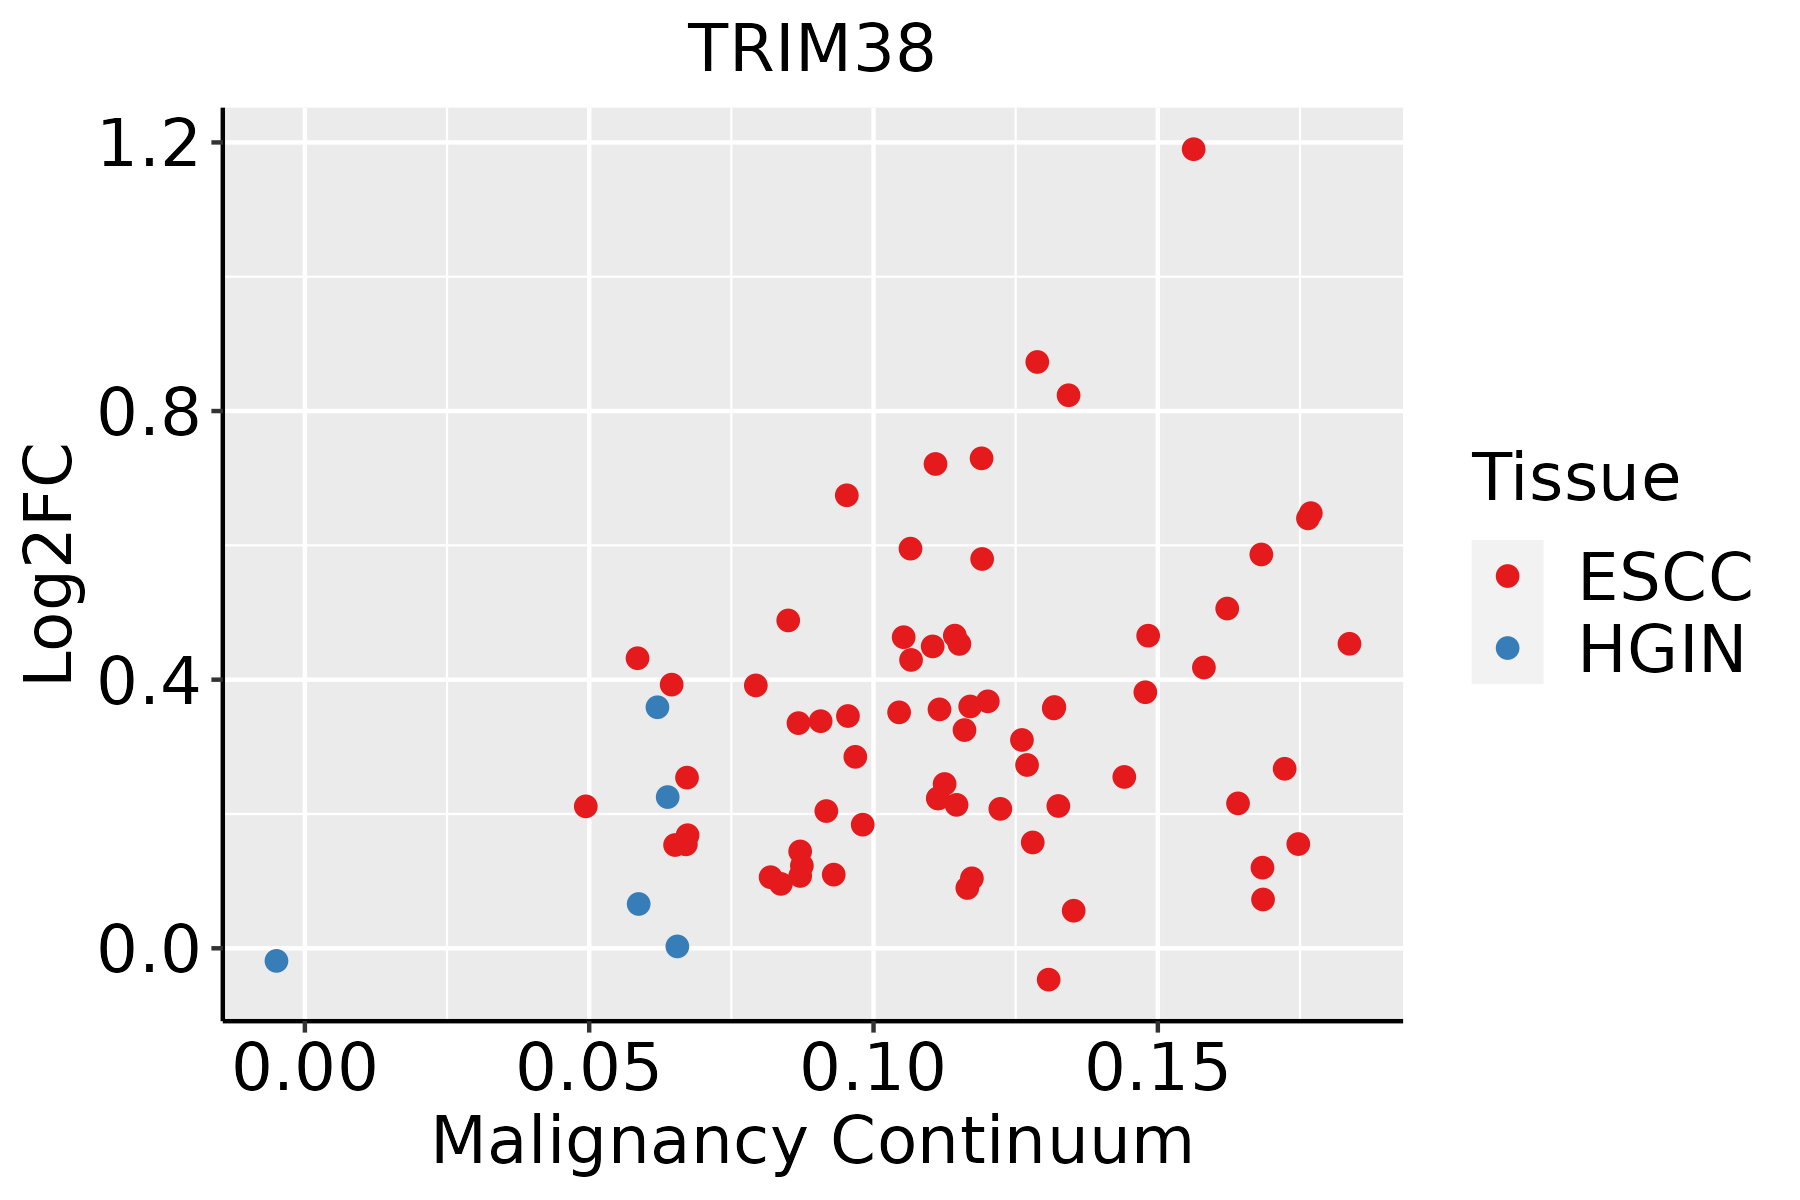
ESCC: Esophageal squamous cell carcinoma
HGIN: High-grade intraepithelial neoplasias
LGIN: Low-grade intraepithelial neoplasias
LiverThe image shows the transcriptomic changes along malignancy continuum.log2FC in expression of this searched gene in stem-like cells from each diseased tissue sample relative to stem-like cells in normal samples in each tissue plotted against the malignancy continuum. Samples are colored based on if they are from different disease stage.
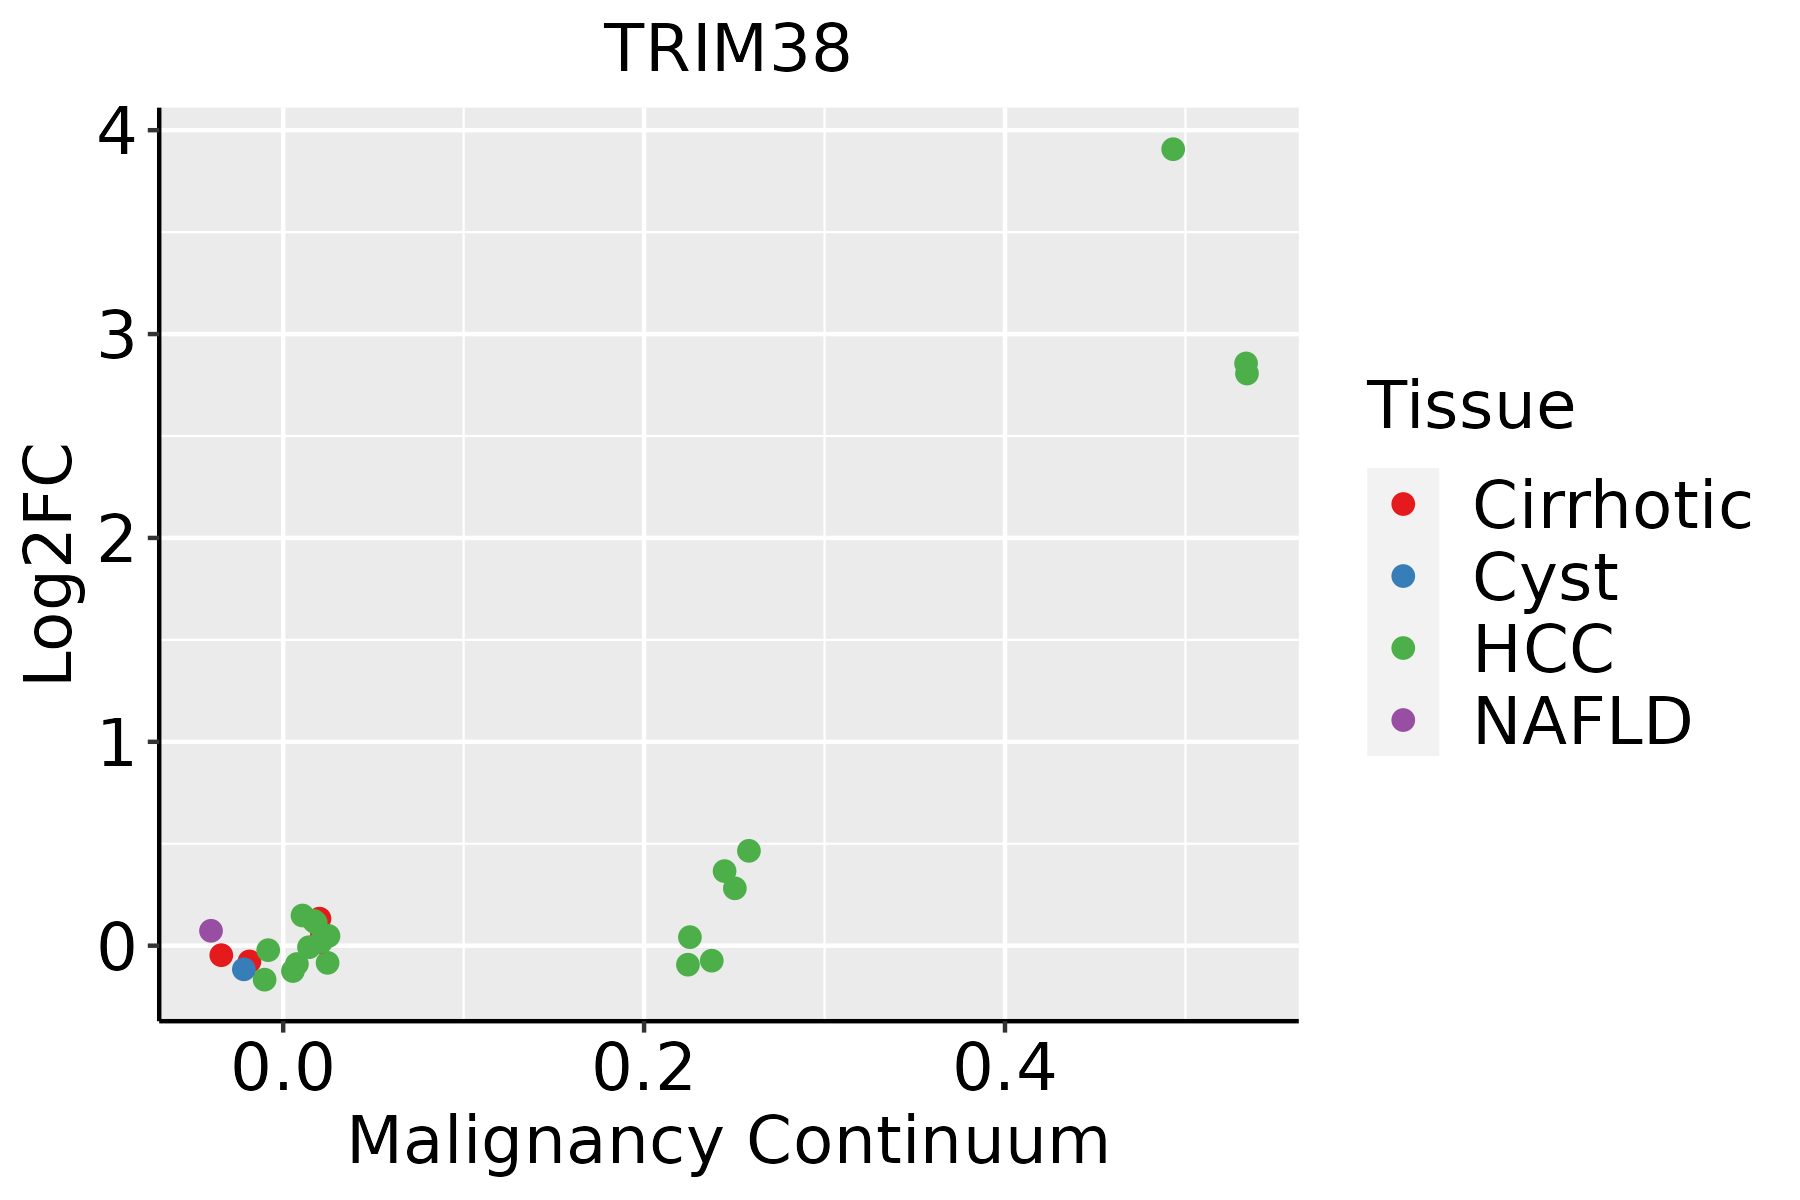
HCC: Hepatocellular carcinoma
NAFLD: Non-alcoholic fatty liver disease
LungThe image shows the transcriptomic changes along malignancy continuum.log2FC in expression of this searched gene in stem-like cells from each diseased tissue sample relative to stem-like cells in normal samples in each tissue plotted against the malignancy continuum. Samples are colored based on if they are from different disease stage.AAH: Atypical adenomatous hyperplasia
AIS: Adenocarcinoma in situ
IAC: Invasive lung adenocarcinoma
MIA: Minimally invasive adenocarcinoma
Oral CavityThe image shows the transcriptomic changes along malignancy continuum.log2FC in expression of this searched gene in stem-like cells from each diseased tissue sample relative to stem-like cells in normal samples in each tissue plotted against the malignancy continuum. Samples are colored based on if they are from different disease stage.
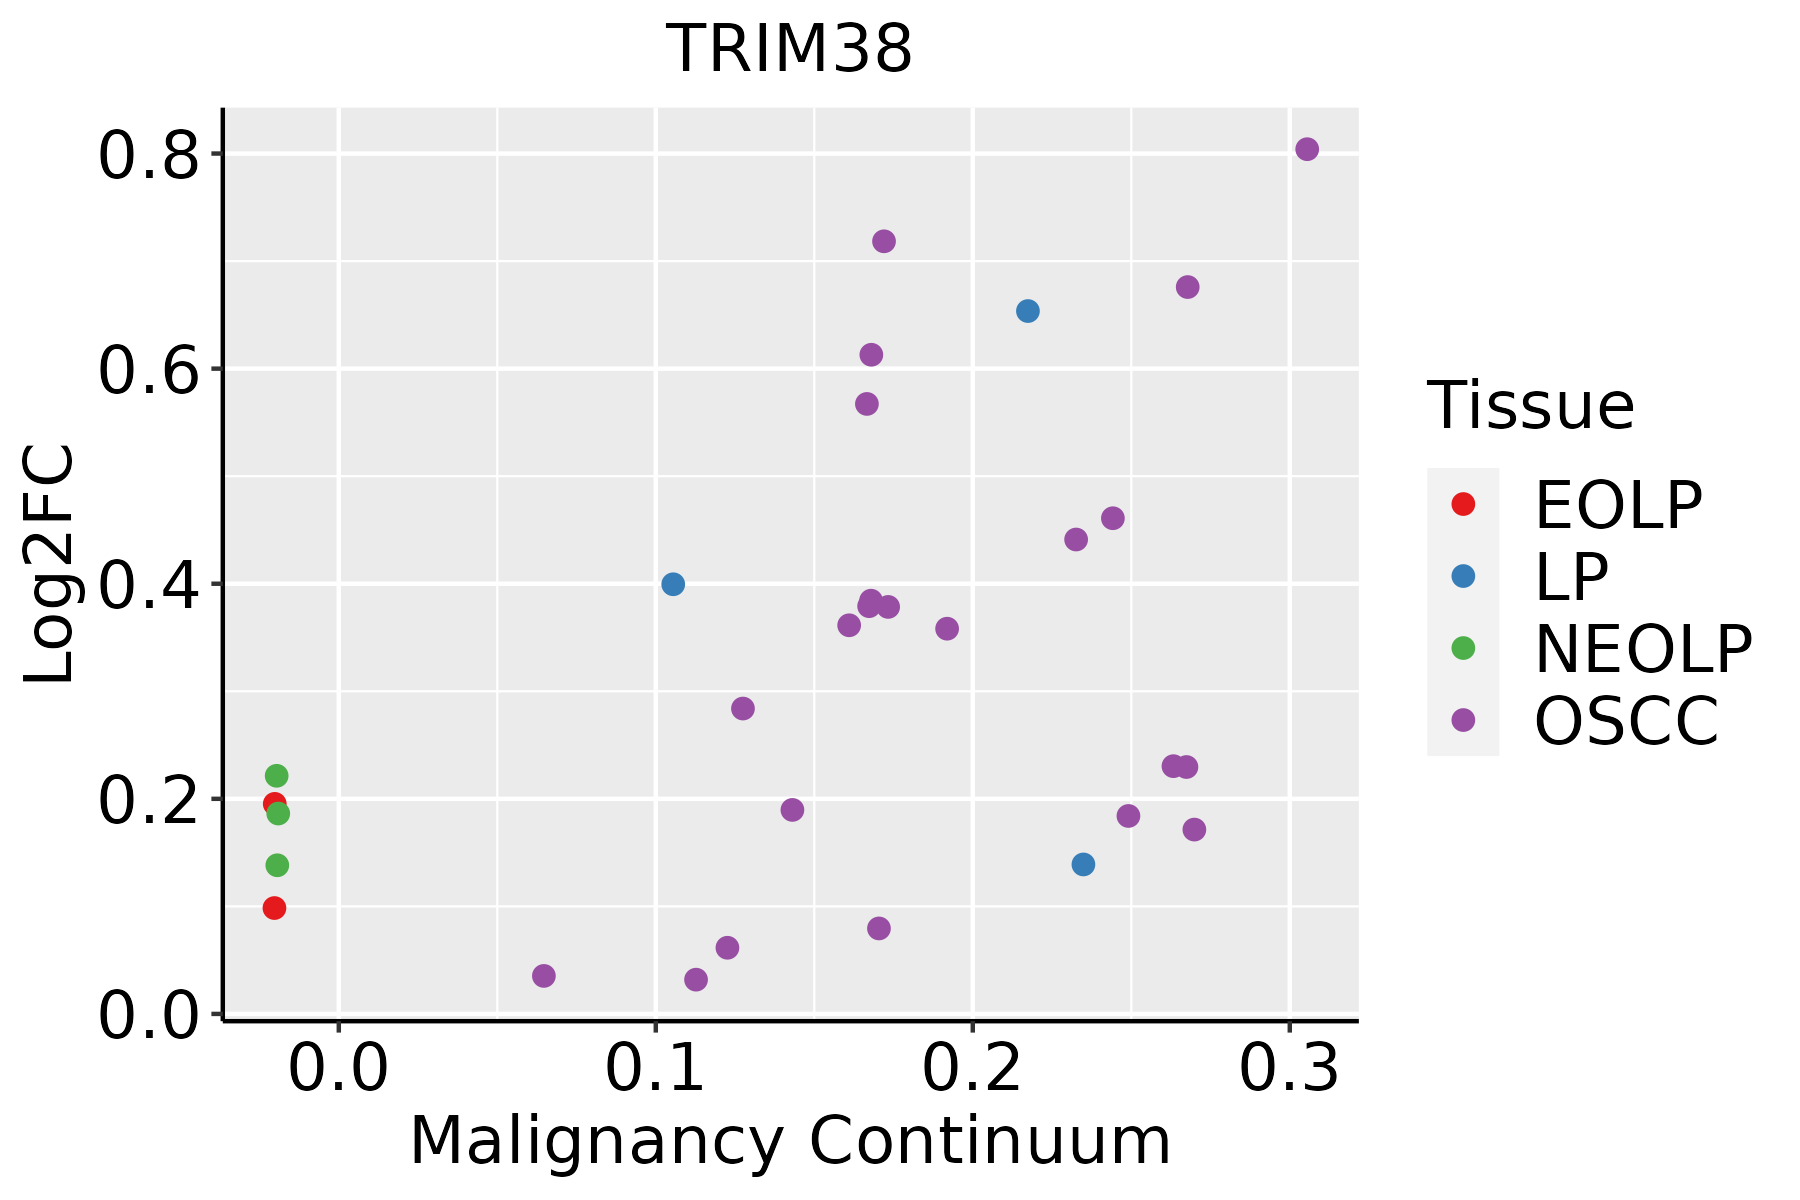
EOLP: Erosive Oral lichen planus
LP: leukoplakia
NEOLP: Non-erosive oral lichen planus
OSCC: Oral squamous cell carcinoma
SkinThe image shows the transcriptomic changes along malignancy continuum.log2FC in expression of this searched gene in stem-like cells from each diseased tissue sample relative to stem-like cells in normal samples in each tissue plotted against the malignancy continuum. Samples are colored based on if they are from different disease stage.
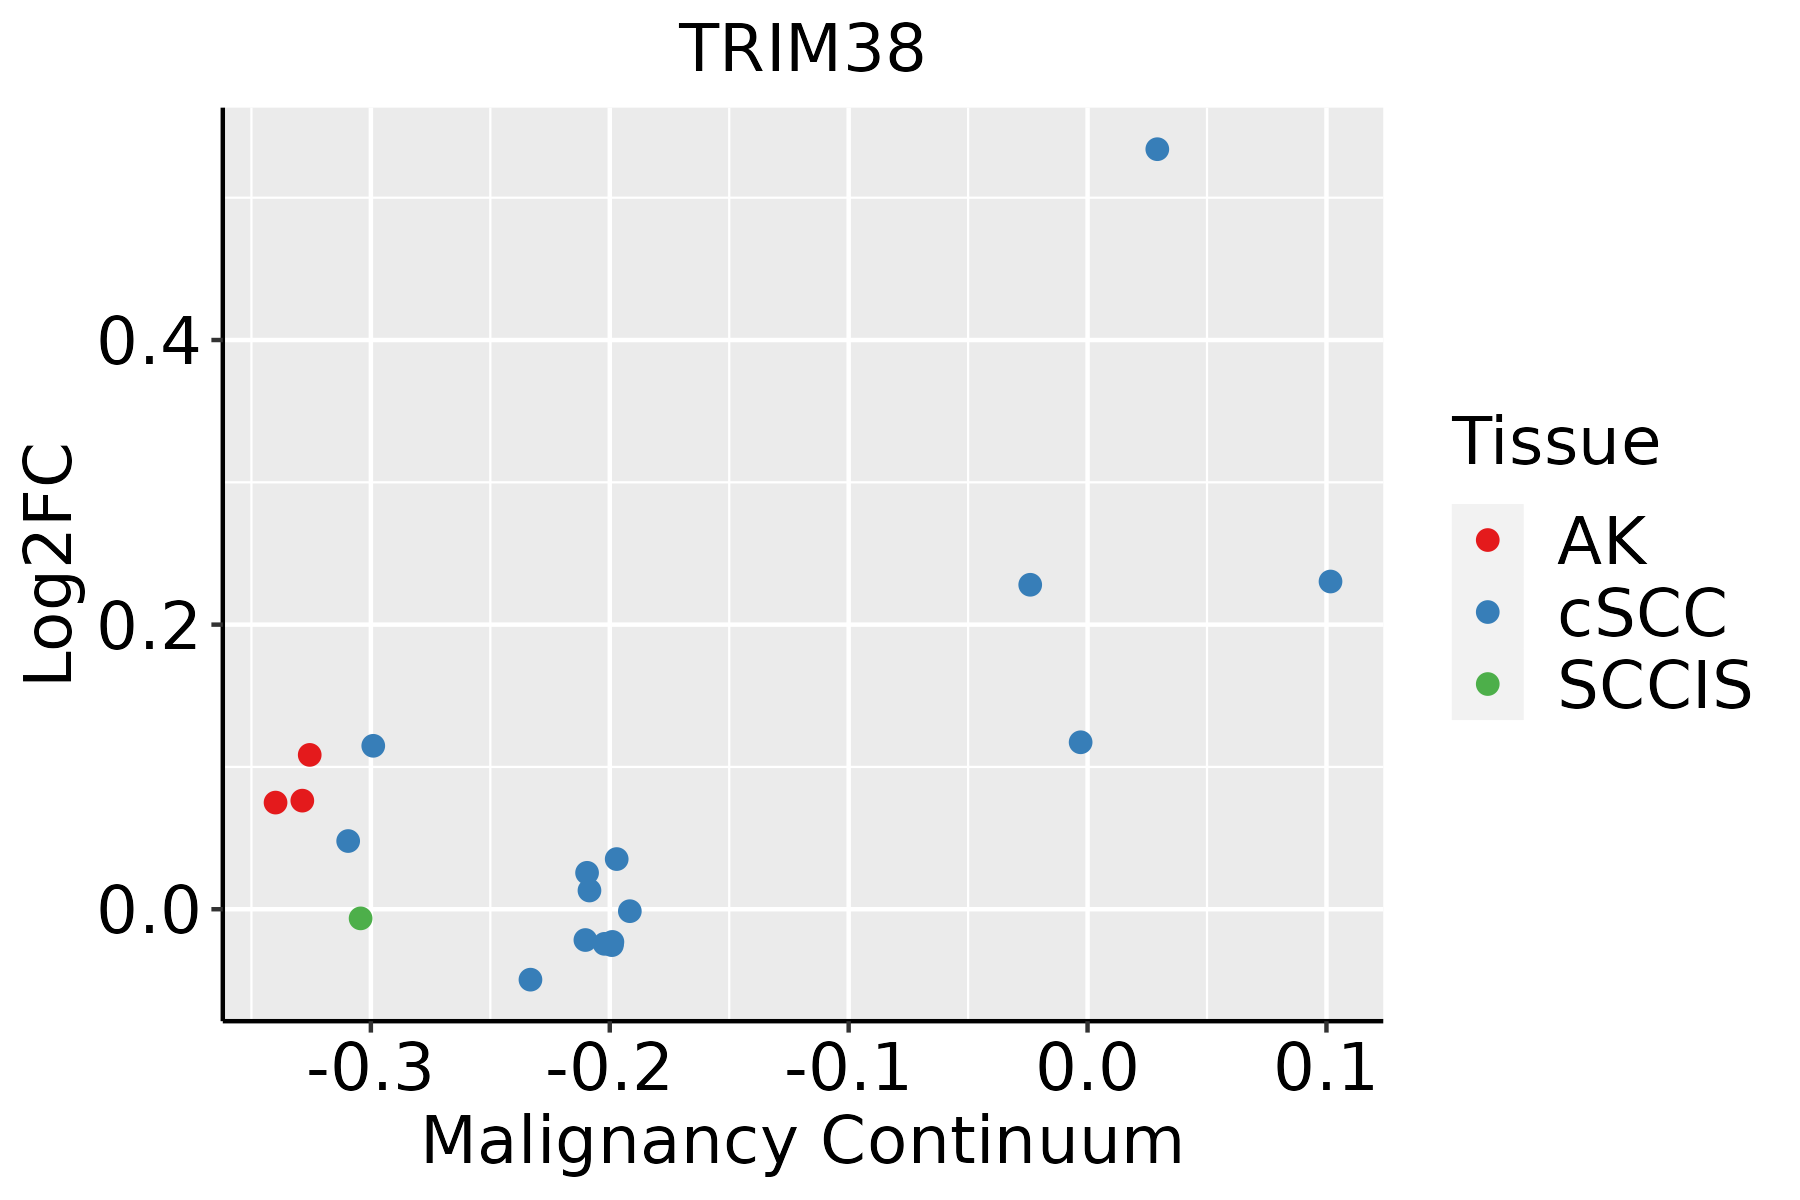
AK: Actinic keratosis
cSCC: Cutaneous squamous cell carcinoma
SCCIS:squamous cell carcinoma in situ
ThyroidThe image shows the transcriptomic changes along malignancy continuum.log2FC in expression of this searched gene in stem-like cells from each diseased tissue sample relative to stem-like cells in normal samples in each tissue plotted against the malignancy continuum. Samples are colored based on if they are from different disease stage.ATC: Anaplastic thyroid cancer
HT: Hashimoto's thyroiditis
PTC: Papillary thyroid cancer
∗log2FC in expression of this searched gene in stem-like cells from each diseased tissue sample relative to stem-like cells in normal samples in each tissue plotted against the malignancy continuum. Samples are colored based on if they are from different disease stage.

Top

Malignant transformation related pathway analysis

check buttonFind out the enriched GO biological processes and KEGG pathways involved in transition from healthy to precancer to cancer
check button Figure of enriched GO biological processes.
TissueDisease StageEnriched GO biological Processes
ColorectumADGO analysis - Figure of enriched GO biological processes: Top 15 enriched GO BP terms are showed in the bar plot of each disease state in each tissue. Each row represents a significant GO biological process which is colored according to the -log10(p.adjust).
ColorectumSERGO analysis - Figure of enriched GO biological processes: Top 15 enriched GO BP terms are showed in the bar plot of each disease state in each tissue. Each row represents a significant GO biological process which is colored according to the -log10(p.adjust).
ColorectumMSSGO analysis - Figure of enriched GO biological processes: Top 15 enriched GO BP terms are showed in the bar plot of each disease state in each tissue. Each row represents a significant GO biological process which is colored according to the -log10(p.adjust).
ColorectumMSI-HGO analysis - Figure of enriched GO biological processes: Top 15 enriched GO BP terms are showed in the bar plot of each disease state in each tissue. Each row represents a significant GO biological process which is colored according to the -log10(p.adjust).
ColorectumFAPGO analysis - Figure of enriched GO biological processes: Top 15 enriched GO BP terms are showed in the bar plot of each disease state in each tissue. Each row represents a significant GO biological process which is colored according to the -log10(p.adjust).
∗Top 15 enriched GO BP terms are showed in the bar plot of each disease state in each tissue. Each row represents a significant GO biological process which is colored according to the -log10(p.adjust).
Page: 1 2 3 4 5 6 7 8 9 

check button Enriched GO biological processes.
GO IDTissueDisease StageDescriptionGene RatioBg Ratiopvaluep.adjustCount
GO:001603227EsophagusHGINviral process118/2587415/187233.01e-156.22e-13118
GO:001905827EsophagusHGINviral life cycle93/2587317/187233.66e-135.63e-1193
GO:000989626EsophagusHGINpositive regulation of catabolic process126/2587492/187231.46e-122.09e-10126
GO:003133126EsophagusHGINpositive regulation of cellular catabolic process112/2587427/187235.15e-126.72e-10112
GO:001050616EsophagusHGINregulation of autophagy84/2587317/187231.39e-091.08e-0784
GO:005079225EsophagusHGINregulation of viral process50/2587164/187232.53e-081.49e-0650
GO:190390025EsophagusHGINregulation of viral life cycle45/2587148/187231.36e-076.78e-0645
GO:004852419EsophagusHGINpositive regulation of viral process25/258765/187236.88e-072.95e-0525
GO:004440326EsophagusHGINbiological process involved in symbiotic interaction71/2587290/187237.09e-073.00e-0571
GO:004312220EsophagusHGINregulation of I-kappaB kinase/NF-kappaB signaling63/2587249/187238.91e-073.61e-0563
GO:000724918EsophagusHGINI-kappaB kinase/NF-kappaB signaling67/2587281/187233.84e-061.29e-0467
GO:004312317EsophagusHGINpositive regulation of I-kappaB kinase/NF-kappaB signaling49/2587186/187234.22e-061.40e-0449
GO:000020916EsophagusHGINprotein polyubiquitination58/2587236/187236.29e-061.97e-0458
GO:005170127EsophagusHGINbiological process involved in interaction with host51/2587203/187231.16e-053.29e-0451
GO:005212627EsophagusHGINmovement in host environment43/2587175/187239.45e-052.03e-0343
GO:190390210EsophagusHGINpositive regulation of viral life cycle12/258729/187232.48e-044.38e-0312
GO:004390320EsophagusHGINregulation of biological process involved in symbiotic interaction20/258772/187231.39e-031.63e-0220
GO:004659815EsophagusHGINpositive regulation of viral entry into host cell6/258711/187231.71e-031.86e-026
GO:007529415EsophagusHGINpositive regulation by symbiont of entry into host6/258711/187231.71e-031.86e-026
GO:004440927EsophagusHGINentry into host34/2587151/187232.43e-032.43e-0234
Page: 1 2 3 4 5 6 7 8 9 10 11 12 13 14 

check button Enriched KEGG pathways.
Pathway IDTissueDisease StageDescriptionGene RatioBg Ratiopvaluep.adjustqvalueCount
Page: 1 

Top

Cell-cell communication analysis

check buttonIdentification of potential cell-cell interactions between two cell types and their ligand-receptor pairs for different disease states
LigandReceptorLRpairPathwayTissueDisease Stage
Page: 1 

Top

Single-cell gene regulatory network inference analysis

check buttonFind out the significant the regulons (TFs) and the target genes of each regulon across cell types for different disease states
TFCell TypeTissueDisease StageTarget GeneRSSRegulon Activity
∗The dot plots of a searched regulon are shown for all cell subpopulations in each disease state of each tissue based on the regulon specific score inferred using pySCENIC and by calculating the average expression.
Page: 1 

Top

Somatic mutation of malignant transformation related genes

check buttonAnnotation of somatic variants for genes involved in malignant transformation
Hugo SymbolVariant ClassVariant ClassificationdbSNP RSHGVScHGVSpHGVSp ShortSWISSPROTBIOTYPESIFTPolyPhenTumor Sample BarcodeTissueHistologySexAgeStageTherapy TypesDrugsOutcome
TRIM38SNVMissense_Mutationc.87N>Gp.Ile29Metp.I29MO00635protein_codingdeleterious(0)possibly_damaging(0.782)TCGA-A2-A0EQ-01Breastbreast invasive carcinomaFemale<65I/IIChemotherapyadriamycinSD
TRIM38SNVMissense_Mutationnovelc.844N>Ap.Asp282Asnp.D282NO00635protein_codingtolerated(0.12)benign(0.173)TCGA-AR-A250-01Breastbreast invasive carcinomaFemale<65I/IIChemotherapydoxorubicinSD
TRIM38SNVMissense_Mutationc.826G>Tp.Val276Phep.V276FO00635protein_codingdeleterious(0.02)probably_damaging(0.916)TCGA-BH-A0AZ-01Breastbreast invasive carcinomaFemale<65III/IVChemotherapydoxorubicinCR
TRIM38insertionNonsense_Mutationnovelc.1308_1309insACATGTTGTTAGAAGAGCTGAAGCAGGACTGGCTTGp.Thr436_Phe437insThrCysCysTerLysSerTerSerArgThrGlyLeup.T436_F437insTCC*KS*SRTGLO00635protein_codingTCGA-A8-A0A1-01Breastbreast invasive carcinomaFemale>=65I/IIHormone TherapytamoxiphenSD
TRIM38deletionIn_Frame_Delnovelc.1367_1369delNNNp.Pro457delp.P457delO00635protein_codingTCGA-BH-A0DQ-01Breastbreast invasive carcinomaFemale<65I/IIChemotherapydoxorubicinSD
TRIM38SNVMissense_Mutationrs368108856c.1072G>Ap.Gly358Argp.G358RO00635protein_codingtolerated(0.4)benign(0.35)TCGA-2W-A8YY-01Cervixcervical & endocervical cancerFemale<65I/IIChemotherapycisplatinCR
TRIM38SNVMissense_Mutationrs758236250c.145N>Gp.Gln49Glup.Q49EO00635protein_codingtolerated(0.35)benign(0.039)TCGA-DS-A1OC-01Cervixcervical & endocervical cancerFemale<65I/IIChemotherapygemcitabineSD
TRIM38insertionIn_Frame_Insnovelc.788_789insGGTp.Ser263_Glu264insValp.S263_E264insVO00635protein_codingTCGA-DS-A1OB-01Cervixcervical & endocervical cancerFemale<65I/IIChemotherapycarboplatinPD
TRIM38SNVMissense_Mutationnovelc.772N>Ap.Val258Metp.V258MO00635protein_codingtolerated(0.46)benign(0.03)TCGA-AA-3947-01Colorectumcolon adenocarcinomaFemale<65I/IIUnknownUnknownSD
TRIM38SNVMissense_Mutationc.726N>Tp.Gln242Hisp.Q242HO00635protein_codingdeleterious(0.04)possibly_damaging(0.808)TCGA-AA-A010-01Colorectumcolon adenocarcinomaFemale<65I/IIChemotherapyfolinicCR
Page: 1 2 3 4 5 6 

Top

Related drugs of malignant transformation related genes

check buttonIdentification of chemicals and drugs interact with genes involved in malignant transfromation
(DGIdb 4.0)
Entrez IDSymbolCategoryInteraction TypesDrug Claim NameDrug NamePMIDs
Page: 1