
|
|||||
|
 | |
| |
| |
| |
| |
| |
|
Gene: TRIM37 |
Gene summary for TRIM37 |
| Gene information | Species | Human | Gene symbol | TRIM37 | Gene ID | 4591 |
| Gene name | tripartite motif containing 37 | |
| Gene Alias | MUL | |
| Cytomap | 17q22 | |
| Gene Type | protein-coding | GO ID | GO:0000122 | UniProtAcc | O94972 |
Top |
Malignant transformation analysis |
| Identification of the aberrant gene expression in precancerous and cancerous lesions by comparing the gene expression of stem-like cells in diseased tissues with normal stem cells |
| Entrez ID | Symbol | Replicates | Species | Organ | Tissue | Adj P-value | Log2FC | Malignancy |
| 4591 | TRIM37 | LZE7T | Human | Esophagus | ESCC | 1.71e-02 | 3.57e-01 | 0.0667 |
| 4591 | TRIM37 | LZE24T | Human | Esophagus | ESCC | 5.00e-08 | 3.15e-01 | 0.0596 |
| 4591 | TRIM37 | LZE21T | Human | Esophagus | ESCC | 1.05e-02 | 2.42e-01 | 0.0655 |
| 4591 | TRIM37 | P2T-E | Human | Esophagus | ESCC | 5.42e-16 | 2.57e-01 | 0.1177 |
| 4591 | TRIM37 | P4T-E | Human | Esophagus | ESCC | 3.71e-07 | 1.90e-01 | 0.1323 |
| 4591 | TRIM37 | P5T-E | Human | Esophagus | ESCC | 1.12e-06 | 9.17e-02 | 0.1327 |
| 4591 | TRIM37 | P8T-E | Human | Esophagus | ESCC | 4.74e-06 | 1.10e-01 | 0.0889 |
| 4591 | TRIM37 | P9T-E | Human | Esophagus | ESCC | 5.00e-10 | 2.08e-01 | 0.1131 |
| 4591 | TRIM37 | P10T-E | Human | Esophagus | ESCC | 2.16e-11 | 1.62e-01 | 0.116 |
| 4591 | TRIM37 | P11T-E | Human | Esophagus | ESCC | 1.03e-08 | 2.78e-01 | 0.1426 |
| 4591 | TRIM37 | P12T-E | Human | Esophagus | ESCC | 3.81e-14 | 2.77e-01 | 0.1122 |
| 4591 | TRIM37 | P15T-E | Human | Esophagus | ESCC | 2.33e-07 | 2.42e-01 | 0.1149 |
| 4591 | TRIM37 | P16T-E | Human | Esophagus | ESCC | 5.01e-11 | 1.82e-01 | 0.1153 |
| 4591 | TRIM37 | P19T-E | Human | Esophagus | ESCC | 3.02e-05 | 3.18e-01 | 0.1662 |
| 4591 | TRIM37 | P20T-E | Human | Esophagus | ESCC | 5.01e-09 | 1.20e-01 | 0.1124 |
| 4591 | TRIM37 | P21T-E | Human | Esophagus | ESCC | 1.70e-23 | 3.68e-01 | 0.1617 |
| 4591 | TRIM37 | P22T-E | Human | Esophagus | ESCC | 1.57e-15 | 1.84e-01 | 0.1236 |
| 4591 | TRIM37 | P23T-E | Human | Esophagus | ESCC | 5.04e-14 | 4.68e-01 | 0.108 |
| 4591 | TRIM37 | P24T-E | Human | Esophagus | ESCC | 4.18e-11 | 1.78e-01 | 0.1287 |
| 4591 | TRIM37 | P26T-E | Human | Esophagus | ESCC | 4.91e-17 | 2.84e-01 | 0.1276 |
| Page: 1 2 3 |
| Tissue | Expression Dynamics | Abbreviation |
| Esophagus |  | ESCC: Esophageal squamous cell carcinoma |
| HGIN: High-grade intraepithelial neoplasias | ||
| LGIN: Low-grade intraepithelial neoplasias | ||
| Liver | 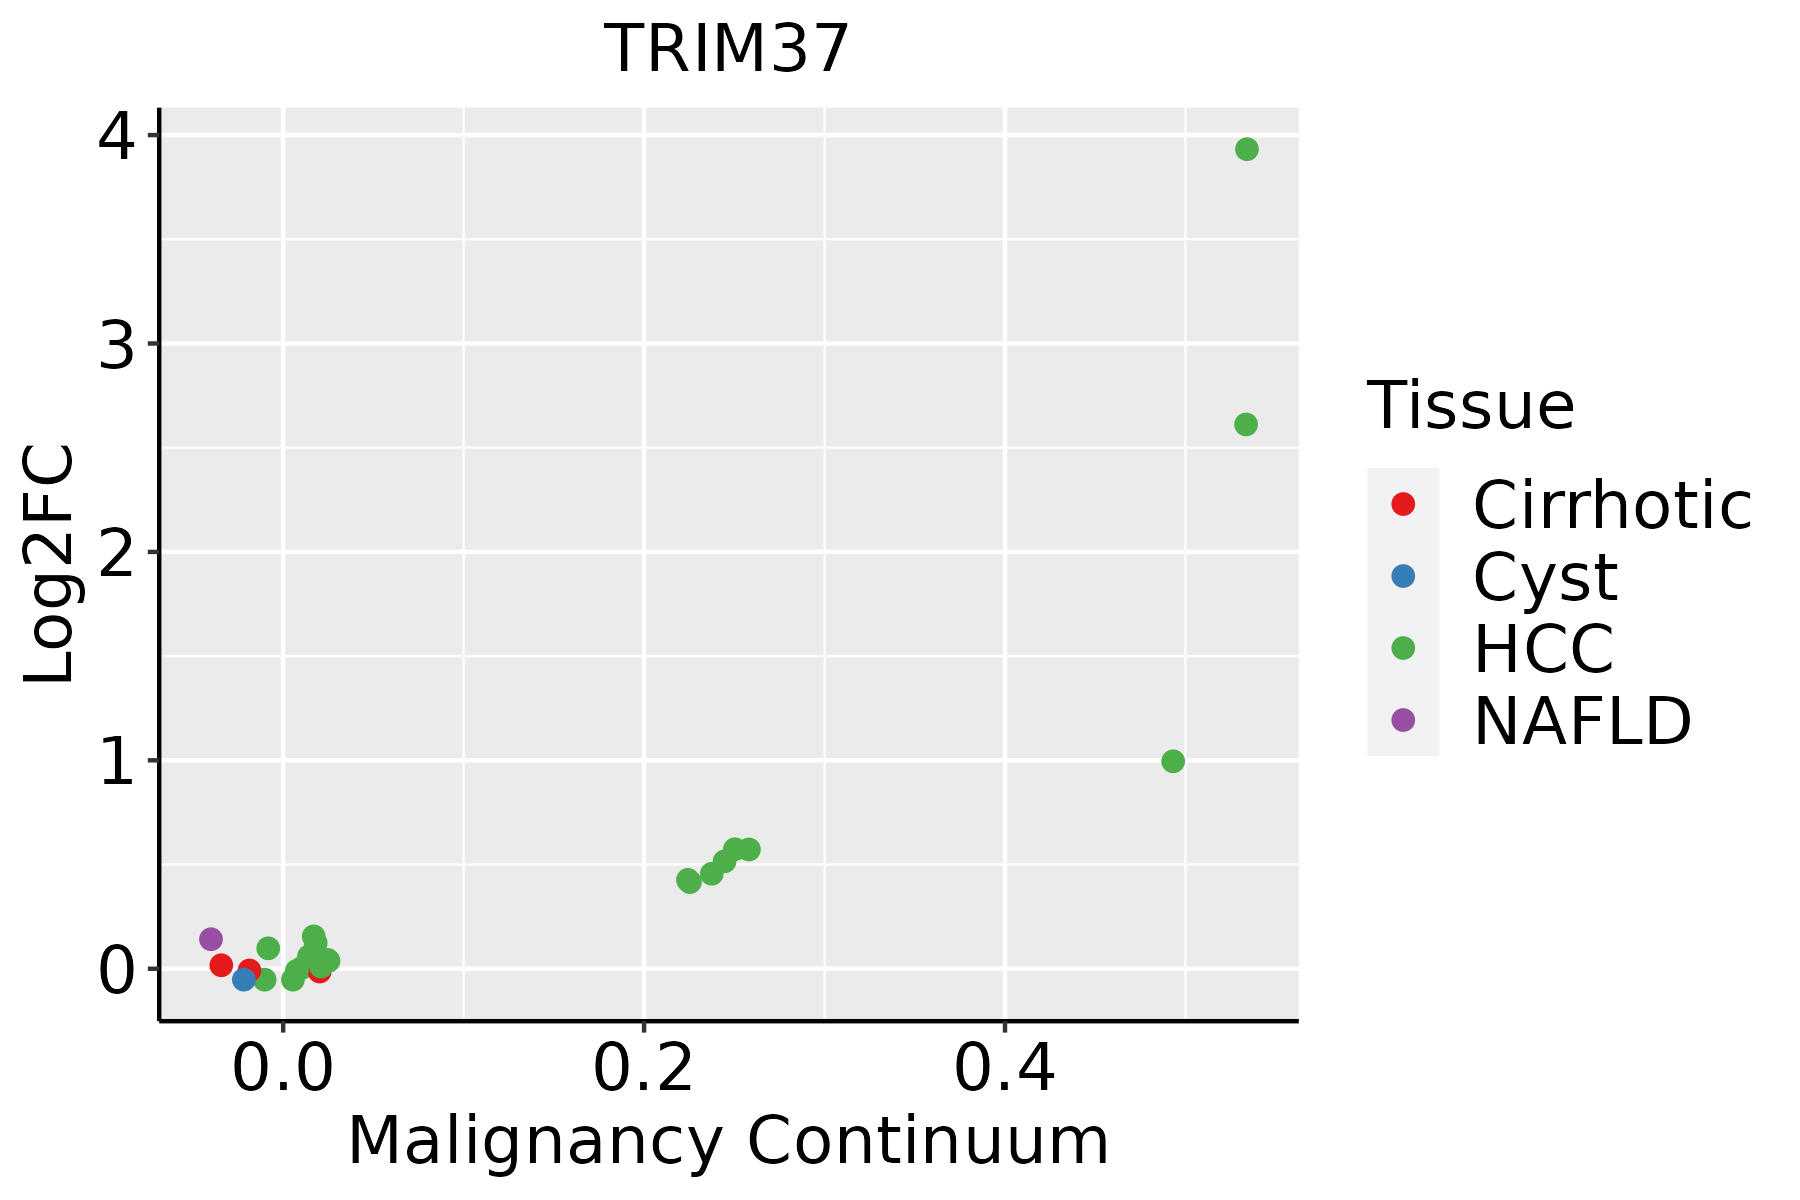 | HCC: Hepatocellular carcinoma |
| NAFLD: Non-alcoholic fatty liver disease |
| ∗log2FC in expression of this searched gene in stem-like cells from each diseased tissue sample relative to stem-like cells in normal samples in each tissue plotted against the malignancy continuum. Samples are colored based on if they are from different disease stage. |
Top |
Malignant transformation related pathway analysis |
| Find out the enriched GO biological processes and KEGG pathways involved in transition from healthy to precancer to cancer |
| Tissue | Disease Stage | Enriched GO biological Processes |
| Colorectum | AD |  |
| Colorectum | SER |  |
| Colorectum | MSS |  |
| Colorectum | MSI-H |  |
| Colorectum | FAP |  |
| ∗Top 15 enriched GO BP terms are showed in the bar plot of each disease state in each tissue. Each row represents a significant GO biological process which is colored according to the -log10(p.adjust). |
| Page: 1 2 3 4 5 6 7 8 9 |
| GO ID | Tissue | Disease Stage | Description | Gene Ratio | Bg Ratio | pvalue | p.adjust | Count |
| GO:001657015 | Esophagus | ESCC | histone modification | 323/8552 | 463/18723 | 2.61e-26 | 7.88e-24 | 323 |
| GO:00457865 | Esophagus | ESCC | negative regulation of cell cycle | 236/8552 | 385/18723 | 3.62e-10 | 9.93e-09 | 236 |
| GO:0010639110 | Esophagus | ESCC | negative regulation of organelle organization | 215/8552 | 348/18723 | 8.20e-10 | 2.01e-08 | 215 |
| GO:00065136 | Esophagus | ESCC | protein monoubiquitination | 53/8552 | 67/18723 | 2.11e-08 | 4.03e-07 | 53 |
| GO:001657414 | Esophagus | ESCC | histone ubiquitination | 40/8552 | 47/18723 | 2.40e-08 | 4.55e-07 | 40 |
| GO:00109484 | Esophagus | ESCC | negative regulation of cell cycle process | 177/8552 | 294/18723 | 3.26e-07 | 4.59e-06 | 177 |
| GO:00510908 | Esophagus | ESCC | regulation of DNA-binding transcription factor activity | 252/8552 | 440/18723 | 5.22e-07 | 6.97e-06 | 252 |
| GO:190211514 | Esophagus | ESCC | regulation of organelle assembly | 116/8552 | 186/18723 | 3.15e-06 | 3.53e-05 | 116 |
| GO:00510918 | Esophagus | ESCC | positive regulation of DNA-binding transcription factor activity | 155/8552 | 260/18723 | 3.83e-06 | 4.14e-05 | 155 |
| GO:00070982 | Esophagus | ESCC | centrosome cycle | 85/8552 | 130/18723 | 4.41e-06 | 4.69e-05 | 85 |
| GO:00310233 | Esophagus | ESCC | microtubule organizing center organization | 92/8552 | 143/18723 | 5.04e-06 | 5.31e-05 | 92 |
| GO:003352213 | Esophagus | ESCC | histone H2A ubiquitination | 23/8552 | 26/18723 | 6.82e-06 | 6.90e-05 | 23 |
| GO:00103904 | Esophagus | ESCC | histone monoubiquitination | 25/8552 | 29/18723 | 7.24e-06 | 7.20e-05 | 25 |
| GO:00510926 | Esophagus | ESCC | positive regulation of NF-kappaB transcription factor activity | 91/8552 | 152/18723 | 2.91e-04 | 1.75e-03 | 91 |
| GO:00355182 | Esophagus | ESCC | histone H2A monoubiquitination | 15/8552 | 17/18723 | 3.48e-04 | 2.03e-03 | 15 |
| GO:00328864 | Esophagus | ESCC | regulation of microtubule-based process | 134/8552 | 240/18723 | 9.44e-04 | 4.80e-03 | 134 |
| GO:00518658 | Esophagus | ESCC | protein autoubiquitination | 47/8552 | 73/18723 | 9.72e-04 | 4.93e-03 | 47 |
| GO:190211611 | Esophagus | ESCC | negative regulation of organelle assembly | 28/8552 | 41/18723 | 2.88e-03 | 1.21e-02 | 28 |
| GO:007084119 | Esophagus | ESCC | inclusion body assembly | 18/8552 | 24/18723 | 3.43e-03 | 1.41e-02 | 18 |
| GO:00434332 | Esophagus | ESCC | negative regulation of DNA-binding transcription factor activity | 103/8552 | 185/18723 | 3.86e-03 | 1.57e-02 | 103 |
| Page: 1 2 3 |
| Pathway ID | Tissue | Disease Stage | Description | Gene Ratio | Bg Ratio | pvalue | p.adjust | qvalue | Count |
| hsa0412027 | Esophagus | ESCC | Ubiquitin mediated proteolysis | 122/4205 | 142/8465 | 6.53e-20 | 7.29e-18 | 3.74e-18 | 122 |
| hsa0412036 | Esophagus | ESCC | Ubiquitin mediated proteolysis | 122/4205 | 142/8465 | 6.53e-20 | 7.29e-18 | 3.74e-18 | 122 |
| hsa0412041 | Liver | HCC | Ubiquitin mediated proteolysis | 110/4020 | 142/8465 | 1.67e-13 | 3.74e-12 | 2.08e-12 | 110 |
| hsa0412051 | Liver | HCC | Ubiquitin mediated proteolysis | 110/4020 | 142/8465 | 1.67e-13 | 3.74e-12 | 2.08e-12 | 110 |
| Page: 1 |
Top |
Cell-cell communication analysis |
| Identification of potential cell-cell interactions between two cell types and their ligand-receptor pairs for different disease states |
| Ligand | Receptor | LRpair | Pathway | Tissue | Disease Stage |
| Page: 1 |
Top |
Single-cell gene regulatory network inference analysis |
| Find out the significant the regulons (TFs) and the target genes of each regulon across cell types for different disease states |
| TF | Cell Type | Tissue | Disease Stage | Target Gene | RSS | Regulon Activity |
| ∗The dot plots of a searched regulon are shown for all cell subpopulations in each disease state of each tissue based on the regulon specific score inferred using pySCENIC and by calculating the average expression. |
| Page: 1 |
Top |
Somatic mutation of malignant transformation related genes |
| Annotation of somatic variants for genes involved in malignant transformation |
| Hugo Symbol | Variant Class | Variant Classification | dbSNP RS | HGVSc | HGVSp | HGVSp Short | SWISSPROT | BIOTYPE | SIFT | PolyPhen | Tumor Sample Barcode | Tissue | Histology | Sex | Age | Stage | Therapy Types | Drugs | Outcome |
| TRIM37 | SNV | Missense_Mutation | c.2192N>A | p.Arg731Lys | p.R731K | O94972 | protein_coding | tolerated_low_confidence(0.81) | benign(0) | TCGA-AN-A0XW-01 | Breast | breast invasive carcinoma | Female | <65 | III/IV | Unknown | Unknown | SD | |
| TRIM37 | SNV | Missense_Mutation | c.904N>G | p.Gln302Glu | p.Q302E | O94972 | protein_coding | tolerated(0.15) | benign(0.137) | TCGA-BH-A0DZ-01 | Breast | breast invasive carcinoma | Female | <65 | I/II | Chemotherapy | docetaxel | SD | |
| TRIM37 | SNV | Missense_Mutation | c.1433N>G | p.Ser478Cys | p.S478C | O94972 | protein_coding | deleterious_low_confidence(0) | benign(0) | TCGA-C8-A1HM-01 | Breast | breast invasive carcinoma | Female | >=65 | I/II | Chemotherapy | doxorubicin | CR | |
| TRIM37 | SNV | Missense_Mutation | c.883N>A | p.Pro295Thr | p.P295T | O94972 | protein_coding | deleterious(0.05) | benign(0.387) | TCGA-C5-A1MK-01 | Cervix | cervical & endocervical cancer | Female | >=65 | III/IV | Chemotherapy | carboplatin | PD | |
| TRIM37 | SNV | Missense_Mutation | novel | c.218N>A | p.Thr73Lys | p.T73K | O94972 | protein_coding | deleterious(0.01) | possibly_damaging(0.767) | TCGA-C5-A901-01 | Cervix | cervical & endocervical cancer | Female | <65 | I/II | Unknown | Unknown | SD |
| TRIM37 | SNV | Missense_Mutation | rs148095355 | c.2324G>A | p.Arg775Gln | p.R775Q | O94972 | protein_coding | deleterious_low_confidence(0) | probably_damaging(0.968) | TCGA-C5-A902-01 | Cervix | cervical & endocervical cancer | Female | <65 | I/II | Chemotherapy | cisplatin | SD |
| TRIM37 | SNV | Missense_Mutation | c.745N>A | p.Gln249Lys | p.Q249K | O94972 | protein_coding | tolerated(0.1) | benign(0.097) | TCGA-MA-AA3Z-01 | Cervix | cervical & endocervical cancer | Female | <65 | I/II | Unknown | Unknown | SD | |
| TRIM37 | SNV | Missense_Mutation | c.191N>C | p.Val64Ala | p.V64A | O94972 | protein_coding | deleterious(0) | possibly_damaging(0.573) | TCGA-A6-5665-01 | Colorectum | colon adenocarcinoma | Female | >=65 | I/II | Unknown | Unknown | PD | |
| TRIM37 | SNV | Missense_Mutation | c.1210C>T | p.Arg404Cys | p.R404C | O94972 | protein_coding | deleterious(0) | probably_damaging(0.982) | TCGA-AA-3663-01 | Colorectum | colon adenocarcinoma | Male | <65 | I/II | Unknown | Unknown | SD | |
| TRIM37 | SNV | Missense_Mutation | c.568N>C | p.Ile190Leu | p.I190L | O94972 | protein_coding | tolerated(0.08) | benign(0.118) | TCGA-AA-3815-01 | Colorectum | colon adenocarcinoma | Female | >=65 | I/II | Unknown | Unknown | SD |
| Page: 1 2 3 4 5 6 7 8 9 10 |
Top |
Related drugs of malignant transformation related genes |
| Identification of chemicals and drugs interact with genes involved in malignant transfromation |
| (DGIdb 4.0) |
| Entrez ID | Symbol | Category | Interaction Types | Drug Claim Name | Drug Name | PMIDs |
| Page: 1 |

Copyright 2023-Present -The University of Texas Health Science Center at Houston |