
|
|||||
|
 | |
| |
| |
| |
| |
| |
|
Gene: TRIM35 |
Gene summary for TRIM35 |
| Gene information | Species | Human | Gene symbol | TRIM35 | Gene ID | 23087 |
| Gene name | tripartite motif containing 35 | |
| Gene Alias | HLS5 | |
| Cytomap | 8p21.2 | |
| Gene Type | protein-coding | GO ID | GO:0000278 | UniProtAcc | E5RGB3 |
Top |
Malignant transformation analysis |
| Identification of the aberrant gene expression in precancerous and cancerous lesions by comparing the gene expression of stem-like cells in diseased tissues with normal stem cells |
| Entrez ID | Symbol | Replicates | Species | Organ | Tissue | Adj P-value | Log2FC | Malignancy |
| 23087 | TRIM35 | LZE4T | Human | Esophagus | ESCC | 1.17e-02 | 1.19e-01 | 0.0811 |
| 23087 | TRIM35 | LZE24T | Human | Esophagus | ESCC | 1.77e-07 | 1.83e-01 | 0.0596 |
| 23087 | TRIM35 | P2T-E | Human | Esophagus | ESCC | 8.71e-03 | 6.08e-02 | 0.1177 |
| 23087 | TRIM35 | P4T-E | Human | Esophagus | ESCC | 2.25e-06 | 2.18e-01 | 0.1323 |
| 23087 | TRIM35 | P8T-E | Human | Esophagus | ESCC | 1.89e-04 | 4.72e-02 | 0.0889 |
| 23087 | TRIM35 | P9T-E | Human | Esophagus | ESCC | 7.71e-05 | 1.46e-01 | 0.1131 |
| 23087 | TRIM35 | P10T-E | Human | Esophagus | ESCC | 3.32e-12 | 1.77e-01 | 0.116 |
| 23087 | TRIM35 | P12T-E | Human | Esophagus | ESCC | 3.70e-10 | 1.95e-01 | 0.1122 |
| 23087 | TRIM35 | P16T-E | Human | Esophagus | ESCC | 2.62e-14 | 9.81e-02 | 0.1153 |
| 23087 | TRIM35 | P20T-E | Human | Esophagus | ESCC | 1.23e-22 | 4.20e-01 | 0.1124 |
| 23087 | TRIM35 | P21T-E | Human | Esophagus | ESCC | 2.75e-14 | 1.59e-01 | 0.1617 |
| 23087 | TRIM35 | P22T-E | Human | Esophagus | ESCC | 1.38e-07 | 1.43e-01 | 0.1236 |
| 23087 | TRIM35 | P23T-E | Human | Esophagus | ESCC | 2.57e-07 | 1.85e-01 | 0.108 |
| 23087 | TRIM35 | P24T-E | Human | Esophagus | ESCC | 1.22e-06 | 1.62e-01 | 0.1287 |
| 23087 | TRIM35 | P26T-E | Human | Esophagus | ESCC | 1.40e-11 | 1.05e-01 | 0.1276 |
| 23087 | TRIM35 | P27T-E | Human | Esophagus | ESCC | 6.01e-10 | 1.37e-01 | 0.1055 |
| 23087 | TRIM35 | P28T-E | Human | Esophagus | ESCC | 2.92e-18 | 3.28e-01 | 0.1149 |
| 23087 | TRIM35 | P30T-E | Human | Esophagus | ESCC | 2.30e-15 | 5.05e-01 | 0.137 |
| 23087 | TRIM35 | P31T-E | Human | Esophagus | ESCC | 1.06e-04 | 5.98e-02 | 0.1251 |
| 23087 | TRIM35 | P32T-E | Human | Esophagus | ESCC | 6.50e-07 | 4.84e-02 | 0.1666 |
| Page: 1 2 3 |
| Tissue | Expression Dynamics | Abbreviation |
| Esophagus | 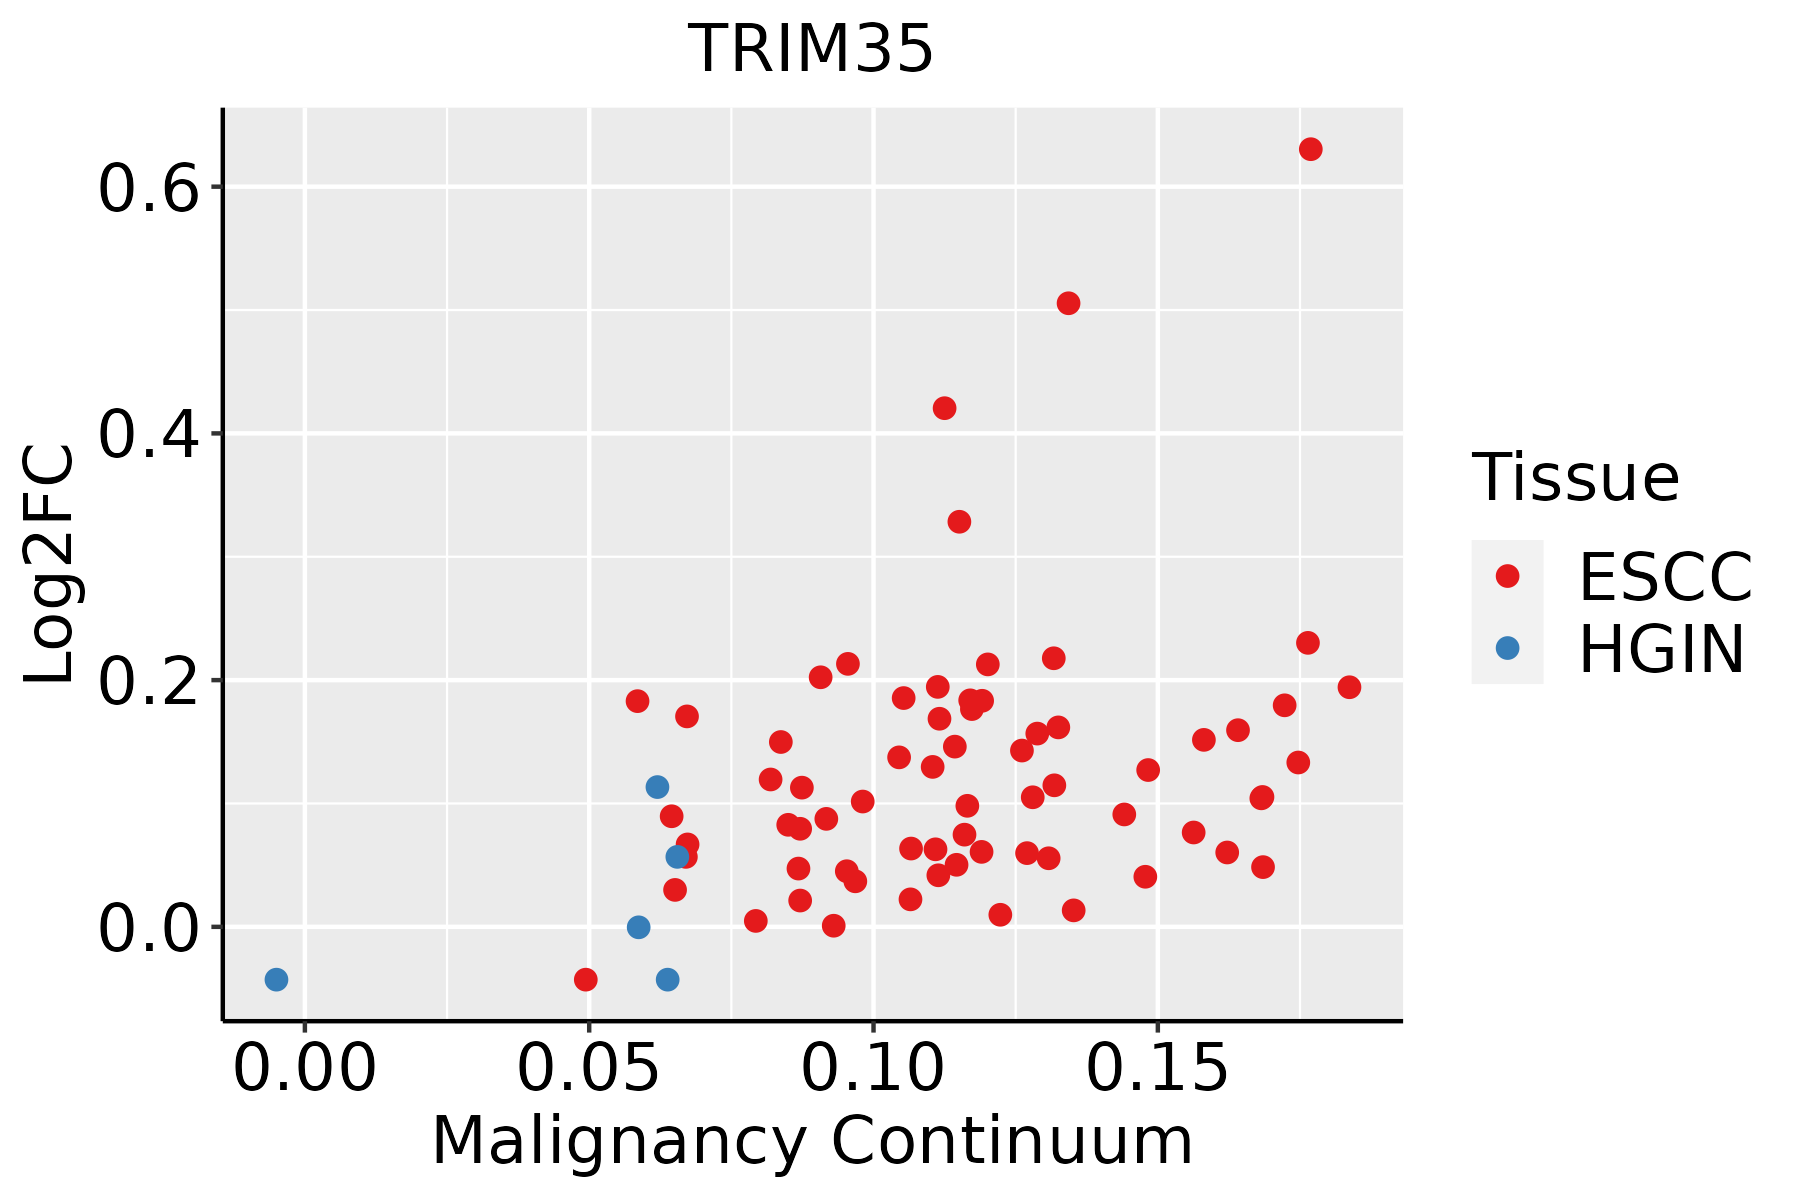 | ESCC: Esophageal squamous cell carcinoma |
| HGIN: High-grade intraepithelial neoplasias | ||
| LGIN: Low-grade intraepithelial neoplasias |
| ∗log2FC in expression of this searched gene in stem-like cells from each diseased tissue sample relative to stem-like cells in normal samples in each tissue plotted against the malignancy continuum. Samples are colored based on if they are from different disease stage. |
Top |
Malignant transformation related pathway analysis |
| Find out the enriched GO biological processes and KEGG pathways involved in transition from healthy to precancer to cancer |
| Tissue | Disease Stage | Enriched GO biological Processes |
| Colorectum | AD |  |
| Colorectum | SER |  |
| Colorectum | MSS |  |
| Colorectum | MSI-H |  |
| Colorectum | FAP |  |
| ∗Top 15 enriched GO BP terms are showed in the bar plot of each disease state in each tissue. Each row represents a significant GO biological process which is colored according to the -log10(p.adjust). |
| Page: 1 2 3 4 5 6 7 8 9 |
| GO ID | Tissue | Disease Stage | Description | Gene Ratio | Bg Ratio | pvalue | p.adjust | Count |
| GO:0016032111 | Esophagus | ESCC | viral process | 301/8552 | 415/18723 | 3.34e-29 | 1.32e-26 | 301 |
| GO:0019058111 | Esophagus | ESCC | viral life cycle | 226/8552 | 317/18723 | 1.17e-20 | 1.76e-18 | 226 |
| GO:000734615 | Esophagus | ESCC | regulation of mitotic cell cycle | 293/8552 | 457/18723 | 8.00e-16 | 5.64e-14 | 293 |
| GO:0050792111 | Esophagus | ESCC | regulation of viral process | 119/8552 | 164/18723 | 2.19e-12 | 9.03e-11 | 119 |
| GO:1903900111 | Esophagus | ESCC | regulation of viral life cycle | 106/8552 | 148/18723 | 1.26e-10 | 3.72e-09 | 106 |
| GO:0044403111 | Esophagus | ESCC | biological process involved in symbiotic interaction | 186/8552 | 290/18723 | 1.43e-10 | 4.16e-09 | 186 |
| GO:00457865 | Esophagus | ESCC | negative regulation of cell cycle | 236/8552 | 385/18723 | 3.62e-10 | 9.93e-09 | 236 |
| GO:0051701111 | Esophagus | ESCC | biological process involved in interaction with host | 135/8552 | 203/18723 | 1.49e-09 | 3.49e-08 | 135 |
| GO:0052126111 | Esophagus | ESCC | movement in host environment | 117/8552 | 175/18723 | 1.14e-08 | 2.26e-07 | 117 |
| GO:004852516 | Esophagus | ESCC | negative regulation of viral process | 66/8552 | 92/18723 | 3.49e-07 | 4.88e-06 | 66 |
| GO:004593013 | Esophagus | ESCC | negative regulation of mitotic cell cycle | 143/8552 | 235/18723 | 1.84e-06 | 2.15e-05 | 143 |
| GO:001907614 | Esophagus | ESCC | viral release from host cell | 28/8552 | 34/18723 | 1.21e-05 | 1.12e-04 | 28 |
| GO:003589014 | Esophagus | ESCC | exit from host | 28/8552 | 34/18723 | 1.21e-05 | 1.12e-04 | 28 |
| GO:003589114 | Esophagus | ESCC | exit from host cell | 28/8552 | 34/18723 | 1.21e-05 | 1.12e-04 | 28 |
| GO:0043903111 | Esophagus | ESCC | regulation of biological process involved in symbiotic interaction | 49/8552 | 72/18723 | 1.03e-04 | 7.26e-04 | 49 |
| GO:19021864 | Esophagus | ESCC | regulation of viral release from host cell | 20/8552 | 26/18723 | 1.19e-03 | 5.88e-03 | 20 |
| Page: 1 |
| Pathway ID | Tissue | Disease Stage | Description | Gene Ratio | Bg Ratio | pvalue | p.adjust | qvalue | Count |
| Page: 1 |
Top |
Cell-cell communication analysis |
| Identification of potential cell-cell interactions between two cell types and their ligand-receptor pairs for different disease states |
| Ligand | Receptor | LRpair | Pathway | Tissue | Disease Stage |
| Page: 1 |
Top |
Single-cell gene regulatory network inference analysis |
| Find out the significant the regulons (TFs) and the target genes of each regulon across cell types for different disease states |
| TF | Cell Type | Tissue | Disease Stage | Target Gene | RSS | Regulon Activity |
| ∗The dot plots of a searched regulon are shown for all cell subpopulations in each disease state of each tissue based on the regulon specific score inferred using pySCENIC and by calculating the average expression. |
| Page: 1 |
Top |
Somatic mutation of malignant transformation related genes |
| Annotation of somatic variants for genes involved in malignant transformation |
| Hugo Symbol | Variant Class | Variant Classification | dbSNP RS | HGVSc | HGVSp | HGVSp Short | SWISSPROT | BIOTYPE | SIFT | PolyPhen | Tumor Sample Barcode | Tissue | Histology | Sex | Age | Stage | Therapy Types | Drugs | Outcome |
| TRIM35 | SNV | Missense_Mutation | rs753753799 | c.781N>T | p.Arg261Cys | p.R261C | Q9UPQ4 | protein_coding | deleterious(0) | possibly_damaging(0.877) | TCGA-AR-A0TY-01 | Breast | breast invasive carcinoma | Female | <65 | I/II | Unspecific | Paclitaxel | PD |
| TRIM35 | SNV | Missense_Mutation | novel | c.486N>G | p.Phe162Leu | p.F162L | Q9UPQ4 | protein_coding | tolerated(0.06) | benign(0.007) | TCGA-EW-A3E8-01 | Breast | breast invasive carcinoma | Female | <65 | I/II | Hormone Therapy | anastrozole | SD |
| TRIM35 | deletion | Frame_Shift_Del | novel | c.730delG | p.Glu244ArgfsTer2 | p.E244Rfs*2 | Q9UPQ4 | protein_coding | TCGA-EW-A2FV-01 | Breast | breast invasive carcinoma | Female | <65 | III/IV | Chemotherapy | docetaxel | SD | ||
| TRIM35 | SNV | Missense_Mutation | c.262N>A | p.Glu88Lys | p.E88K | Q9UPQ4 | protein_coding | deleterious(0.05) | benign(0.041) | TCGA-EK-A3GK-01 | Cervix | cervical & endocervical cancer | Female | <65 | I/II | Unknown | Unknown | SD | |
| TRIM35 | SNV | Missense_Mutation | c.1330G>A | p.Ala444Thr | p.A444T | Q9UPQ4 | protein_coding | tolerated(0.1) | benign(0.271) | TCGA-A6-A565-01 | Colorectum | colon adenocarcinoma | Female | <65 | III/IV | Unspecific | 5FU | PD | |
| TRIM35 | SNV | Missense_Mutation | rs765088471 | c.1337G>A | p.Arg446His | p.R446H | Q9UPQ4 | protein_coding | tolerated(0.19) | benign(0.001) | TCGA-AA-3864-01 | Colorectum | colon adenocarcinoma | Male | >=65 | I/II | Unknown | Unknown | SD |
| TRIM35 | SNV | Missense_Mutation | c.633G>T | p.Glu211Asp | p.E211D | Q9UPQ4 | protein_coding | deleterious(0.03) | benign(0.024) | TCGA-AA-A010-01 | Colorectum | colon adenocarcinoma | Female | <65 | I/II | Chemotherapy | folinic | CR | |
| TRIM35 | SNV | Missense_Mutation | c.1336N>T | p.Arg446Cys | p.R446C | Q9UPQ4 | protein_coding | tolerated(0.08) | benign(0.346) | TCGA-AZ-6598-01 | Colorectum | colon adenocarcinoma | Female | >=65 | I/II | Unknown | Unknown | SD | |
| TRIM35 | SNV | Missense_Mutation | rs185776694 | c.556C>T | p.Arg186Trp | p.R186W | Q9UPQ4 | protein_coding | deleterious(0) | probably_damaging(0.94) | TCGA-CM-6162-01 | Colorectum | colon adenocarcinoma | Female | <65 | III/IV | Chemotherapy | oxaliplatin | SD |
| TRIM35 | SNV | Missense_Mutation | rs765858051 | c.1436N>A | p.Arg479His | p.R479H | Q9UPQ4 | protein_coding | deleterious(0.04) | probably_damaging(0.984) | TCGA-CM-6171-01 | Colorectum | colon adenocarcinoma | Female | >=65 | I/II | Unknown | Unknown | SD |
| Page: 1 2 3 4 5 6 |
Top |
Related drugs of malignant transformation related genes |
| Identification of chemicals and drugs interact with genes involved in malignant transfromation |
| (DGIdb 4.0) |
| Entrez ID | Symbol | Category | Interaction Types | Drug Claim Name | Drug Name | PMIDs |
| Page: 1 |

Copyright 2023-Present -The University of Texas Health Science Center at Houston |