Schematic overview of the cellular and molecular mechanisms involved in the cancer progression, including the proposed cellular and molecular mechanisms in cancer cells trajectory. AT1: alveolar type 1 cells; AT2: alveolar type 2 cells; AAH: atypical adenomatous hyperplasia; AIS: adenocarcinoma in situ; MIA: minimally invasive adenocarcinoma; IA: invasive adenocarcinoma; EMT: epithelial-mesenchymal transition

Home

Download

Statistics

Help

Contact

Center for Computational Systems Medicine
leaf

Gene summary

leaf

Malignant transformation analysis

leaf

Malignant transformation related pathway analysis

leaf

Cell-cell communication analysis

leaf

Single-cell gene regulatory network inference analysis

leaf

Somatic mutation of malignant transformation related genes

leaf

Related drugs of malignant transformation related genes

Gene: TRIM29

Gene summary for TRIM29

check button Gene summary.

Gene informationSpeciesHuman
Gene symbol

TRIM29

Gene ID

23650

Gene nametripartite motif containing 29
Gene AliasATDC
Cytomap11q23.3
Gene Typeprotein-coding
GO ID

GO:0000122

UniProtAcc

B7Z5V5


Top

Malignant transformation analysis

check button Identification of the aberrant gene expression in precancerous and cancerous lesions by comparing the gene expression of stem-like cells in diseased tissues with normal stem cells
check button Malignant transformation involving gene list.
Entrez IDSymbolReplicatesSpeciesOrganTissueAdj P-valueLog2FCMalignancy
23650TRIM29CA_HPV_1HumanCervixCC1.42e-12-3.19e-010.0264
23650TRIM29CA_HPV_3HumanCervixCC2.05e-083.39e-010.0414
23650TRIM29TumorHumanCervixCC5.02e-387.91e-010.1241
23650TRIM29sample3HumanCervixCC5.07e-478.08e-010.1387
23650TRIM29L1HumanCervixCC3.73e-033.65e-010.0802
23650TRIM29T3HumanCervixCC1.34e-468.25e-010.1389
23650TRIM29HTA11_2487_2000001011HumanColorectumSER1.05e-032.11e-01-0.1808
23650TRIM29HTA11_2951_2000001011HumanColorectumAD2.35e-032.95e-010.0216
23650TRIM29HTA11_411_2000001011HumanColorectumSER1.94e-045.25e-01-0.2602
23650TRIM29HTA11_8622_2000001021HumanColorectumSER2.29e-063.14e-010.0528
23650TRIM29HTA11_7696_3000711011HumanColorectumAD4.86e-049.76e-020.0674
23650TRIM29HTA11_99999970781_79442HumanColorectumMSS3.10e-112.58e-010.294
23650TRIM29HTA11_99999965104_69814HumanColorectumMSS2.42e-041.89e-010.281
23650TRIM29HTA11_99999971662_82457HumanColorectumMSS2.09e-256.04e-010.3859
23650TRIM29HTA11_99999974143_84620HumanColorectumMSS3.78e-184.40e-010.3005
23650TRIM29LZE4THumanEsophagusESCC7.93e-086.00e-010.0811
23650TRIM29LZE8THumanEsophagusESCC2.62e-036.90e-020.067
23650TRIM29LZE24THumanEsophagusESCC9.99e-211.27e+000.0596
23650TRIM29LZE22D3HumanEsophagusHGIN1.83e-051.80e-010.0653
23650TRIM29LZE6THumanEsophagusESCC1.47e-06-4.32e-010.0845
Page: 1 2 3 4 5 6 7 

check button Transcriptomic changes along malignancy continuum.
TissueExpression DynamicsAbbreviation
CervixThe image shows the transcriptomic changes along malignancy continuum.log2FC in expression of this searched gene in stem-like cells from each diseased tissue sample relative to stem-like cells in normal samples in each tissue plotted against the malignancy continuum. Samples are colored based on if they are from different disease stage.CC: Cervix cancer
HSIL_HPV: HPV-infected high-grade squamous intraepithelial lesions
N_HPV: HPV-infected normal cervix
Colorectum (GSE201348)The image shows the transcriptomic changes along malignancy continuum.log2FC in expression of this searched gene in stem-like cells from each diseased tissue sample relative to stem-like cells in normal samples in each tissue plotted against the malignancy continuum. Samples are colored based on if they are from different disease stage.FAP: Familial adenomatous polyposis
CRC: Colorectal cancer
Colorectum (HTA11)The image shows the transcriptomic changes along malignancy continuum.log2FC in expression of this searched gene in stem-like cells from each diseased tissue sample relative to stem-like cells in normal samples in each tissue plotted against the malignancy continuum. Samples are colored based on if they are from different disease stage.AD: Adenomas
SER: Sessile serrated lesions
MSI-H: Microsatellite-high colorectal cancer
MSS: Microsatellite stable colorectal cancer
EsophagusThe image shows the transcriptomic changes along malignancy continuum.log2FC in expression of this searched gene in stem-like cells from each diseased tissue sample relative to stem-like cells in normal samples in each tissue plotted against the malignancy continuum. Samples are colored based on if they are from different disease stage.ESCC: Esophageal squamous cell carcinoma
HGIN: High-grade intraepithelial neoplasias
LGIN: Low-grade intraepithelial neoplasias
Oral CavityThe image shows the transcriptomic changes along malignancy continuum.log2FC in expression of this searched gene in stem-like cells from each diseased tissue sample relative to stem-like cells in normal samples in each tissue plotted against the malignancy continuum. Samples are colored based on if they are from different disease stage.
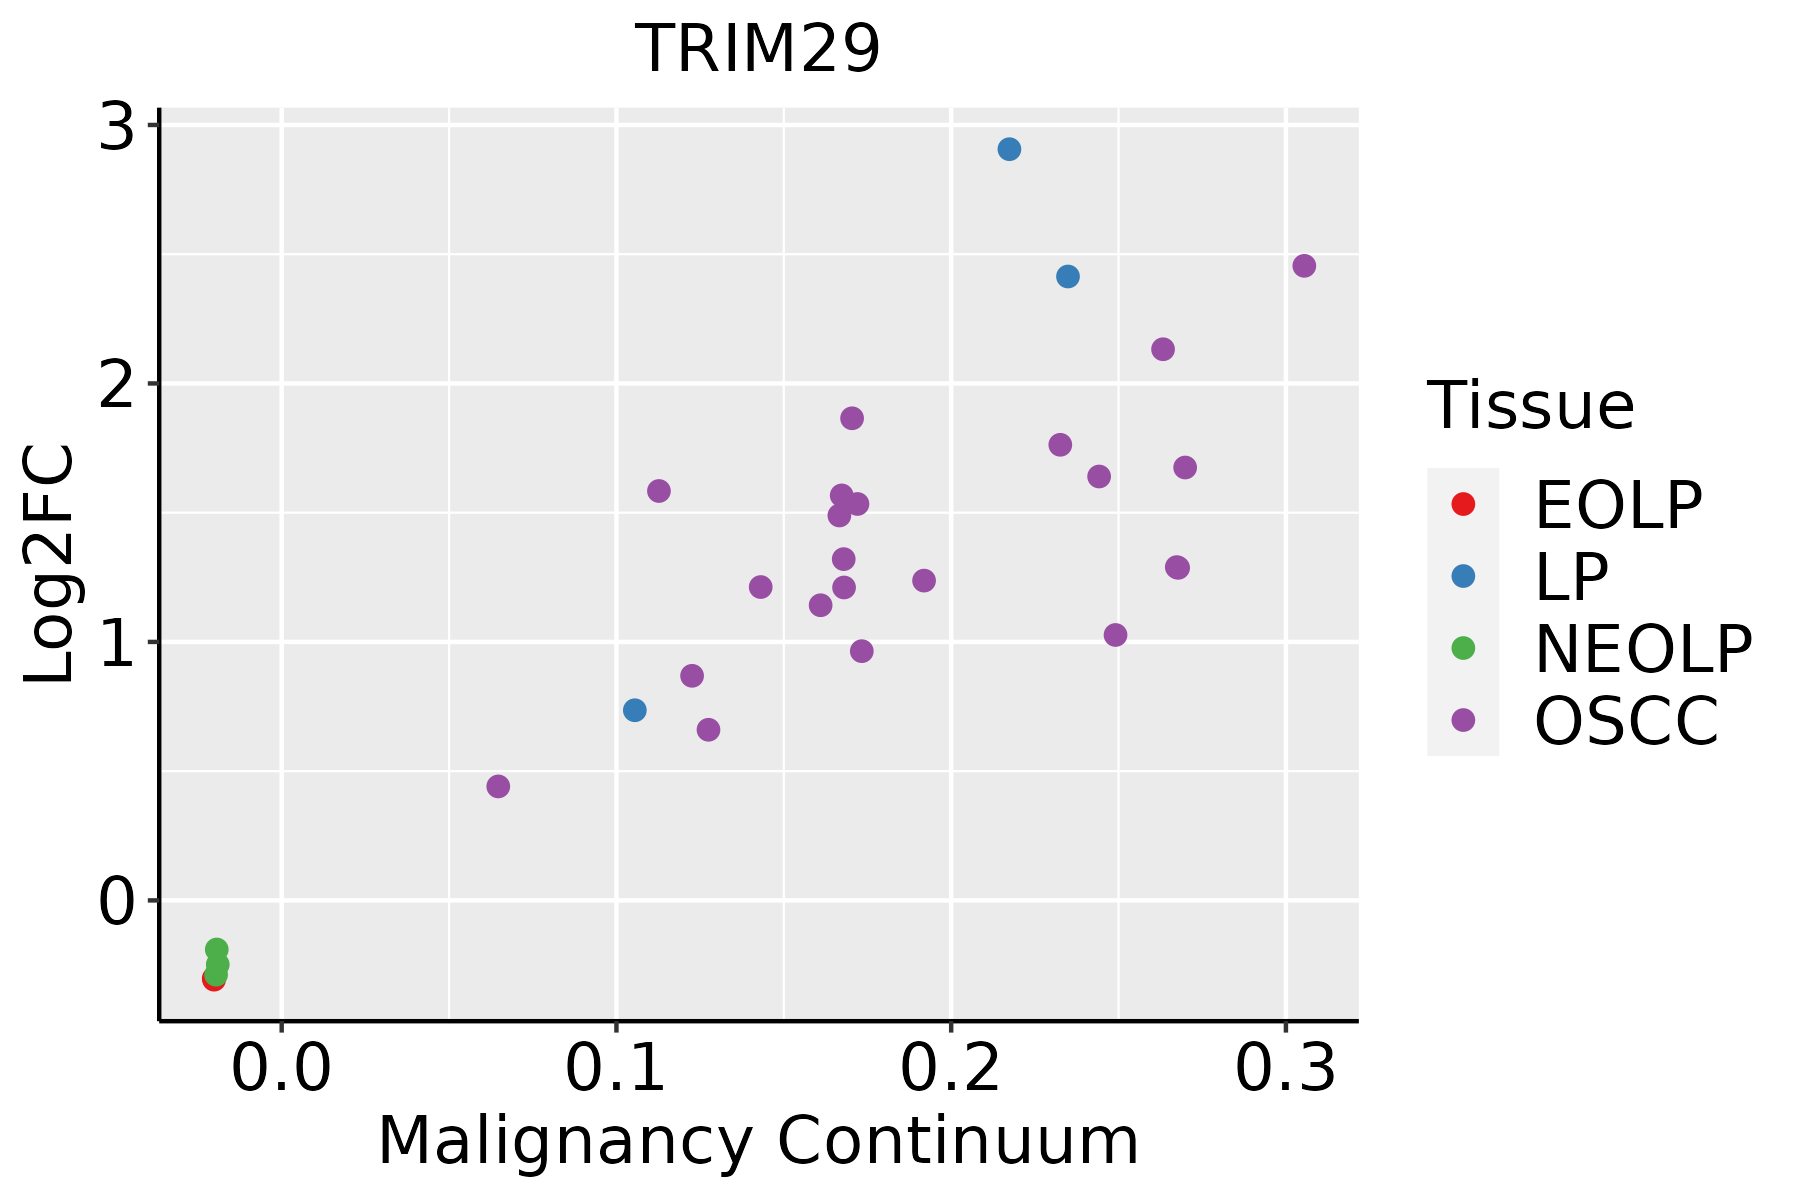
EOLP: Erosive Oral lichen planus
LP: leukoplakia
NEOLP: Non-erosive oral lichen planus
OSCC: Oral squamous cell carcinoma
ProstateThe image shows the transcriptomic changes along malignancy continuum.log2FC in expression of this searched gene in stem-like cells from each diseased tissue sample relative to stem-like cells in normal samples in each tissue plotted against the malignancy continuum. Samples are colored based on if they are from different disease stage.
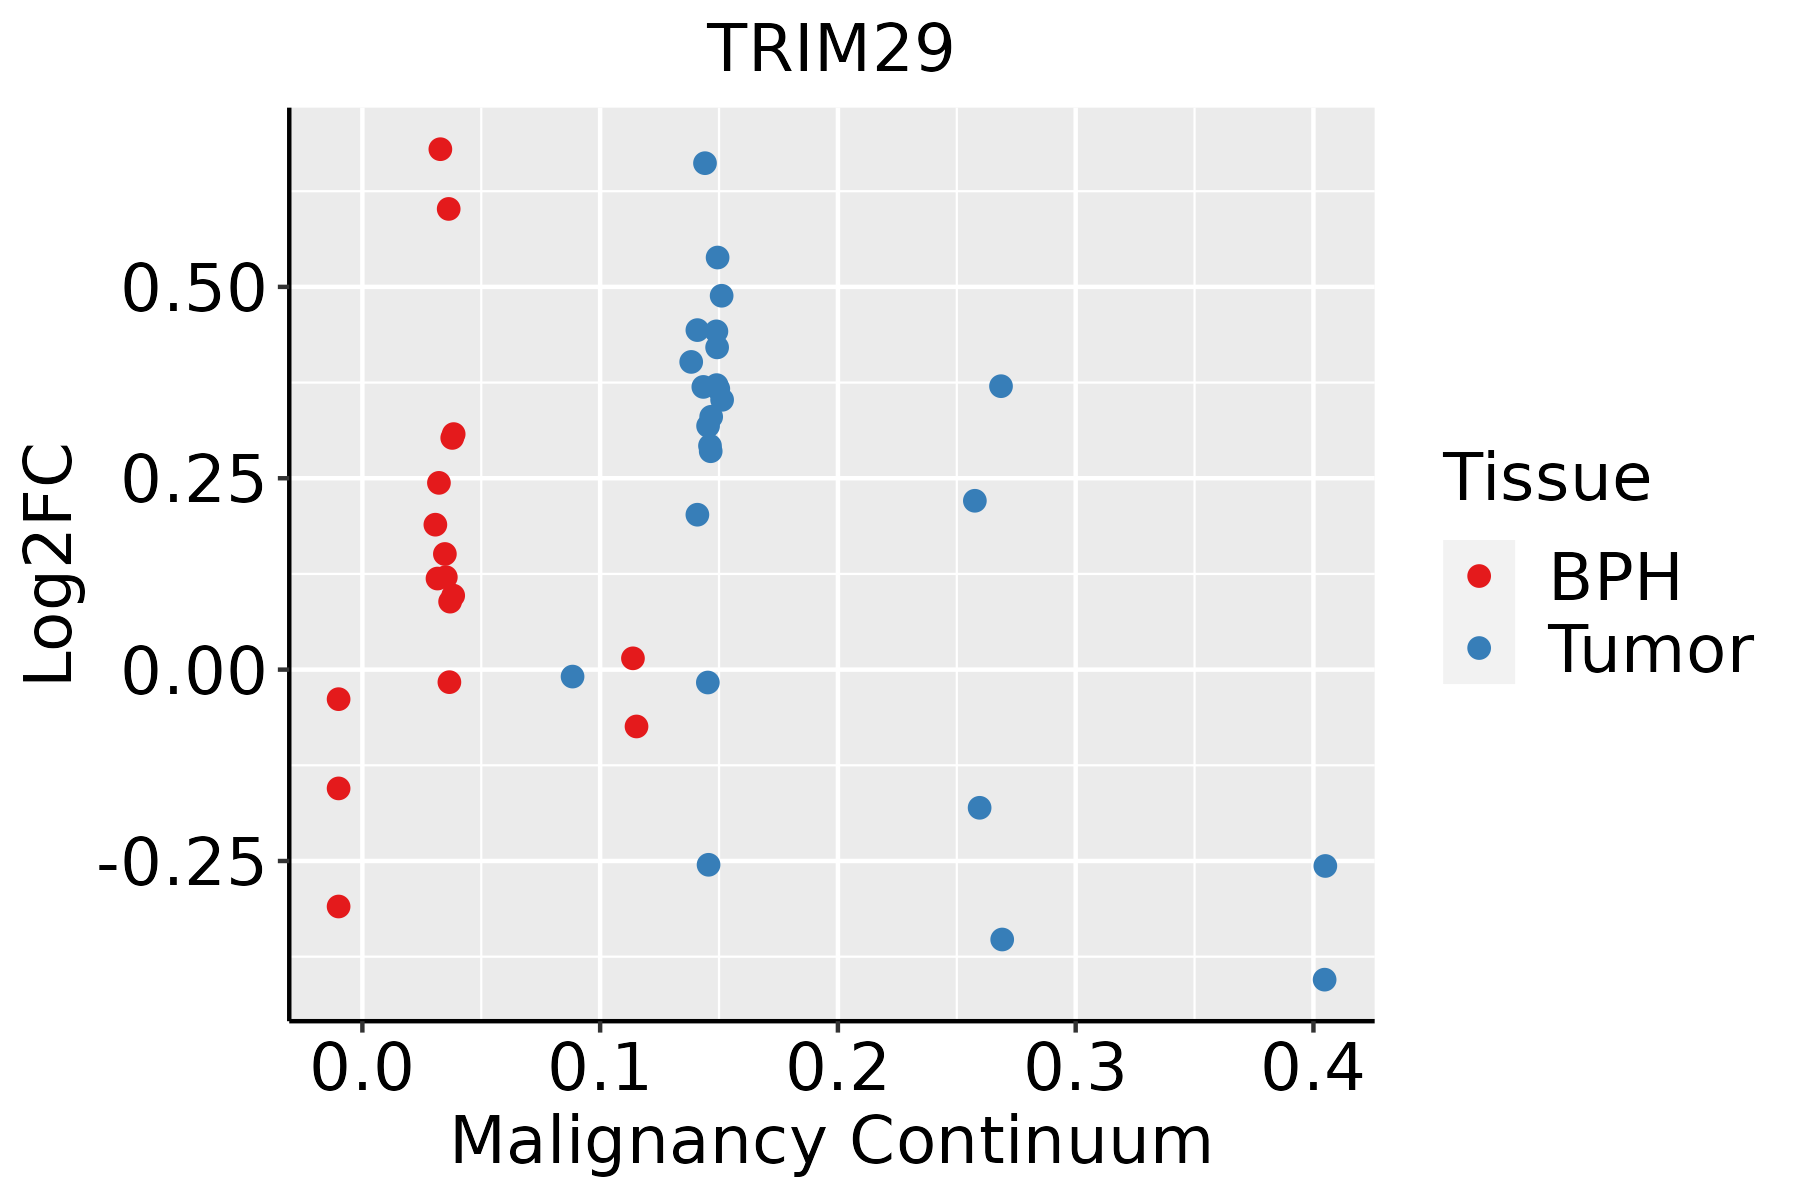
BPH: Benign Prostatic Hyperplasia
SkinThe image shows the transcriptomic changes along malignancy continuum.log2FC in expression of this searched gene in stem-like cells from each diseased tissue sample relative to stem-like cells in normal samples in each tissue plotted against the malignancy continuum. Samples are colored based on if they are from different disease stage.AK: Actinic keratosis
cSCC: Cutaneous squamous cell carcinoma
SCCIS:squamous cell carcinoma in situ
∗log2FC in expression of this searched gene in stem-like cells from each diseased tissue sample relative to stem-like cells in normal samples in each tissue plotted against the malignancy continuum. Samples are colored based on if they are from different disease stage.

Top

Malignant transformation related pathway analysis

check buttonFind out the enriched GO biological processes and KEGG pathways involved in transition from healthy to precancer to cancer
check button Figure of enriched GO biological processes.
TissueDisease StageEnriched GO biological Processes
ColorectumADGO analysis - Figure of enriched GO biological processes: Top 15 enriched GO BP terms are showed in the bar plot of each disease state in each tissue. Each row represents a significant GO biological process which is colored according to the -log10(p.adjust).
ColorectumSERGO analysis - Figure of enriched GO biological processes: Top 15 enriched GO BP terms are showed in the bar plot of each disease state in each tissue. Each row represents a significant GO biological process which is colored according to the -log10(p.adjust).
ColorectumMSSGO analysis - Figure of enriched GO biological processes: Top 15 enriched GO BP terms are showed in the bar plot of each disease state in each tissue. Each row represents a significant GO biological process which is colored according to the -log10(p.adjust).
ColorectumMSI-HGO analysis - Figure of enriched GO biological processes: Top 15 enriched GO BP terms are showed in the bar plot of each disease state in each tissue. Each row represents a significant GO biological process which is colored according to the -log10(p.adjust).
ColorectumFAPGO analysis - Figure of enriched GO biological processes: Top 15 enriched GO BP terms are showed in the bar plot of each disease state in each tissue. Each row represents a significant GO biological process which is colored according to the -log10(p.adjust).
∗Top 15 enriched GO BP terms are showed in the bar plot of each disease state in each tissue. Each row represents a significant GO biological process which is colored according to the -log10(p.adjust).
Page: 1 2 3 4 5 6 7 8 9 

check button Enriched GO biological processes.
GO IDTissueDisease StageDescriptionGene RatioBg Ratiopvaluep.adjustCount
GO:00345048CervixCCprotein localization to nucleus68/2311290/187239.91e-085.25e-0668
GO:19001808CervixCCregulation of protein localization to nucleus31/2311136/187234.76e-044.69e-0331
GO:19038286CervixCCnegative regulation of cellular protein localization24/2311117/187238.10e-034.23e-0224
GO:1900180ColorectumADregulation of protein localization to nucleus55/3918136/187231.70e-077.34e-0655
GO:0034504ColorectumADprotein localization to nucleus94/3918290/187232.83e-068.09e-0594
GO:1903828ColorectumADnegative regulation of cellular protein localization39/3918117/187231.18e-031.06e-0239
GO:19001801ColorectumSERregulation of protein localization to nucleus46/2897136/187238.50e-085.27e-0646
GO:00345041ColorectumSERprotein localization to nucleus74/2897290/187235.74e-062.05e-0474
GO:19038281ColorectumSERnegative regulation of cellular protein localization30/2897117/187232.96e-032.62e-0230
GO:19001802ColorectumMSSregulation of protein localization to nucleus54/3467136/187236.20e-093.95e-0754
GO:00345042ColorectumMSSprotein localization to nucleus92/3467290/187233.66e-081.98e-0692
GO:19038282ColorectumMSSnegative regulation of cellular protein localization36/3467117/187239.19e-049.34e-0336
GO:003450417EsophagusHGINprotein localization to nucleus84/2587290/187231.06e-111.24e-0984
GO:190018017EsophagusHGINregulation of protein localization to nucleus40/2587136/187231.69e-066.31e-0540
GO:003450418EsophagusESCCprotein localization to nucleus211/8552290/187234.06e-216.60e-19211
GO:190018018EsophagusESCCregulation of protein localization to nucleus102/8552136/187232.84e-121.13e-10102
GO:19038289EsophagusESCCnegative regulation of cellular protein localization76/8552117/187231.97e-051.72e-0476
GO:003450415Oral cavityOSCCprotein localization to nucleus193/7305290/187231.22e-212.35e-19193
GO:190018015Oral cavityOSCCregulation of protein localization to nucleus93/7305136/187233.46e-121.35e-1093
GO:19038288Oral cavityOSCCnegative regulation of cellular protein localization65/7305117/187232.05e-041.36e-0365
Page: 1 2 3 

check button Enriched KEGG pathways.
Pathway IDTissueDisease StageDescriptionGene RatioBg Ratiopvaluep.adjustqvalueCount
Page: 1 

Top

Cell-cell communication analysis

check buttonIdentification of potential cell-cell interactions between two cell types and their ligand-receptor pairs for different disease states
LigandReceptorLRpairPathwayTissueDisease Stage
Page: 1 

Top

Single-cell gene regulatory network inference analysis

check buttonFind out the significant the regulons (TFs) and the target genes of each regulon across cell types for different disease states
TFCell TypeTissueDisease StageTarget GeneRSSRegulon Activity
∗The dot plots of a searched regulon are shown for all cell subpopulations in each disease state of each tissue based on the regulon specific score inferred using pySCENIC and by calculating the average expression.
Page: 1 

Top

Somatic mutation of malignant transformation related genes

check buttonAnnotation of somatic variants for genes involved in malignant transformation
Hugo SymbolVariant ClassVariant ClassificationdbSNP RSHGVScHGVSpHGVSp ShortSWISSPROTBIOTYPESIFTPolyPhenTumor Sample BarcodeTissueHistologySexAgeStageTherapy TypesDrugsOutcome
TRIM29SNVMissense_Mutationc.704N>Gp.Phe235Cysp.F235CQ14134protein_codingdeleterious(0)probably_damaging(0.999)TCGA-A8-A09A-01Breastbreast invasive carcinomaFemale<65I/IIHormone TherapytamoxiphenSD
TRIM29SNVMissense_Mutationrs185266068c.1562C>Tp.Ser521Phep.S521FQ14134protein_codingdeleterious(0)probably_damaging(0.95)TCGA-AC-A23H-01Breastbreast invasive carcinomaFemale>=65I/IIUnknownUnknownPD
TRIM29SNVMissense_Mutationnovelc.1118N>Tp.Ser373Phep.S373FQ14134protein_codingdeleterious(0.01)probably_damaging(0.942)TCGA-BH-A209-01Breastbreast invasive carcinomaFemale>=65I/IIUnknownUnknownSD
TRIM29SNVMissense_Mutationc.1420T>Cp.Tyr474Hisp.Y474HQ14134protein_codingtolerated(0.05)benign(0.003)TCGA-D8-A1J8-01Breastbreast invasive carcinomaFemale>=65I/IIHormone TherapynolvadexSD
TRIM29insertionFrame_Shift_Insnovelc.855dupTp.Glu286Terp.E286*Q14134protein_codingTCGA-B6-A400-01Breastbreast invasive carcinomaFemale<65III/IVUnknownUnknownSD
TRIM29SNVMissense_Mutationnovelc.715N>Ap.Asp239Asnp.D239NQ14134protein_codingdeleterious(0)probably_damaging(0.999)TCGA-2W-A8YY-01Cervixcervical & endocervical cancerFemale<65I/IIChemotherapycisplatinCR
TRIM29SNVMissense_Mutationnovelc.267N>Cp.Lys89Asnp.K89NQ14134protein_codingdeleterious_low_confidence(0)probably_damaging(0.994)TCGA-C5-A2LZ-01Cervixcervical & endocervical cancerFemale>=65III/IVUnknownUnknownPD
TRIM29SNVMissense_Mutationrs557844201c.893G>Ap.Arg298Hisp.R298HQ14134protein_codingdeleterious(0.01)probably_damaging(0.997)TCGA-A6-5661-01Colorectumcolon adenocarcinomaFemale>=65I/IIUnknownUnknownSD
TRIM29SNVMissense_Mutationnovelc.1500N>Tp.Lys500Asnp.K500NQ14134protein_codingtolerated(0.07)benign(0.034)TCGA-AA-A010-01Colorectumcolon adenocarcinomaFemale<65I/IIChemotherapyfolinicCR
TRIM29SNVMissense_Mutationc.260A>Cp.Asp87Alap.D87AQ14134protein_codingdeleterious_low_confidence(0)probably_damaging(0.996)TCGA-AD-6890-01Colorectumcolon adenocarcinomaMale>=65I/IIUnknownUnknownSD
Page: 1 2 3 4 5 6 7 8 9 

Top

Related drugs of malignant transformation related genes

check buttonIdentification of chemicals and drugs interact with genes involved in malignant transfromation
(DGIdb 4.0)
Entrez IDSymbolCategoryInteraction TypesDrug Claim NameDrug NamePMIDs
Page: 1