
|
|||||
|
 | |
| |
| |
| |
| |
| |
|
Gene: TRIM27 |
Gene summary for TRIM27 |
| Gene information | Species | Human | Gene symbol | TRIM27 | Gene ID | 5987 |
| Gene name | tripartite motif containing 27 | |
| Gene Alias | RFP | |
| Cytomap | 6p22.1 | |
| Gene Type | protein-coding | GO ID | GO:0000003 | UniProtAcc | A0A1U9X8R9 |
Top |
Malignant transformation analysis |
| Identification of the aberrant gene expression in precancerous and cancerous lesions by comparing the gene expression of stem-like cells in diseased tissues with normal stem cells |
| Entrez ID | Symbol | Replicates | Species | Organ | Tissue | Adj P-value | Log2FC | Malignancy |
| 5987 | TRIM27 | LZE4T | Human | Esophagus | ESCC | 6.00e-12 | 2.75e-01 | 0.0811 |
| 5987 | TRIM27 | LZE7T | Human | Esophagus | ESCC | 1.67e-05 | 6.05e-01 | 0.0667 |
| 5987 | TRIM27 | LZE20T | Human | Esophagus | ESCC | 8.66e-09 | 2.24e-01 | 0.0662 |
| 5987 | TRIM27 | LZE22T | Human | Esophagus | ESCC | 1.63e-06 | 2.32e-01 | 0.068 |
| 5987 | TRIM27 | LZE24T | Human | Esophagus | ESCC | 2.13e-15 | 6.27e-01 | 0.0596 |
| 5987 | TRIM27 | P1T-E | Human | Esophagus | ESCC | 7.92e-09 | 3.07e-01 | 0.0875 |
| 5987 | TRIM27 | P2T-E | Human | Esophagus | ESCC | 1.79e-41 | 6.39e-01 | 0.1177 |
| 5987 | TRIM27 | P4T-E | Human | Esophagus | ESCC | 7.73e-31 | 6.72e-01 | 0.1323 |
| 5987 | TRIM27 | P5T-E | Human | Esophagus | ESCC | 2.36e-10 | 4.67e-02 | 0.1327 |
| 5987 | TRIM27 | P8T-E | Human | Esophagus | ESCC | 1.13e-16 | 2.37e-01 | 0.0889 |
| 5987 | TRIM27 | P9T-E | Human | Esophagus | ESCC | 5.33e-16 | 3.12e-01 | 0.1131 |
| 5987 | TRIM27 | P10T-E | Human | Esophagus | ESCC | 8.51e-25 | 4.10e-01 | 0.116 |
| 5987 | TRIM27 | P11T-E | Human | Esophagus | ESCC | 1.13e-08 | 5.39e-01 | 0.1426 |
| 5987 | TRIM27 | P12T-E | Human | Esophagus | ESCC | 6.61e-23 | 5.22e-01 | 0.1122 |
| 5987 | TRIM27 | P15T-E | Human | Esophagus | ESCC | 4.57e-16 | 3.65e-01 | 0.1149 |
| 5987 | TRIM27 | P16T-E | Human | Esophagus | ESCC | 5.52e-18 | 3.67e-01 | 0.1153 |
| 5987 | TRIM27 | P17T-E | Human | Esophagus | ESCC | 2.78e-08 | 5.69e-01 | 0.1278 |
| 5987 | TRIM27 | P19T-E | Human | Esophagus | ESCC | 6.48e-05 | 6.56e-01 | 0.1662 |
| 5987 | TRIM27 | P20T-E | Human | Esophagus | ESCC | 9.05e-18 | 4.79e-01 | 0.1124 |
| 5987 | TRIM27 | P21T-E | Human | Esophagus | ESCC | 4.60e-20 | 4.62e-01 | 0.1617 |
| Page: 1 2 3 4 5 6 |
| Tissue | Expression Dynamics | Abbreviation |
| Esophagus | 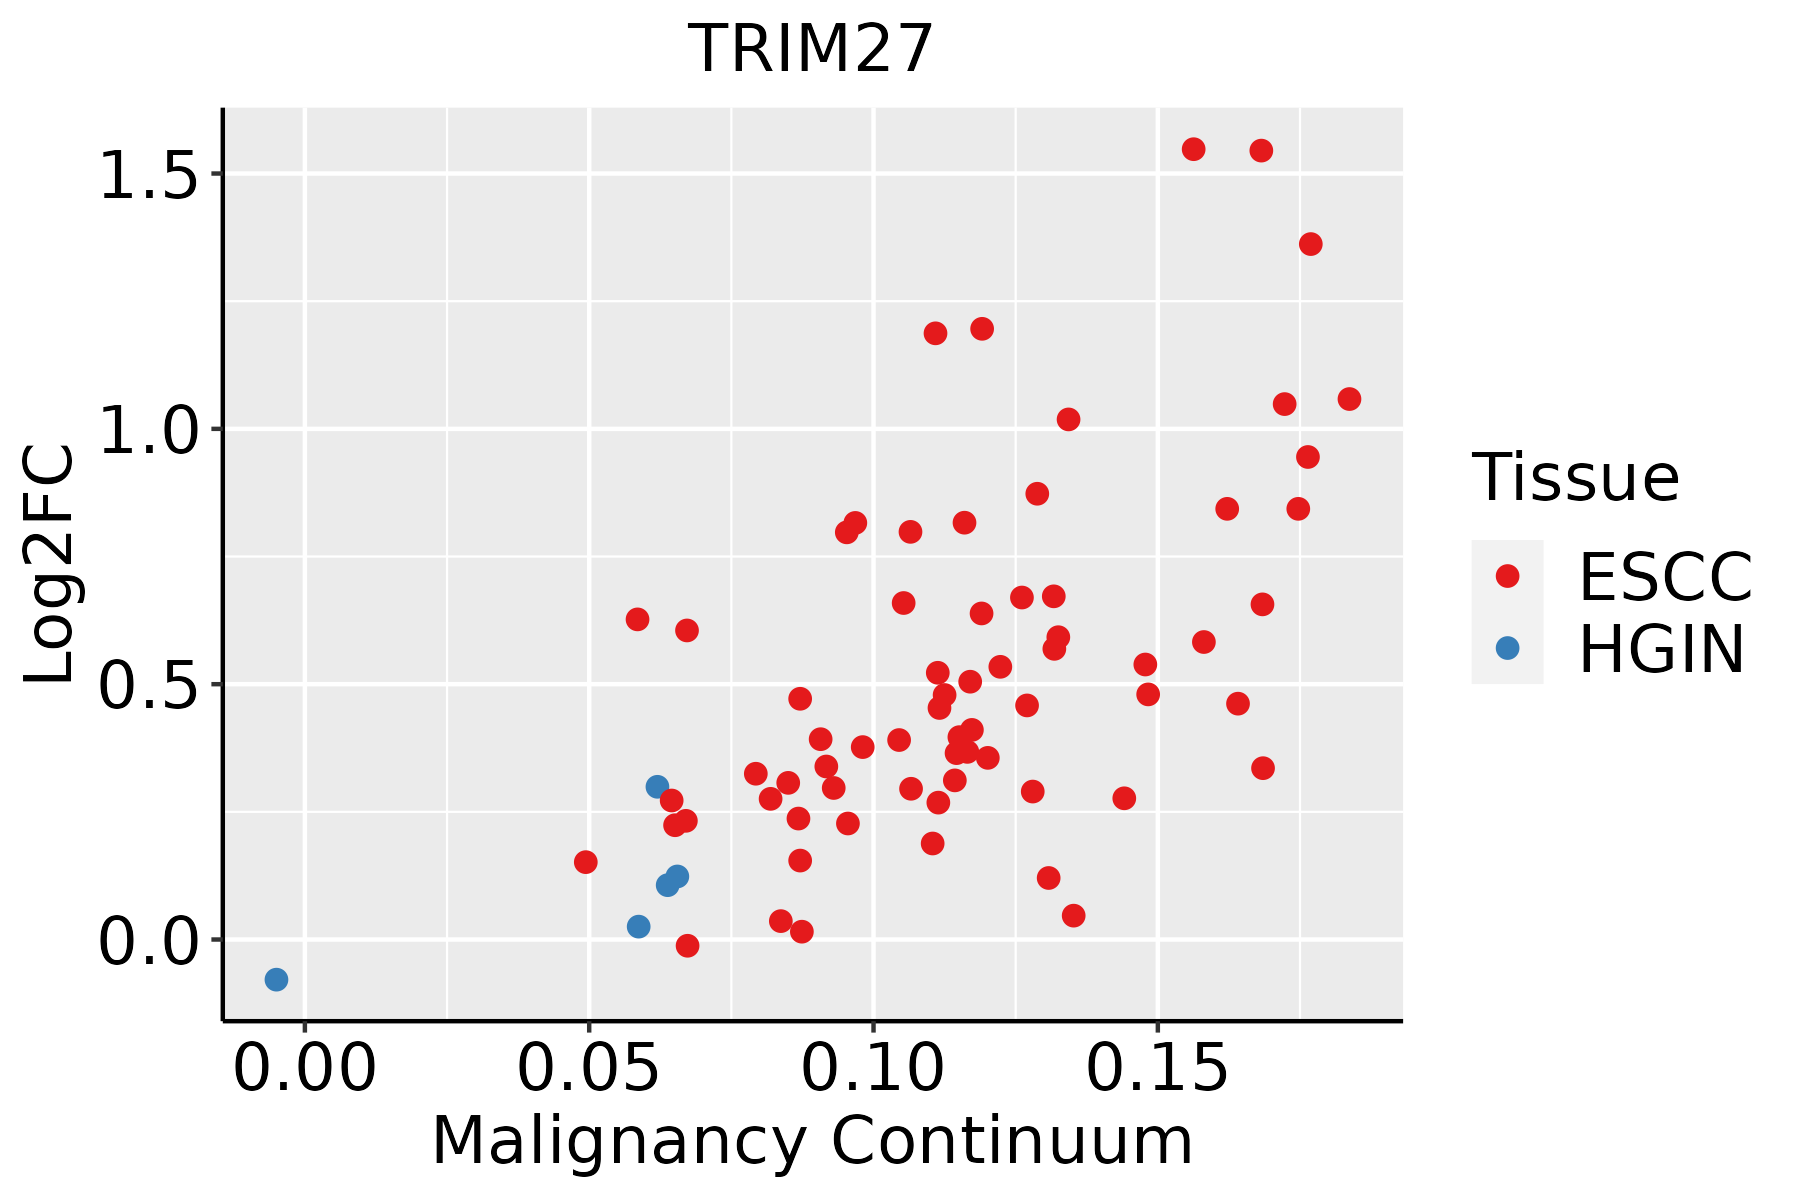 | ESCC: Esophageal squamous cell carcinoma |
| HGIN: High-grade intraepithelial neoplasias | ||
| LGIN: Low-grade intraepithelial neoplasias | ||
| Liver | 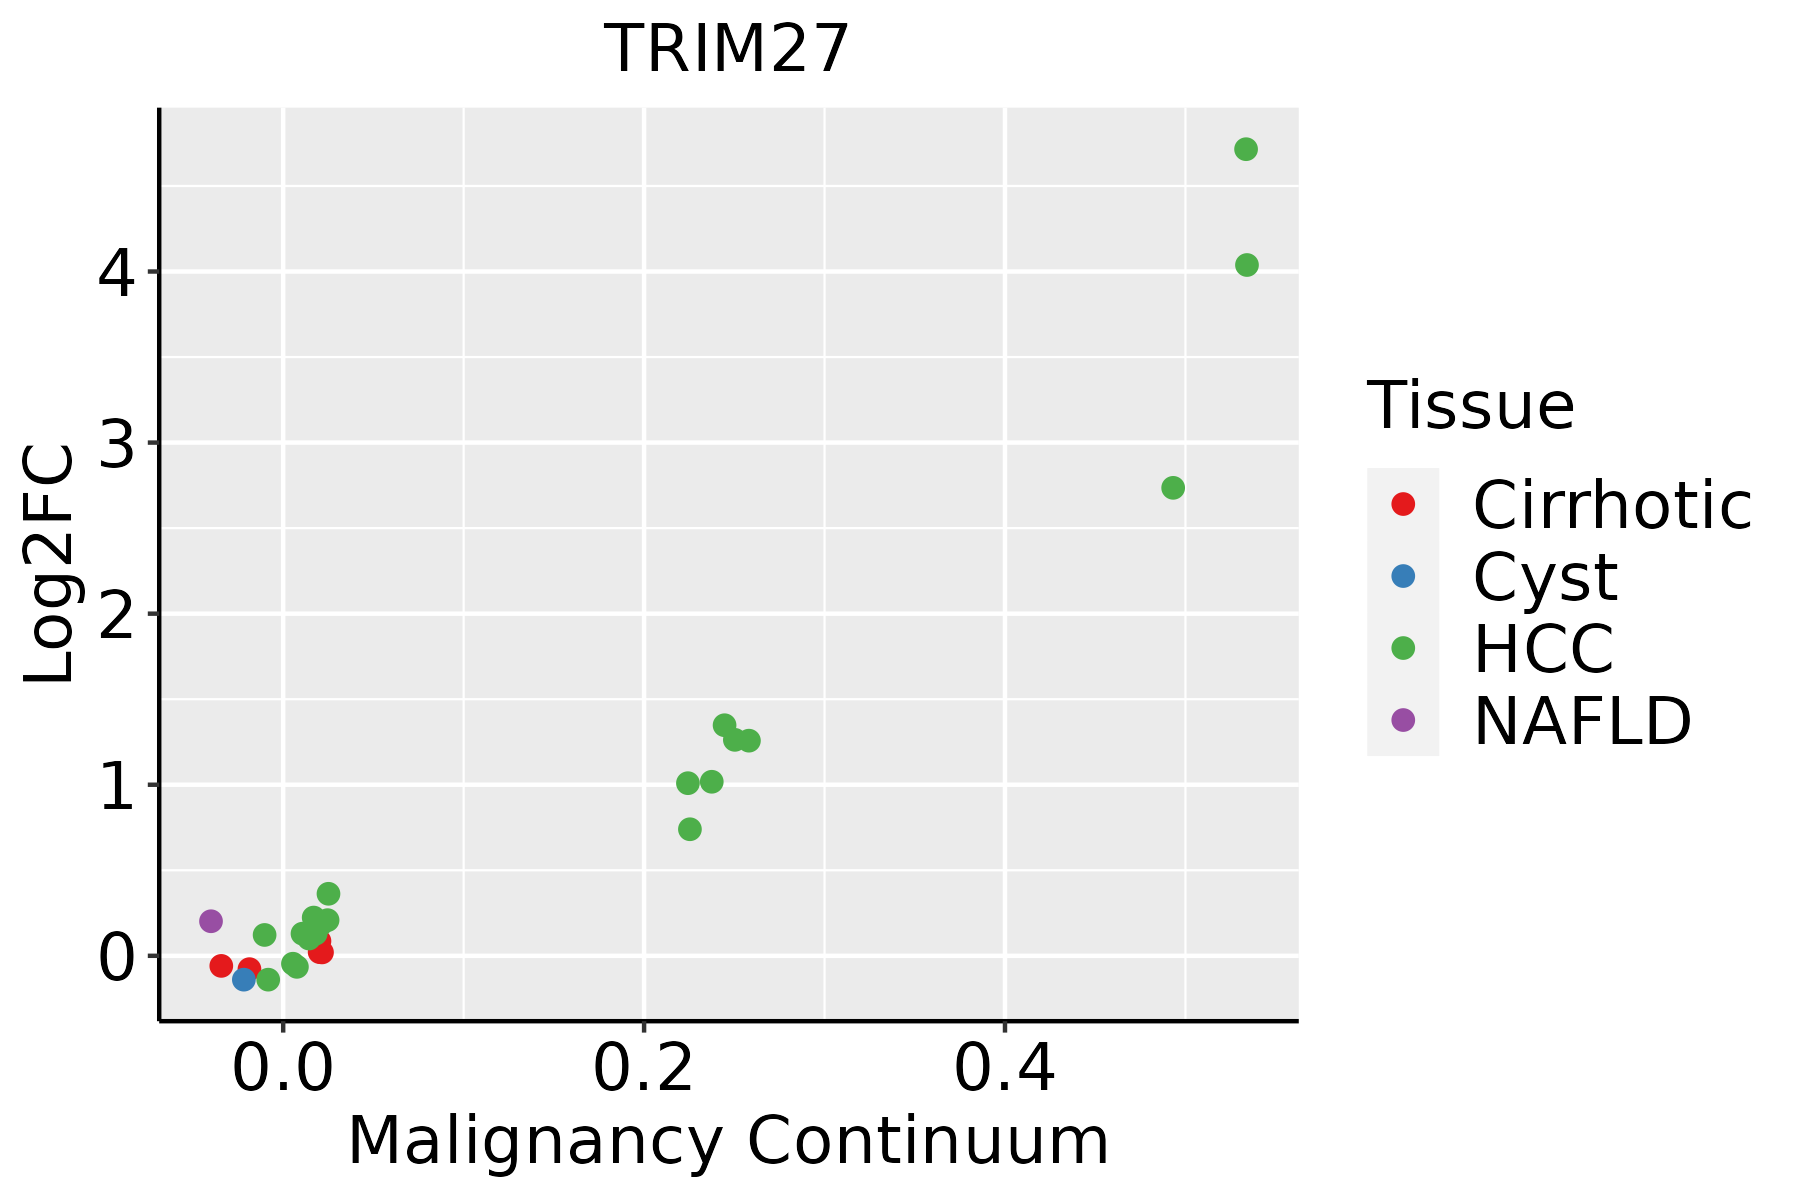 | HCC: Hepatocellular carcinoma |
| NAFLD: Non-alcoholic fatty liver disease | ||
| Oral Cavity |  | EOLP: Erosive Oral lichen planus |
| LP: leukoplakia | ||
| NEOLP: Non-erosive oral lichen planus | ||
| OSCC: Oral squamous cell carcinoma | ||
| Skin | 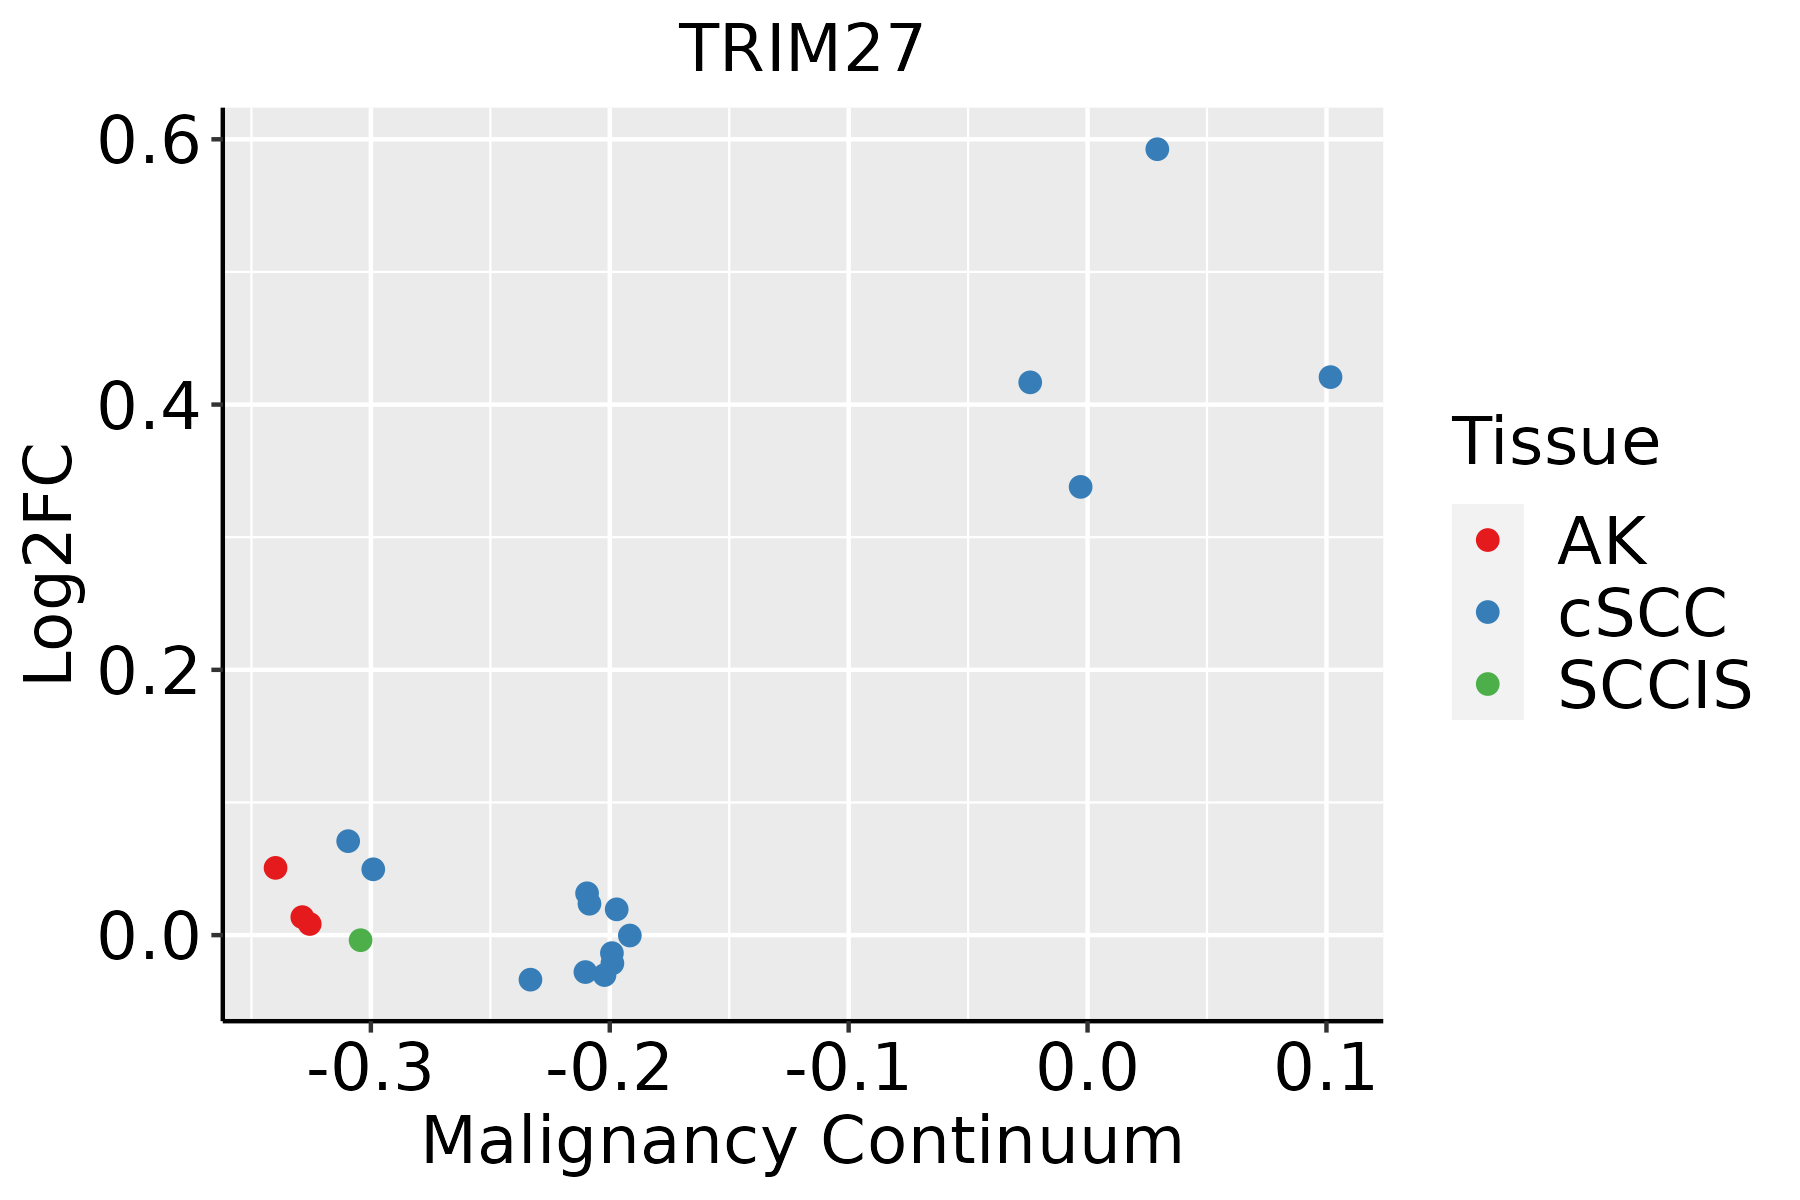 | AK: Actinic keratosis |
| cSCC: Cutaneous squamous cell carcinoma | ||
| SCCIS:squamous cell carcinoma in situ | ||
| Thyroid |  | ATC: Anaplastic thyroid cancer |
| HT: Hashimoto's thyroiditis | ||
| PTC: Papillary thyroid cancer |
| ∗log2FC in expression of this searched gene in stem-like cells from each diseased tissue sample relative to stem-like cells in normal samples in each tissue plotted against the malignancy continuum. Samples are colored based on if they are from different disease stage. |
Top |
Malignant transformation related pathway analysis |
| Find out the enriched GO biological processes and KEGG pathways involved in transition from healthy to precancer to cancer |
| Tissue | Disease Stage | Enriched GO biological Processes |
| Colorectum | AD |  |
| Colorectum | SER |  |
| Colorectum | MSS |  |
| Colorectum | MSI-H |  |
| Colorectum | FAP |  |
| ∗Top 15 enriched GO BP terms are showed in the bar plot of each disease state in each tissue. Each row represents a significant GO biological process which is colored according to the -log10(p.adjust). |
| Page: 1 2 3 4 5 6 7 8 9 |
| GO ID | Tissue | Disease Stage | Description | Gene Ratio | Bg Ratio | pvalue | p.adjust | Count |
| GO:0016032111 | Esophagus | ESCC | viral process | 301/8552 | 415/18723 | 3.34e-29 | 1.32e-26 | 301 |
| GO:0009896111 | Esophagus | ESCC | positive regulation of catabolic process | 332/8552 | 492/18723 | 4.36e-23 | 9.22e-21 | 332 |
| GO:0031331111 | Esophagus | ESCC | positive regulation of cellular catabolic process | 292/8552 | 427/18723 | 8.67e-22 | 1.53e-19 | 292 |
| GO:0019058111 | Esophagus | ESCC | viral life cycle | 226/8552 | 317/18723 | 1.17e-20 | 1.76e-18 | 226 |
| GO:001820514 | Esophagus | ESCC | peptidyl-lysine modification | 259/8552 | 376/18723 | 3.90e-20 | 5.26e-18 | 259 |
| GO:001050617 | Esophagus | ESCC | regulation of autophagy | 220/8552 | 317/18723 | 6.72e-18 | 6.36e-16 | 220 |
| GO:001619715 | Esophagus | ESCC | endosomal transport | 168/8552 | 230/18723 | 2.28e-17 | 1.93e-15 | 168 |
| GO:000020917 | Esophagus | ESCC | protein polyubiquitination | 170/8552 | 236/18723 | 1.40e-16 | 1.09e-14 | 170 |
| GO:0043254111 | Esophagus | ESCC | regulation of protein-containing complex assembly | 278/8552 | 428/18723 | 3.81e-16 | 2.77e-14 | 278 |
| GO:001908017 | Esophagus | ESCC | viral gene expression | 80/8552 | 94/18723 | 2.04e-15 | 1.28e-13 | 80 |
| GO:0031334111 | Esophagus | ESCC | positive regulation of protein-containing complex assembly | 166/8552 | 237/18723 | 2.06e-14 | 1.07e-12 | 166 |
| GO:001648210 | Esophagus | ESCC | cytosolic transport | 124/8552 | 168/18723 | 9.69e-14 | 4.69e-12 | 124 |
| GO:004312318 | Esophagus | ESCC | positive regulation of I-kappaB kinase/NF-kappaB signaling | 132/8552 | 186/18723 | 2.07e-12 | 8.58e-11 | 132 |
| GO:0050792111 | Esophagus | ESCC | regulation of viral process | 119/8552 | 164/18723 | 2.19e-12 | 9.03e-11 | 119 |
| GO:0010563111 | Esophagus | ESCC | negative regulation of phosphorus metabolic process | 274/8552 | 442/18723 | 2.32e-12 | 9.41e-11 | 274 |
| GO:0045936111 | Esophagus | ESCC | negative regulation of phosphate metabolic process | 273/8552 | 441/18723 | 3.18e-12 | 1.25e-10 | 273 |
| GO:0043122110 | Esophagus | ESCC | regulation of I-kappaB kinase/NF-kappaB signaling | 167/8552 | 249/18723 | 6.11e-12 | 2.32e-10 | 167 |
| GO:0051348111 | Esophagus | ESCC | negative regulation of transferase activity | 177/8552 | 268/18723 | 1.08e-11 | 4.00e-10 | 177 |
| GO:000724919 | Esophagus | ESCC | I-kappaB kinase/NF-kappaB signaling | 183/8552 | 281/18723 | 3.02e-11 | 1.01e-09 | 183 |
| GO:1902905111 | Esophagus | ESCC | positive regulation of supramolecular fiber organization | 142/8552 | 209/18723 | 5.51e-11 | 1.76e-09 | 142 |
| Page: 1 2 3 4 5 6 7 8 9 10 11 12 13 14 15 16 17 18 19 20 21 22 |
| Pathway ID | Tissue | Disease Stage | Description | Gene Ratio | Bg Ratio | pvalue | p.adjust | qvalue | Count |
| Page: 1 |
Top |
Cell-cell communication analysis |
| Identification of potential cell-cell interactions between two cell types and their ligand-receptor pairs for different disease states |
| Ligand | Receptor | LRpair | Pathway | Tissue | Disease Stage |
| Page: 1 |
Top |
Single-cell gene regulatory network inference analysis |
| Find out the significant the regulons (TFs) and the target genes of each regulon across cell types for different disease states |
| TF | Cell Type | Tissue | Disease Stage | Target Gene | RSS | Regulon Activity |
| ∗The dot plots of a searched regulon are shown for all cell subpopulations in each disease state of each tissue based on the regulon specific score inferred using pySCENIC and by calculating the average expression. |
| Page: 1 |
Top |
Somatic mutation of malignant transformation related genes |
| Annotation of somatic variants for genes involved in malignant transformation |
| Hugo Symbol | Variant Class | Variant Classification | dbSNP RS | HGVSc | HGVSp | HGVSp Short | SWISSPROT | BIOTYPE | SIFT | PolyPhen | Tumor Sample Barcode | Tissue | Histology | Sex | Age | Stage | Therapy Types | Drugs | Outcome |
| TRIM27 | SNV | Missense_Mutation | rs758081594 | c.911N>G | p.Lys304Arg | p.K304R | P14373 | protein_coding | tolerated(0.33) | benign(0) | TCGA-BH-A18G-01 | Breast | breast invasive carcinoma | Female | >=65 | I/II | Unknown | Unknown | SD |
| TRIM27 | SNV | Missense_Mutation | novel | c.373C>T | p.Arg125Cys | p.R125C | P14373 | protein_coding | deleterious(0) | probably_damaging(0.916) | TCGA-E2-A2P6-01 | Breast | breast invasive carcinoma | Female | >=65 | I/II | Hormone Therapy | anastrozole | SD |
| TRIM27 | SNV | Missense_Mutation | rs746324365 | c.596G>A | p.Arg199His | p.R199H | P14373 | protein_coding | tolerated(0.41) | possibly_damaging(0.641) | TCGA-2W-A8YY-01 | Cervix | cervical & endocervical cancer | Female | <65 | I/II | Chemotherapy | cisplatin | CR |
| TRIM27 | SNV | Missense_Mutation | rs761449235 | c.461A>G | p.Lys154Arg | p.K154R | P14373 | protein_coding | tolerated(0.76) | benign(0.007) | TCGA-2W-A8YY-01 | Cervix | cervical & endocervical cancer | Female | <65 | I/II | Chemotherapy | cisplatin | CR |
| TRIM27 | SNV | Missense_Mutation | novel | c.455N>C | p.Arg152Thr | p.R152T | P14373 | protein_coding | tolerated(0.07) | benign(0.134) | TCGA-5M-AAT4-01 | Colorectum | colon adenocarcinoma | Male | >=65 | III/IV | Unknown | Unknown | PD |
| TRIM27 | SNV | Missense_Mutation | c.884N>T | p.Thr295Ile | p.T295I | P14373 | protein_coding | tolerated(0.52) | benign(0) | TCGA-A6-2686-01 | Colorectum | colon adenocarcinoma | Female | >=65 | I/II | Unknown | Unknown | SD | |
| TRIM27 | SNV | Missense_Mutation | rs763531927 | c.481N>T | p.Arg161Trp | p.R161W | P14373 | protein_coding | deleterious(0.01) | possibly_damaging(0.798) | TCGA-EI-6917-01 | Colorectum | rectum adenocarcinoma | Male | <65 | III/IV | Chemotherapy | 5fluorouracil+oxaciplatina+l-folinian | SD |
| TRIM27 | SNV | Missense_Mutation | c.134G>A | p.Gly45Asp | p.G45D | P14373 | protein_coding | tolerated(0.4) | possibly_damaging(0.604) | TCGA-F5-6814-01 | Colorectum | rectum adenocarcinoma | Male | <65 | I/II | Unknown | Unknown | SD | |
| TRIM27 | SNV | Missense_Mutation | c.1505T>C | p.Val502Ala | p.V502A | P14373 | protein_coding | tolerated_low_confidence(0.12) | benign(0.246) | TCGA-A5-A0G9-01 | Endometrium | uterine corpus endometrioid carcinoma | Female | >=65 | I/II | Unknown | Unknown | SD | |
| TRIM27 | SNV | Missense_Mutation | novel | c.1436N>T | p.Ser479Leu | p.S479L | P14373 | protein_coding | tolerated(0.39) | possibly_damaging(0.695) | TCGA-A5-A2K5-01 | Endometrium | uterine corpus endometrioid carcinoma | Female | >=65 | I/II | Unknown | Unknown | SD |
| Page: 1 2 3 4 5 |
Top |
Related drugs of malignant transformation related genes |
| Identification of chemicals and drugs interact with genes involved in malignant transfromation |
| (DGIdb 4.0) |
| Entrez ID | Symbol | Category | Interaction Types | Drug Claim Name | Drug Name | PMIDs |
| Page: 1 |

Copyright 2023-Present -The University of Texas Health Science Center at Houston |