
|
|||||
|
 | |
| |
| |
| |
| |
| |
|
Gene: TRIM24 |
Gene summary for TRIM24 |
| Gene information | Species | Human | Gene symbol | TRIM24 | Gene ID | 8805 |
| Gene name | tripartite motif containing 24 | |
| Gene Alias | PTC6 | |
| Cytomap | 7q33-q34 | |
| Gene Type | protein-coding | GO ID | GO:0006139 | UniProtAcc | A0A024R784 |
Top |
Malignant transformation analysis |
| Identification of the aberrant gene expression in precancerous and cancerous lesions by comparing the gene expression of stem-like cells in diseased tissues with normal stem cells |
| Entrez ID | Symbol | Replicates | Species | Organ | Tissue | Adj P-value | Log2FC | Malignancy |
| 8805 | TRIM24 | EEC-subject1 | Human | Endometrium | EEC | 3.23e-06 | 3.15e-01 | -0.2682 |
| 8805 | TRIM24 | EEC-subject3 | Human | Endometrium | EEC | 3.82e-02 | 2.54e-03 | -0.2525 |
| 8805 | TRIM24 | GSM6177620_NYU_UCEC1_lib1_lib1 | Human | Endometrium | EEC | 3.95e-05 | 9.86e-03 | -0.1869 |
| 8805 | TRIM24 | GSM6177620_NYU_UCEC1_lib2_lib2 | Human | Endometrium | EEC | 3.05e-05 | 3.31e-02 | -0.1875 |
| 8805 | TRIM24 | GSM6177620_NYU_UCEC1_lib3_lib3 | Human | Endometrium | EEC | 3.43e-08 | -4.89e-02 | -0.1883 |
| 8805 | TRIM24 | GSM6177621_NYU_UCEC2_lib1_lib1 | Human | Endometrium | EEC | 4.59e-05 | -1.12e-02 | -0.1934 |
| 8805 | TRIM24 | GSM6177622_NYU_UCEC3_lib1_lib1 | Human | Endometrium | EEC | 1.49e-06 | -4.29e-02 | -0.1917 |
| 8805 | TRIM24 | GSM6177622_NYU_UCEC3_lib2_lib2 | Human | Endometrium | EEC | 2.96e-11 | 2.24e-03 | -0.1916 |
| 8805 | TRIM24 | LZE7T | Human | Esophagus | ESCC | 1.34e-06 | 3.12e-01 | 0.0667 |
| 8805 | TRIM24 | LZE20T | Human | Esophagus | ESCC | 7.29e-04 | 1.09e-01 | 0.0662 |
| 8805 | TRIM24 | LZE24T | Human | Esophagus | ESCC | 1.73e-05 | 2.36e-01 | 0.0596 |
| 8805 | TRIM24 | P2T-E | Human | Esophagus | ESCC | 7.12e-13 | 1.14e-01 | 0.1177 |
| 8805 | TRIM24 | P4T-E | Human | Esophagus | ESCC | 3.80e-14 | 3.02e-01 | 0.1323 |
| 8805 | TRIM24 | P5T-E | Human | Esophagus | ESCC | 8.46e-12 | 2.81e-01 | 0.1327 |
| 8805 | TRIM24 | P8T-E | Human | Esophagus | ESCC | 2.04e-22 | 3.55e-01 | 0.0889 |
| 8805 | TRIM24 | P9T-E | Human | Esophagus | ESCC | 3.83e-15 | 3.80e-01 | 0.1131 |
| 8805 | TRIM24 | P10T-E | Human | Esophagus | ESCC | 1.13e-16 | 2.61e-01 | 0.116 |
| 8805 | TRIM24 | P11T-E | Human | Esophagus | ESCC | 5.45e-05 | 1.22e-01 | 0.1426 |
| 8805 | TRIM24 | P12T-E | Human | Esophagus | ESCC | 3.36e-29 | 4.87e-01 | 0.1122 |
| 8805 | TRIM24 | P15T-E | Human | Esophagus | ESCC | 4.58e-17 | 3.97e-01 | 0.1149 |
| Page: 1 2 3 4 5 |
| Tissue | Expression Dynamics | Abbreviation |
| Endometrium | 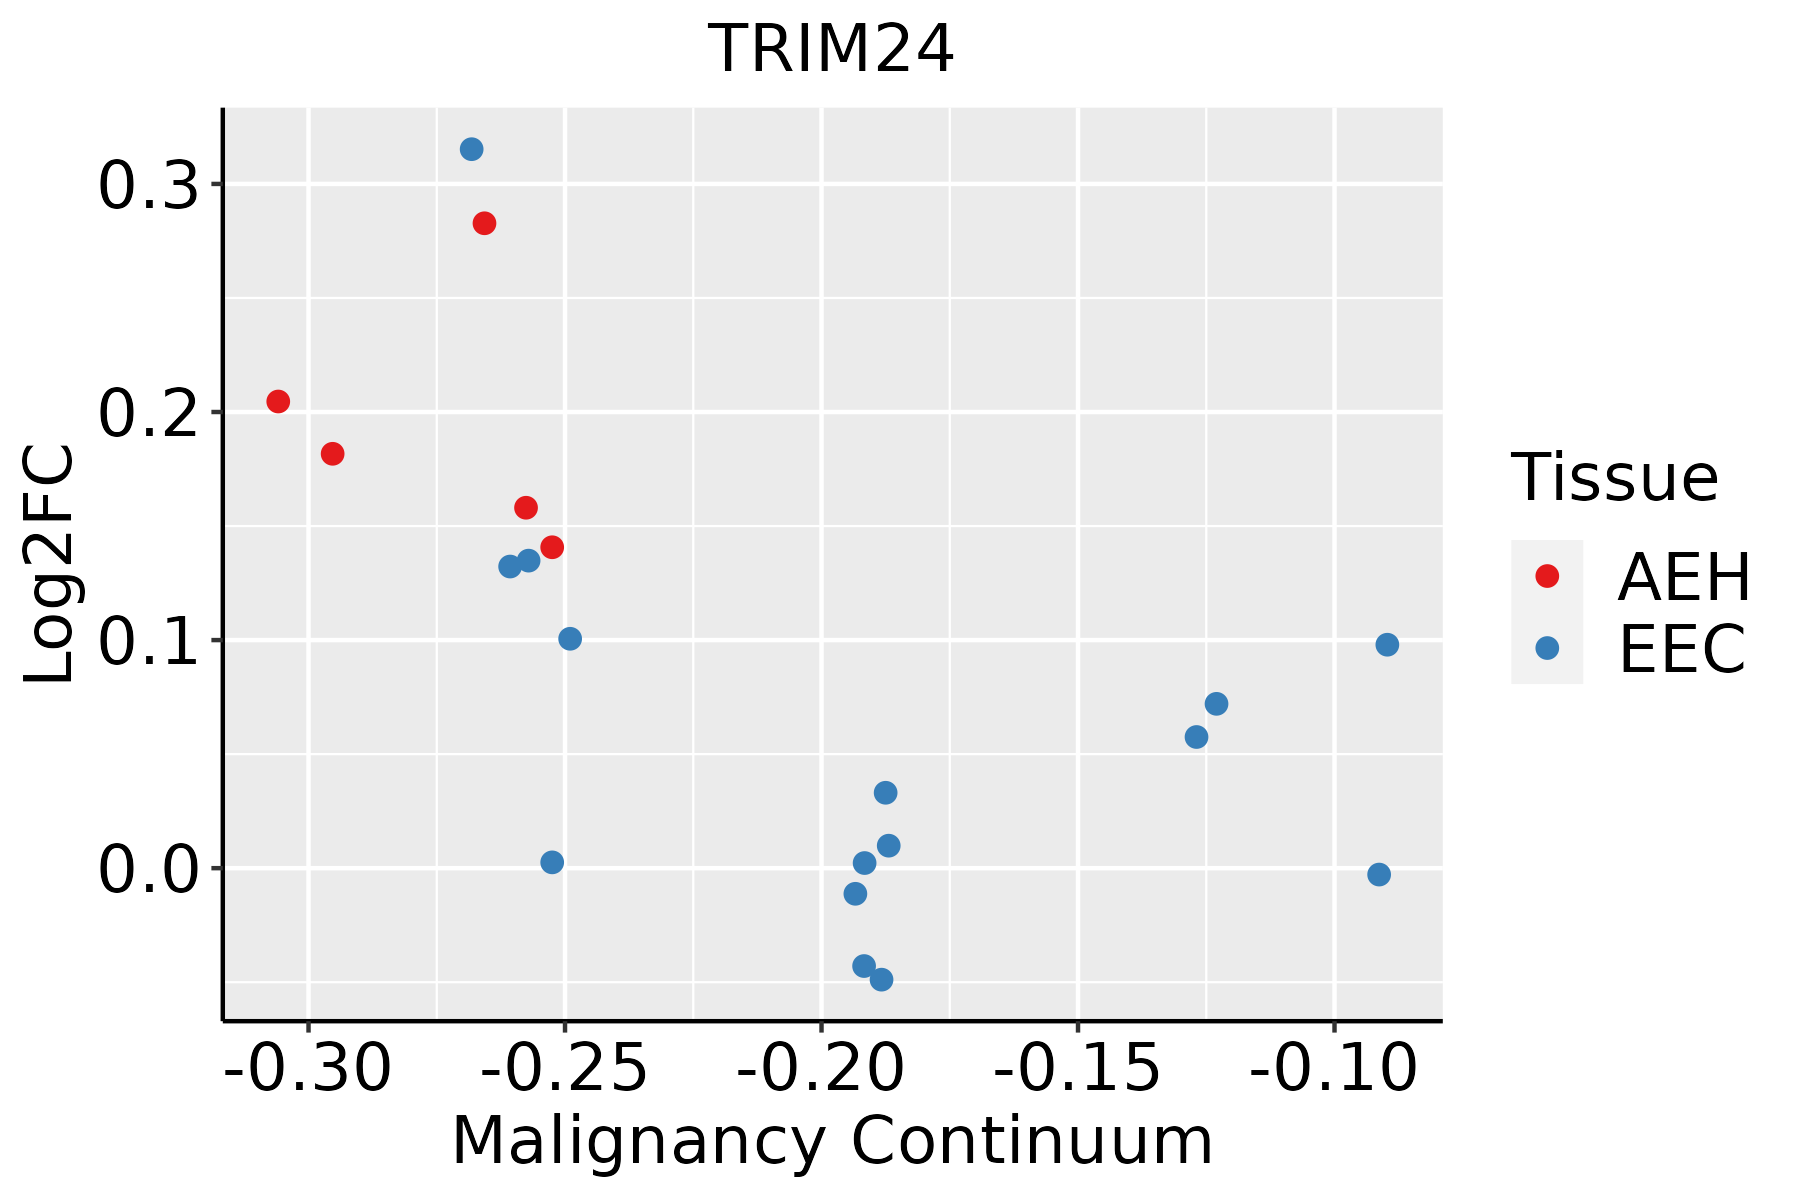 | AEH: Atypical endometrial hyperplasia |
| EEC: Endometrioid Cancer | ||
| Esophagus | 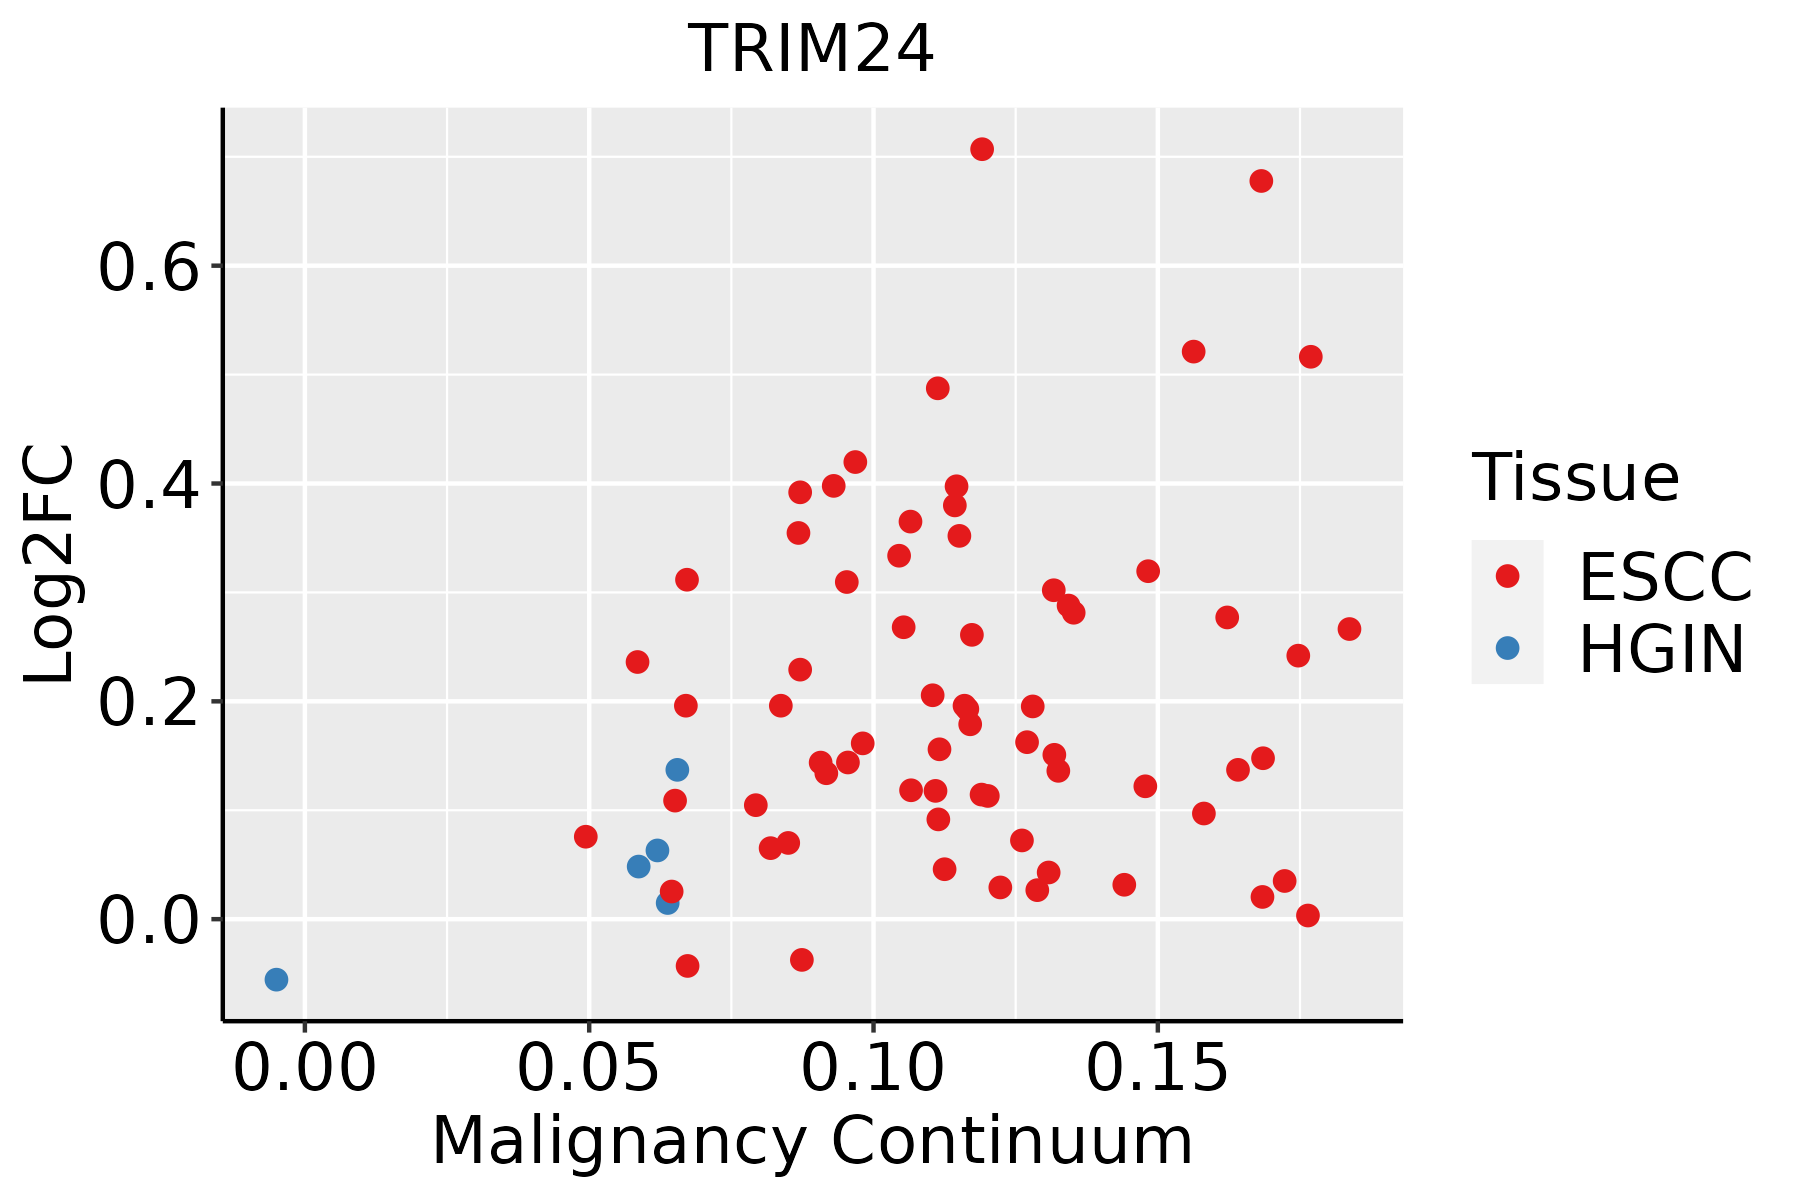 | ESCC: Esophageal squamous cell carcinoma |
| HGIN: High-grade intraepithelial neoplasias | ||
| LGIN: Low-grade intraepithelial neoplasias | ||
| Liver | 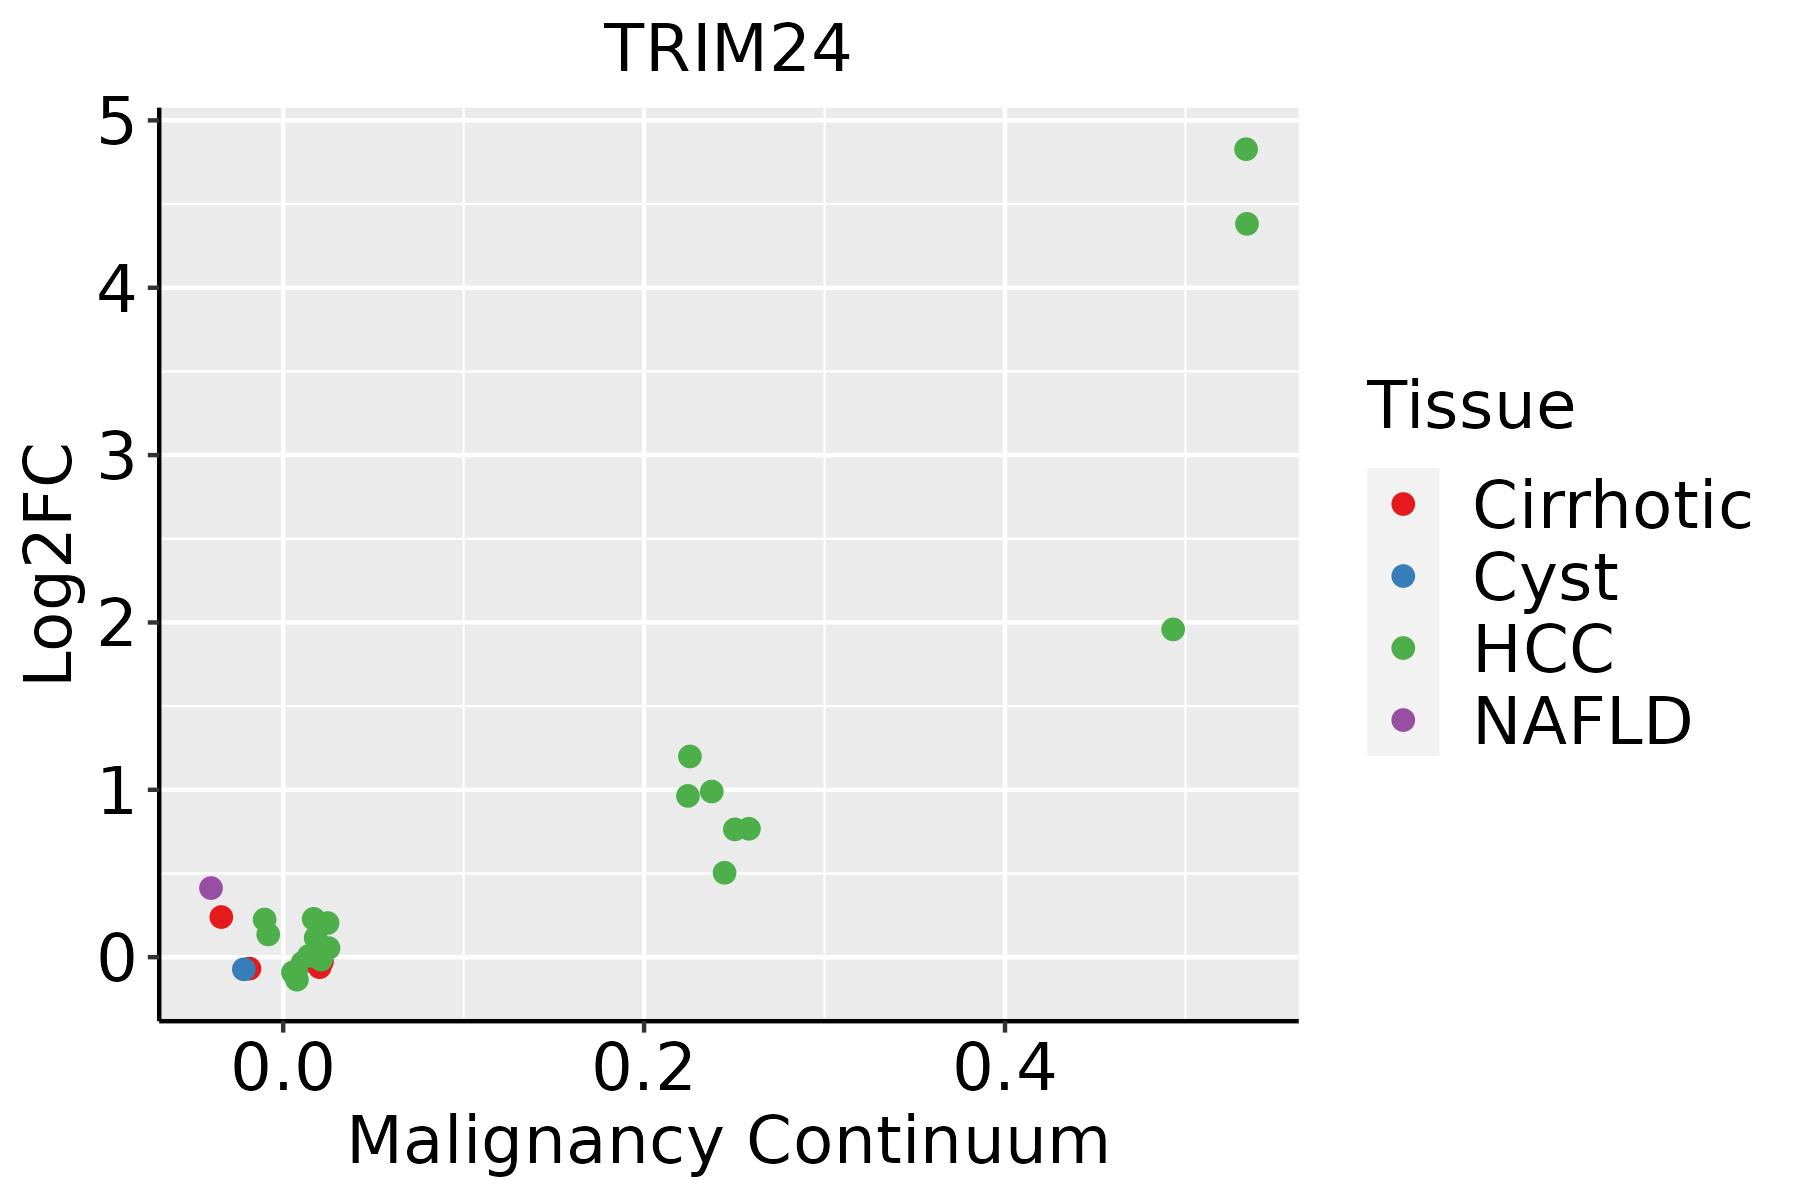 | HCC: Hepatocellular carcinoma |
| NAFLD: Non-alcoholic fatty liver disease | ||
| Lung | 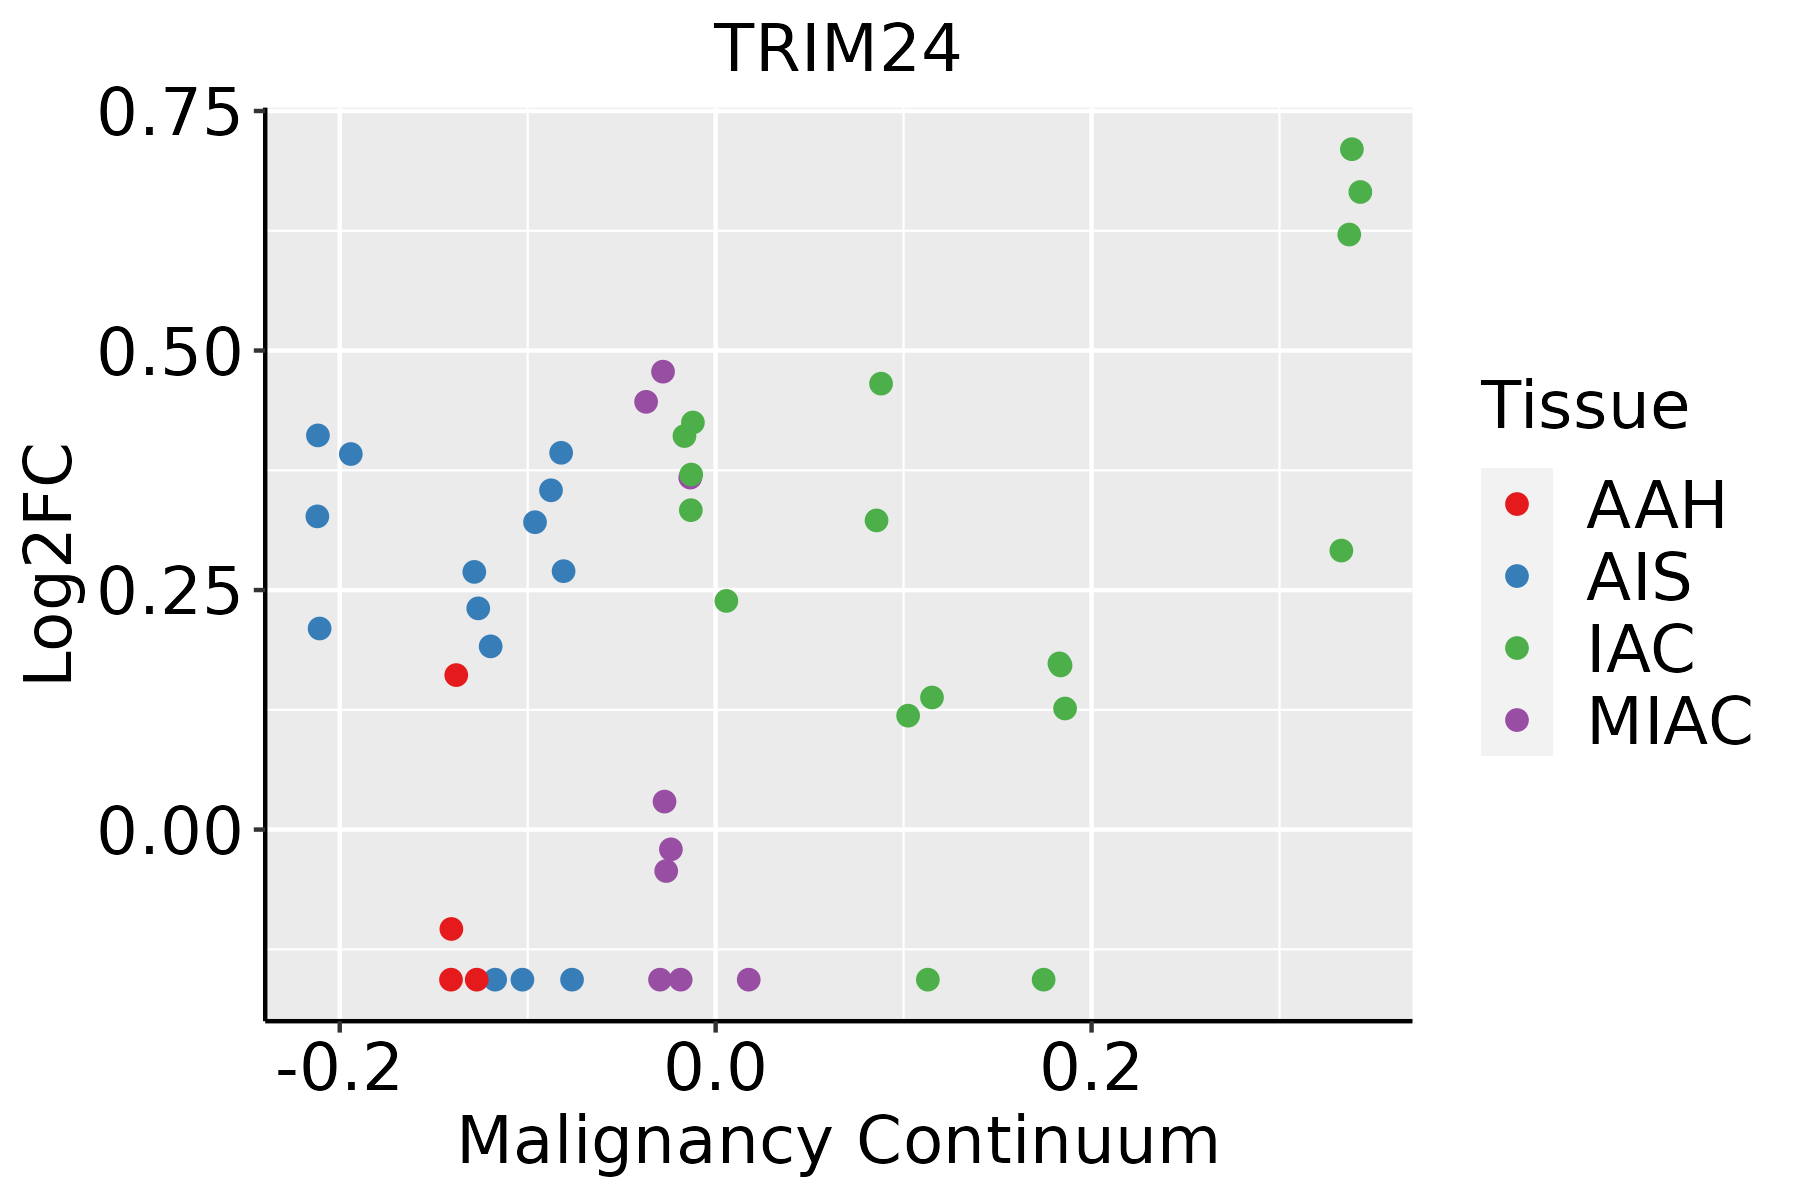 | AAH: Atypical adenomatous hyperplasia |
| AIS: Adenocarcinoma in situ | ||
| IAC: Invasive lung adenocarcinoma | ||
| MIA: Minimally invasive adenocarcinoma | ||
| Thyroid | 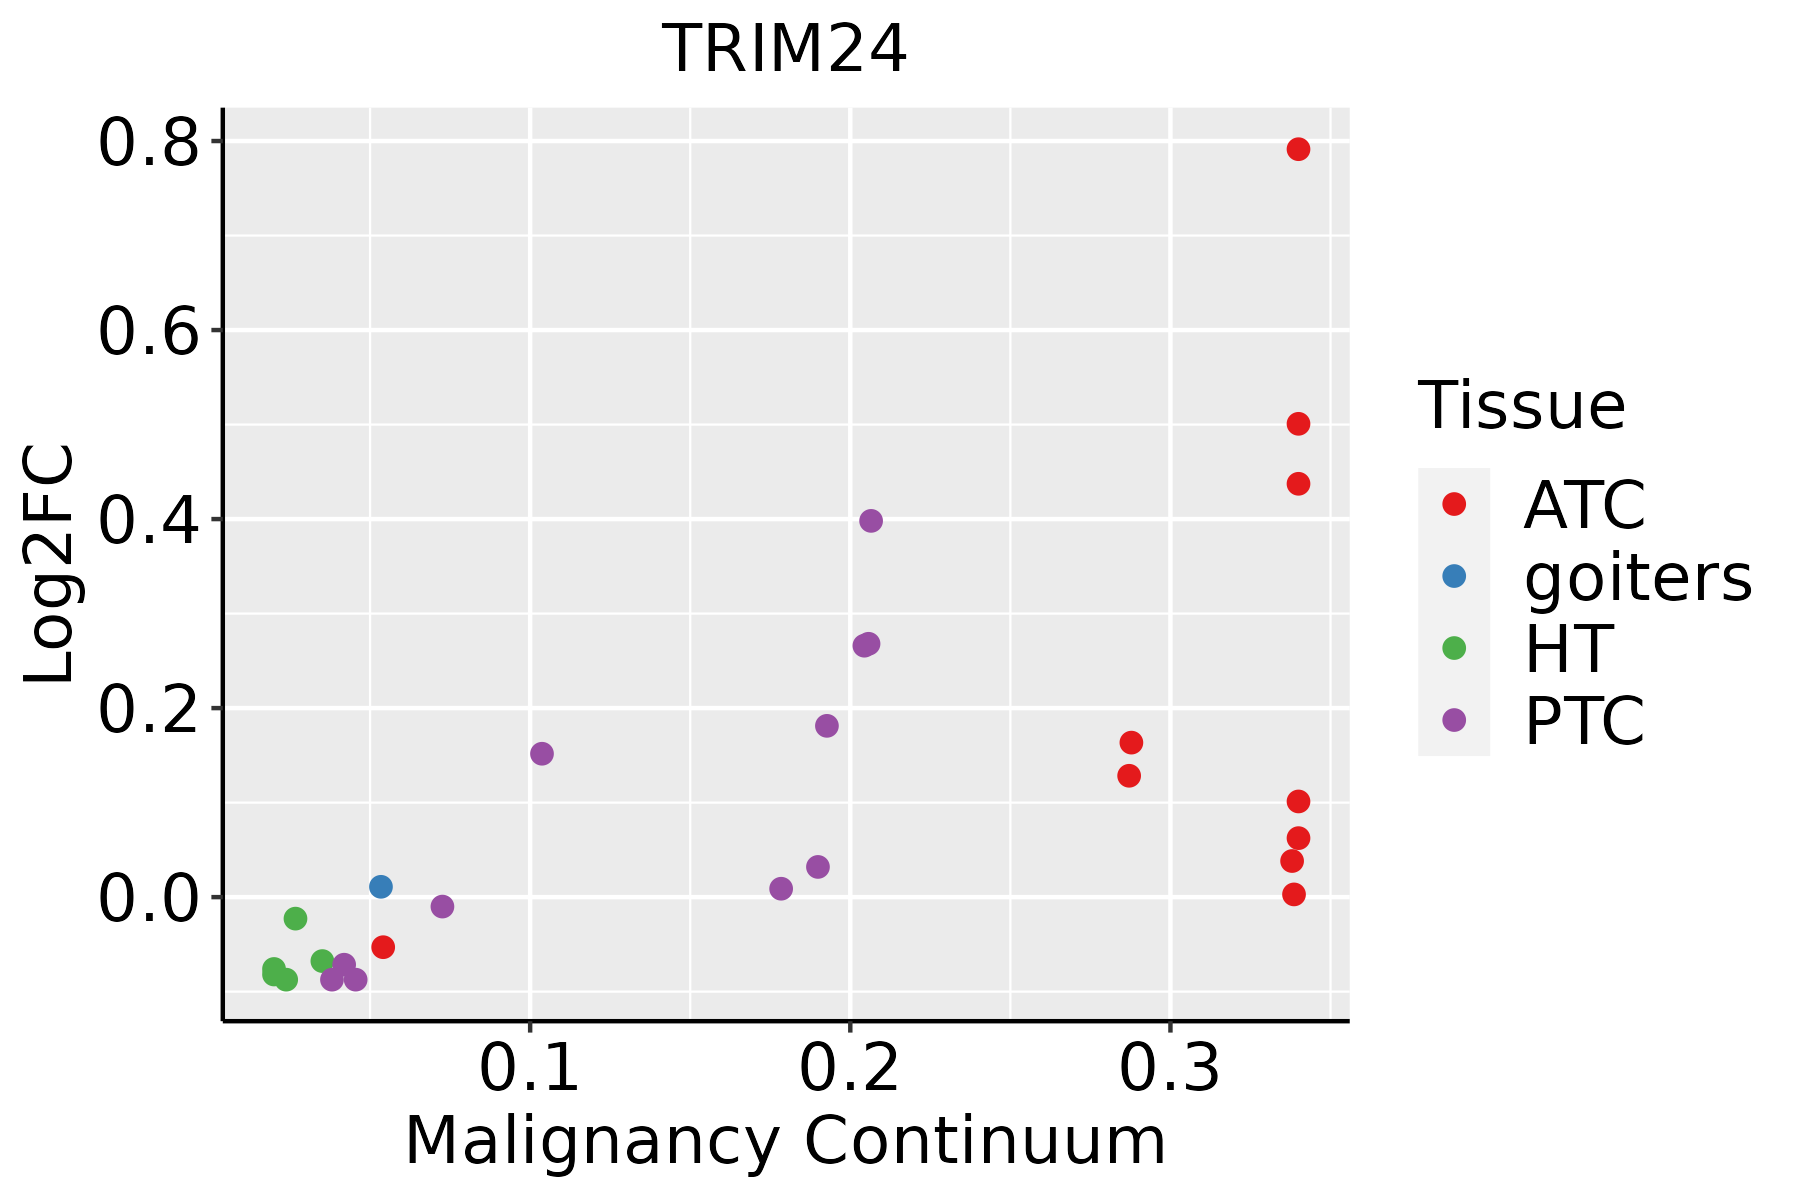 | ATC: Anaplastic thyroid cancer |
| HT: Hashimoto's thyroiditis | ||
| PTC: Papillary thyroid cancer |
| ∗log2FC in expression of this searched gene in stem-like cells from each diseased tissue sample relative to stem-like cells in normal samples in each tissue plotted against the malignancy continuum. Samples are colored based on if they are from different disease stage. |
Top |
Malignant transformation related pathway analysis |
| Find out the enriched GO biological processes and KEGG pathways involved in transition from healthy to precancer to cancer |
| Tissue | Disease Stage | Enriched GO biological Processes |
| Colorectum | AD |  |
| Colorectum | SER |  |
| Colorectum | MSS |  |
| Colorectum | MSI-H |  |
| Colorectum | FAP |  |
| ∗Top 15 enriched GO BP terms are showed in the bar plot of each disease state in each tissue. Each row represents a significant GO biological process which is colored according to the -log10(p.adjust). |
| Page: 1 2 3 4 5 6 7 8 9 |
| GO ID | Tissue | Disease Stage | Description | Gene Ratio | Bg Ratio | pvalue | p.adjust | Count |
| GO:003164717 | Endometrium | EEC | regulation of protein stability | 80/2168 | 298/18723 | 2.48e-13 | 5.96e-11 | 80 |
| GO:003052215 | Endometrium | EEC | intracellular receptor signaling pathway | 65/2168 | 265/18723 | 2.52e-09 | 1.96e-07 | 65 |
| GO:190179617 | Endometrium | EEC | regulation of signal transduction by p53 class mediator | 27/2168 | 93/18723 | 4.07e-06 | 1.06e-04 | 27 |
| GO:007233117 | Endometrium | EEC | signal transduction by p53 class mediator | 39/2168 | 163/18723 | 7.00e-06 | 1.63e-04 | 39 |
| GO:007149617 | Endometrium | EEC | cellular response to external stimulus | 61/2168 | 320/18723 | 5.76e-05 | 8.97e-04 | 61 |
| GO:003166717 | Endometrium | EEC | response to nutrient levels | 82/2168 | 474/18723 | 1.23e-04 | 1.64e-03 | 82 |
| GO:003166916 | Endometrium | EEC | cellular response to nutrient levels | 41/2168 | 215/18723 | 8.72e-04 | 7.97e-03 | 41 |
| GO:003166816 | Endometrium | EEC | cellular response to extracellular stimulus | 45/2168 | 246/18723 | 1.24e-03 | 1.03e-02 | 45 |
| GO:00075847 | Endometrium | EEC | response to nutrient | 32/2168 | 174/18723 | 5.35e-03 | 3.31e-02 | 32 |
| GO:00467777 | Endometrium | EEC | protein autophosphorylation | 39/2168 | 227/18723 | 7.52e-03 | 4.21e-02 | 39 |
| GO:0031647111 | Esophagus | ESCC | regulation of protein stability | 223/8552 | 298/18723 | 5.76e-25 | 1.52e-22 | 223 |
| GO:0071496111 | Esophagus | ESCC | cellular response to external stimulus | 215/8552 | 320/18723 | 4.29e-15 | 2.43e-13 | 215 |
| GO:0072331111 | Esophagus | ESCC | signal transduction by p53 class mediator | 121/8552 | 163/18723 | 9.61e-14 | 4.69e-12 | 121 |
| GO:0031668111 | Esophagus | ESCC | cellular response to extracellular stimulus | 168/8552 | 246/18723 | 4.93e-13 | 2.23e-11 | 168 |
| GO:0031669110 | Esophagus | ESCC | cellular response to nutrient levels | 148/8552 | 215/18723 | 4.58e-12 | 1.76e-10 | 148 |
| GO:0031667111 | Esophagus | ESCC | response to nutrient levels | 289/8552 | 474/18723 | 9.25e-12 | 3.47e-10 | 289 |
| GO:0030522110 | Esophagus | ESCC | intracellular receptor signaling pathway | 170/8552 | 265/18723 | 8.58e-10 | 2.09e-08 | 170 |
| GO:1901796111 | Esophagus | ESCC | regulation of signal transduction by p53 class mediator | 70/8552 | 93/18723 | 5.69e-09 | 1.18e-07 | 70 |
| GO:000758410 | Esophagus | ESCC | response to nutrient | 114/8552 | 174/18723 | 9.43e-08 | 1.56e-06 | 114 |
| GO:004677710 | Esophagus | ESCC | protein autophosphorylation | 138/8552 | 227/18723 | 2.98e-06 | 3.38e-05 | 138 |
| Page: 1 2 3 4 5 |
| Pathway ID | Tissue | Disease Stage | Description | Gene Ratio | Bg Ratio | pvalue | p.adjust | qvalue | Count |
| Page: 1 |
Top |
Cell-cell communication analysis |
| Identification of potential cell-cell interactions between two cell types and their ligand-receptor pairs for different disease states |
| Ligand | Receptor | LRpair | Pathway | Tissue | Disease Stage |
| Page: 1 |
Top |
Single-cell gene regulatory network inference analysis |
| Find out the significant the regulons (TFs) and the target genes of each regulon across cell types for different disease states |
| TF | Cell Type | Tissue | Disease Stage | Target Gene | RSS | Regulon Activity |
| ∗The dot plots of a searched regulon are shown for all cell subpopulations in each disease state of each tissue based on the regulon specific score inferred using pySCENIC and by calculating the average expression. |
| Page: 1 |
Top |
Somatic mutation of malignant transformation related genes |
| Annotation of somatic variants for genes involved in malignant transformation |
| Hugo Symbol | Variant Class | Variant Classification | dbSNP RS | HGVSc | HGVSp | HGVSp Short | SWISSPROT | BIOTYPE | SIFT | PolyPhen | Tumor Sample Barcode | Tissue | Histology | Sex | Age | Stage | Therapy Types | Drugs | Outcome |
| TRIM24 | SNV | Missense_Mutation | c.1598N>A | p.Pro533His | p.P533H | O15164 | protein_coding | tolerated(0.1) | possibly_damaging(0.459) | TCGA-AO-A128-01 | Breast | breast invasive carcinoma | Female | <65 | I/II | Chemotherapy | doxorubicin | SD | |
| TRIM24 | SNV | Missense_Mutation | c.404N>G | p.Ala135Gly | p.A135G | O15164 | protein_coding | tolerated(0.08) | benign(0.001) | TCGA-BH-A0AY-01 | Breast | breast invasive carcinoma | Female | <65 | I/II | Chemotherapy | SD | ||
| TRIM24 | SNV | Missense_Mutation | novel | c.3001N>G | p.Leu1001Val | p.L1001V | O15164 | protein_coding | deleterious(0) | probably_damaging(0.993) | TCGA-BH-A0B6-01 | Breast | breast invasive carcinoma | Female | <65 | I/II | Unknown | Unknown | SD |
| TRIM24 | SNV | Missense_Mutation | rs780616900 | c.3127A>G | p.Ile1043Val | p.I1043V | O15164 | protein_coding | tolerated(0.54) | benign(0) | TCGA-D8-A1J8-01 | Breast | breast invasive carcinoma | Female | >=65 | I/II | Hormone Therapy | nolvadex | SD |
| TRIM24 | SNV | Missense_Mutation | c.794A>T | p.Asn265Ile | p.N265I | O15164 | protein_coding | deleterious(0) | benign(0.007) | TCGA-D8-A1XK-01 | Breast | breast invasive carcinoma | Female | <65 | I/II | Chemotherapy | doxorubicine+cyclophosphamide | SD | |
| TRIM24 | SNV | Missense_Mutation | c.2503G>A | p.Gly835Arg | p.G835R | O15164 | protein_coding | deleterious(0) | probably_damaging(1) | TCGA-E2-A14Q-01 | Breast | breast invasive carcinoma | Female | <65 | I/II | Hormone Therapy | tamoxiphen | SD | |
| TRIM24 | SNV | Missense_Mutation | novel | c.2005N>T | p.Gly669Cys | p.G669C | O15164 | protein_coding | deleterious(0) | probably_damaging(0.921) | TCGA-S3-AA10-01 | Breast | breast invasive carcinoma | Female | >=65 | I/II | Chemotherapy | cytoxan | CR |
| TRIM24 | insertion | In_Frame_Ins | novel | c.1388_1389insGGGCTTATTTAGGGAACTTACATA | p.Ile463delinsMetGlyLeuPheArgGluLeuThrTyr | p.I463delinsMGLFRELTY | O15164 | protein_coding | TCGA-BH-A0AY-01 | Breast | breast invasive carcinoma | Female | <65 | I/II | Chemotherapy | SD | |||
| TRIM24 | insertion | Frame_Shift_Ins | novel | c.2004_2005insCC | p.Gly669ProfsTer9 | p.G669Pfs*9 | O15164 | protein_coding | TCGA-S3-AA10-01 | Breast | breast invasive carcinoma | Female | >=65 | I/II | Chemotherapy | cytoxan | CR | ||
| TRIM24 | SNV | Missense_Mutation | novel | c.1632N>C | p.Gln544His | p.Q544H | O15164 | protein_coding | tolerated(0.11) | probably_damaging(0.986) | TCGA-EA-A3HU-01 | Cervix | cervical & endocervical cancer | Female | <65 | I/II | Unknown | Unknown | SD |
| Page: 1 2 3 4 5 6 7 8 9 10 |
Top |
Related drugs of malignant transformation related genes |
| Identification of chemicals and drugs interact with genes involved in malignant transfromation |
| (DGIdb 4.0) |
| Entrez ID | Symbol | Category | Interaction Types | Drug Claim Name | Drug Name | PMIDs |
| 8805 | TRIM24 | ENZYME, NUCLEAR HORMONE RECEPTOR, CLINICALLY ACTIONABLE | 387065618 | |||
| 8805 | TRIM24 | ENZYME, NUCLEAR HORMONE RECEPTOR, CLINICALLY ACTIONABLE | inhibitor | 252166607 |
| Page: 1 |

Copyright 2023-Present -The University of Texas Health Science Center at Houston |