
|
|||||
|
 | |
| |
| |
| |
| |
| |
|
Gene: TRIM22 |
Gene summary for TRIM22 |
| Gene information | Species | Human | Gene symbol | TRIM22 | Gene ID | 10346 |
| Gene name | tripartite motif containing 22 | |
| Gene Alias | GPSTAF50 | |
| Cytomap | 11p15.4 | |
| Gene Type | protein-coding | GO ID | GO:0000209 | UniProtAcc | B4DQS5 |
Top |
Malignant transformation analysis |
| Identification of the aberrant gene expression in precancerous and cancerous lesions by comparing the gene expression of stem-like cells in diseased tissues with normal stem cells |
| Entrez ID | Symbol | Replicates | Species | Organ | Tissue | Adj P-value | Log2FC | Malignancy |
| 10346 | TRIM22 | LZE5T | Human | Esophagus | ESCC | 3.11e-02 | 2.76e-01 | 0.0514 |
| 10346 | TRIM22 | LZE8T | Human | Esophagus | ESCC | 4.44e-06 | 5.41e-02 | 0.067 |
| 10346 | TRIM22 | LZE20T | Human | Esophagus | ESCC | 4.53e-04 | 7.90e-02 | 0.0662 |
| 10346 | TRIM22 | LZE24T | Human | Esophagus | ESCC | 6.53e-16 | 5.34e-01 | 0.0596 |
| 10346 | TRIM22 | P2T-E | Human | Esophagus | ESCC | 6.48e-31 | 5.86e-01 | 0.1177 |
| 10346 | TRIM22 | P4T-E | Human | Esophagus | ESCC | 3.91e-02 | -1.27e-01 | 0.1323 |
| 10346 | TRIM22 | P5T-E | Human | Esophagus | ESCC | 2.29e-04 | 1.63e-02 | 0.1327 |
| 10346 | TRIM22 | P8T-E | Human | Esophagus | ESCC | 1.21e-17 | 1.96e-01 | 0.0889 |
| 10346 | TRIM22 | P9T-E | Human | Esophagus | ESCC | 1.01e-30 | 8.03e-01 | 0.1131 |
| 10346 | TRIM22 | P10T-E | Human | Esophagus | ESCC | 2.16e-03 | -2.10e-01 | 0.116 |
| 10346 | TRIM22 | P11T-E | Human | Esophagus | ESCC | 2.13e-26 | 1.20e+00 | 0.1426 |
| 10346 | TRIM22 | P12T-E | Human | Esophagus | ESCC | 4.85e-06 | -1.07e-01 | 0.1122 |
| 10346 | TRIM22 | P16T-E | Human | Esophagus | ESCC | 1.46e-04 | -1.24e-01 | 0.1153 |
| 10346 | TRIM22 | P17T-E | Human | Esophagus | ESCC | 1.41e-15 | 7.74e-01 | 0.1278 |
| 10346 | TRIM22 | P21T-E | Human | Esophagus | ESCC | 1.43e-05 | 2.67e-01 | 0.1617 |
| 10346 | TRIM22 | P22T-E | Human | Esophagus | ESCC | 1.53e-09 | -4.10e-02 | 0.1236 |
| 10346 | TRIM22 | P23T-E | Human | Esophagus | ESCC | 4.47e-07 | 2.58e-01 | 0.108 |
| 10346 | TRIM22 | P24T-E | Human | Esophagus | ESCC | 1.13e-26 | 7.57e-01 | 0.1287 |
| 10346 | TRIM22 | P26T-E | Human | Esophagus | ESCC | 2.48e-04 | -1.51e-01 | 0.1276 |
| 10346 | TRIM22 | P27T-E | Human | Esophagus | ESCC | 1.89e-14 | 7.27e-02 | 0.1055 |
| Page: 1 2 3 4 |
| Tissue | Expression Dynamics | Abbreviation |
| Esophagus | 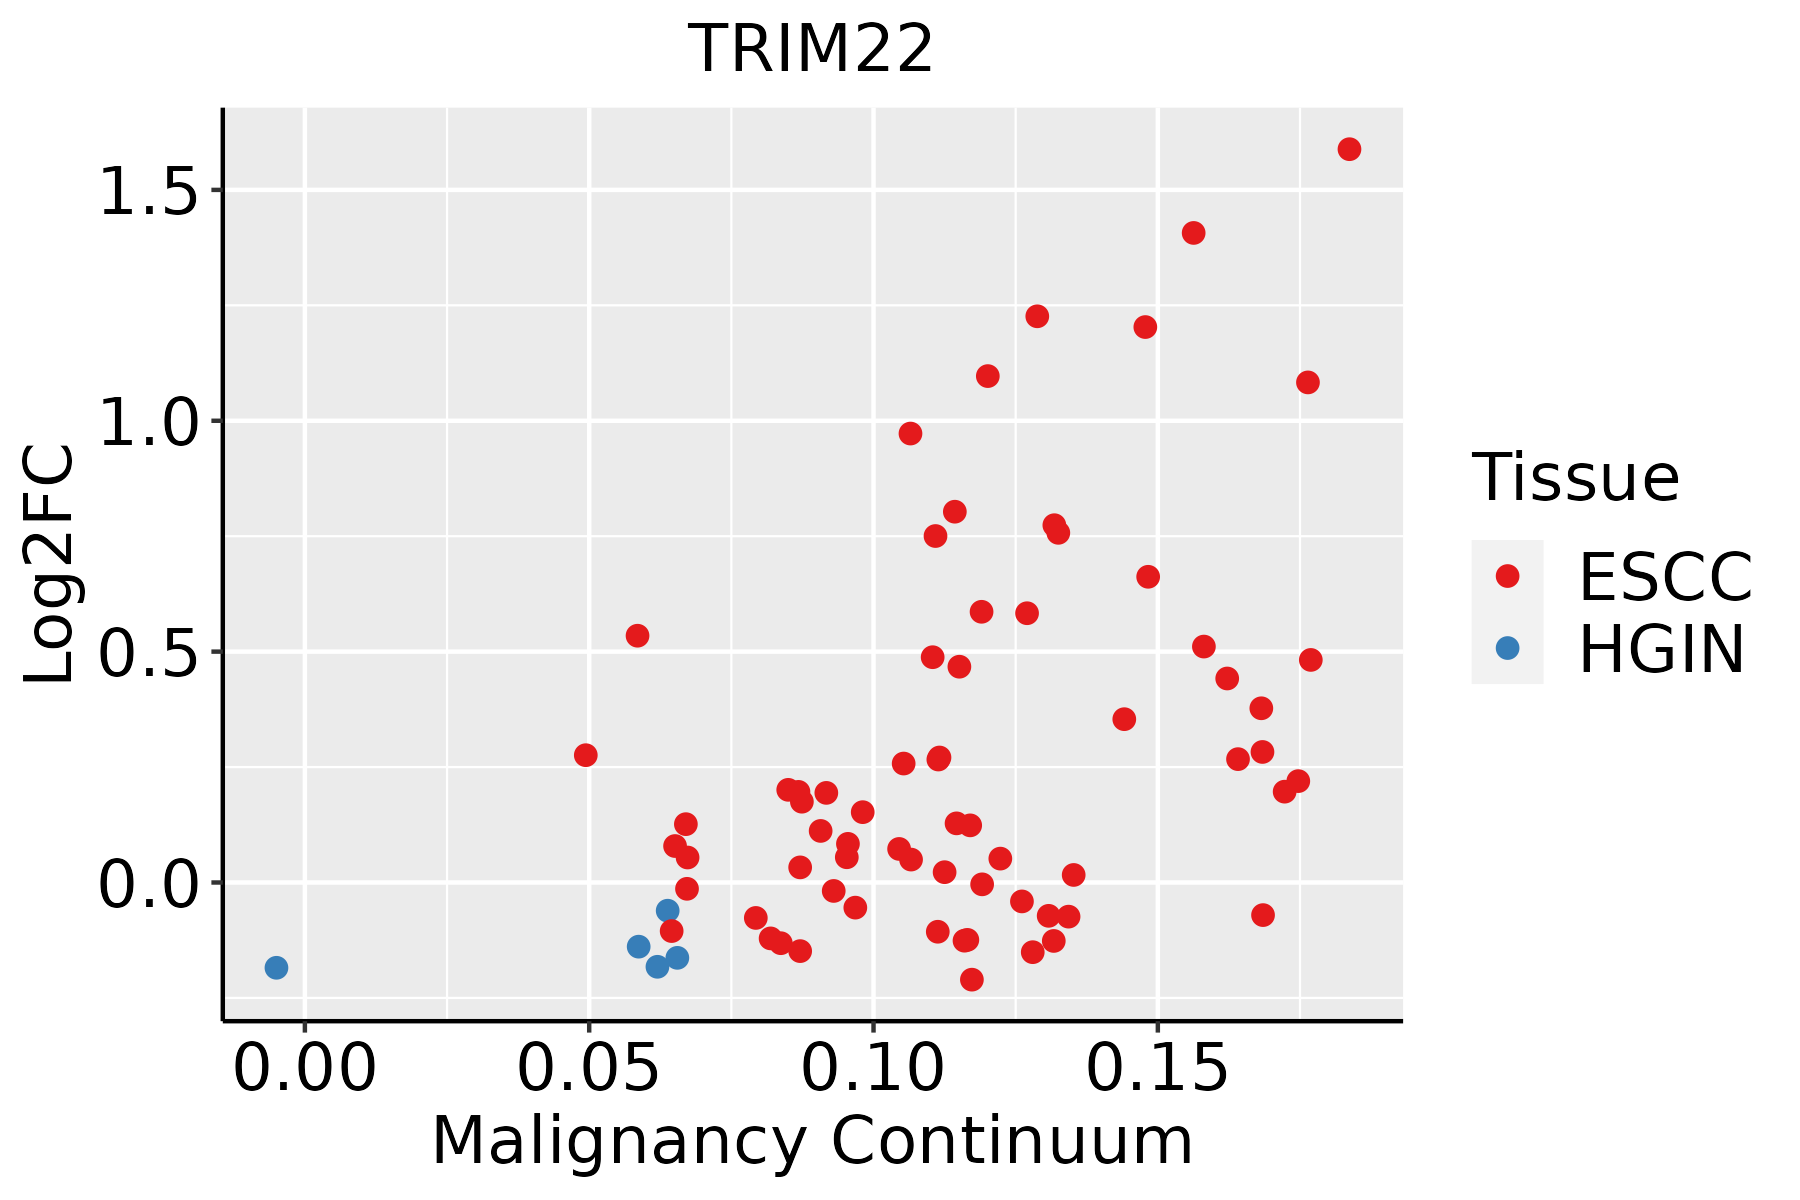 | ESCC: Esophageal squamous cell carcinoma |
| HGIN: High-grade intraepithelial neoplasias | ||
| LGIN: Low-grade intraepithelial neoplasias | ||
| Oral Cavity | 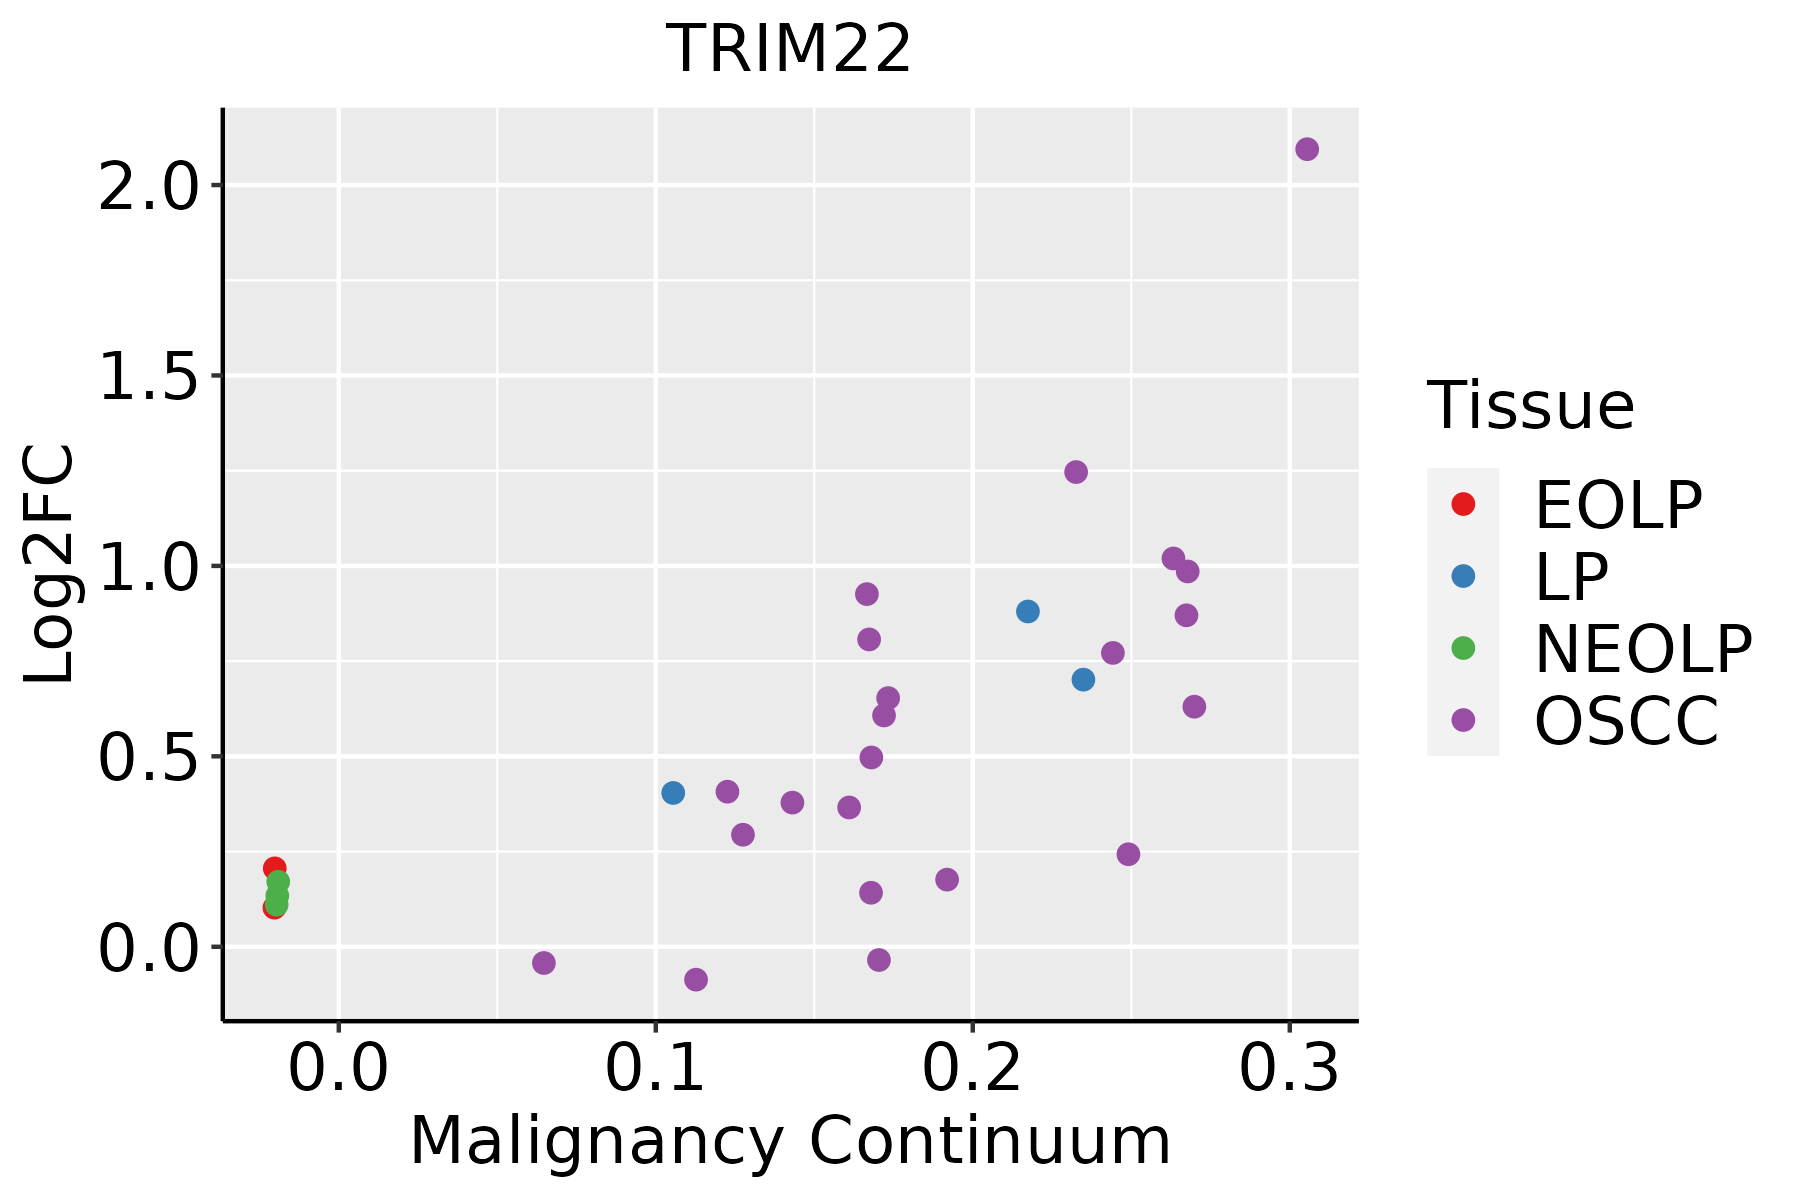 | EOLP: Erosive Oral lichen planus |
| LP: leukoplakia | ||
| NEOLP: Non-erosive oral lichen planus | ||
| OSCC: Oral squamous cell carcinoma | ||
| Skin | 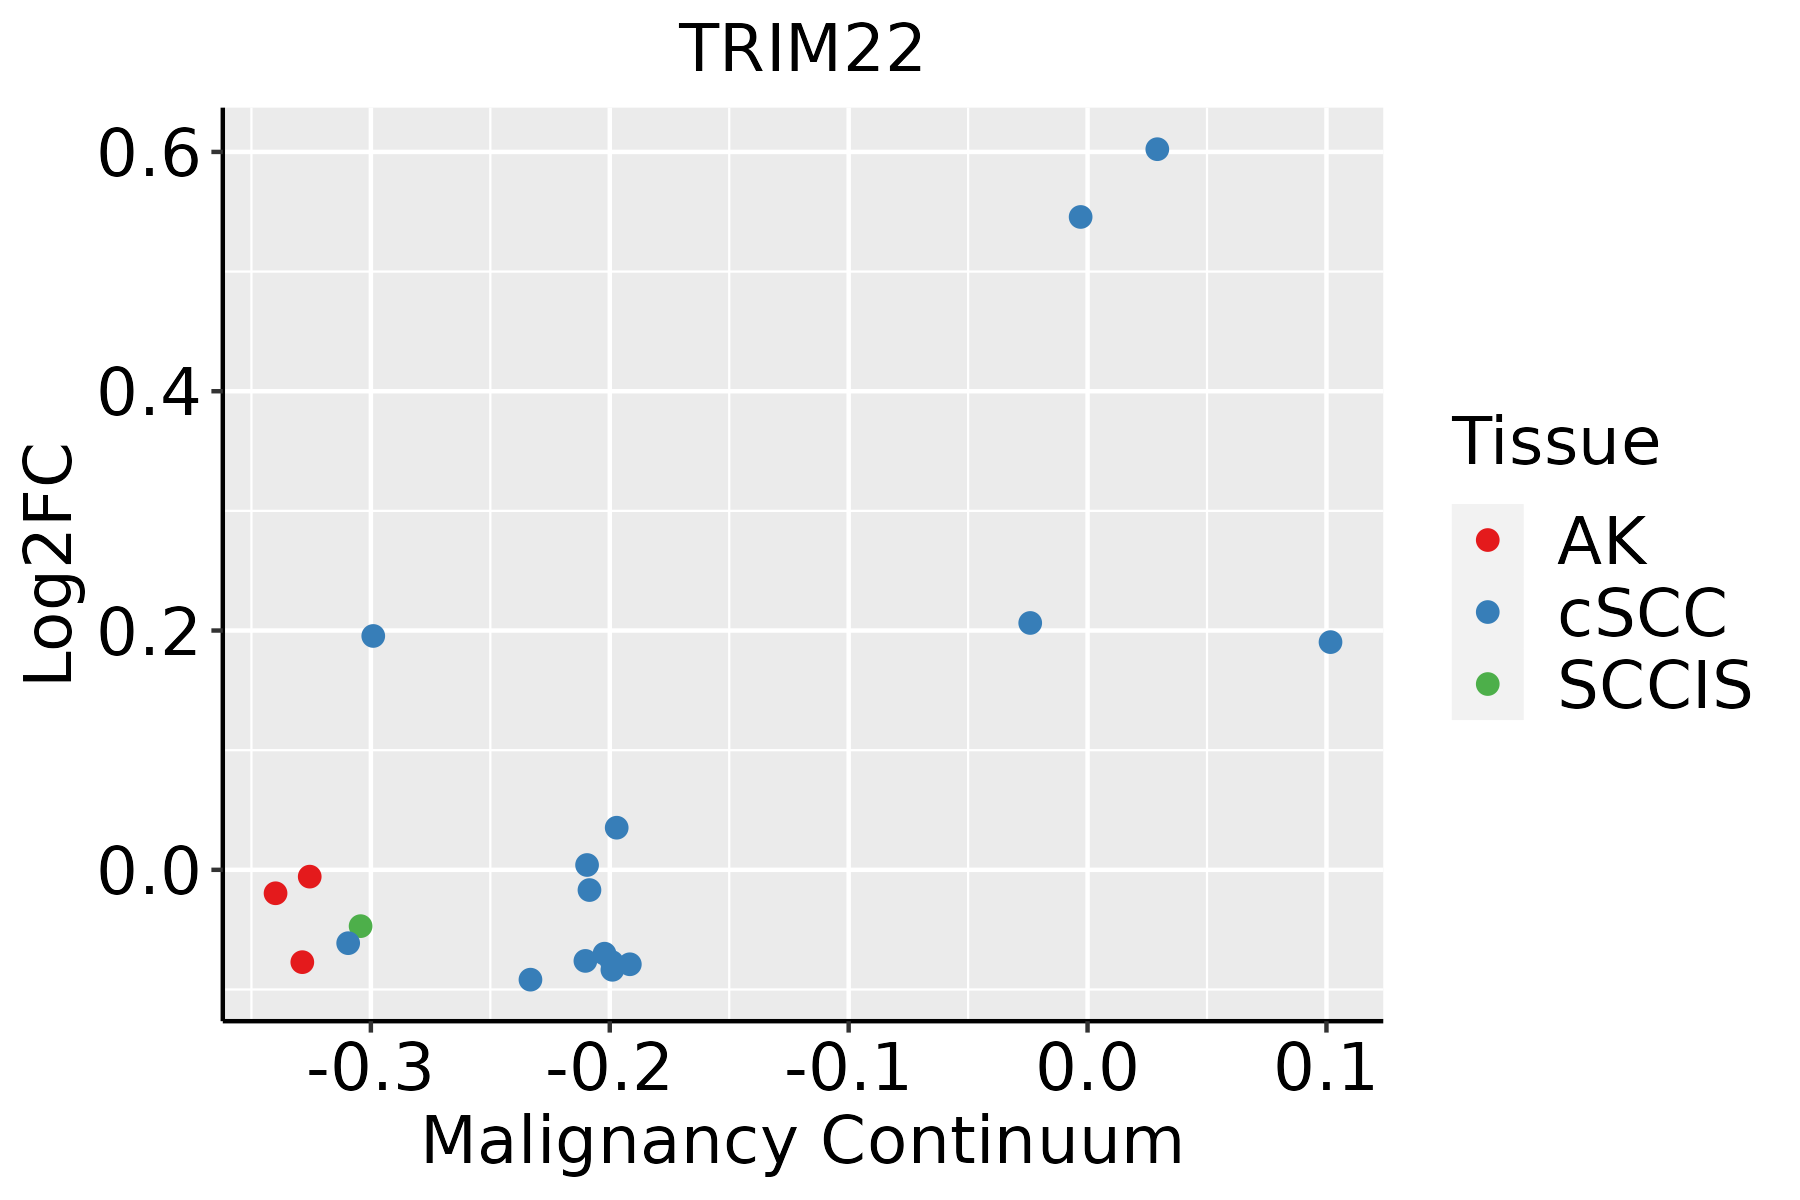 | AK: Actinic keratosis |
| cSCC: Cutaneous squamous cell carcinoma | ||
| SCCIS:squamous cell carcinoma in situ | ||
| Thyroid | 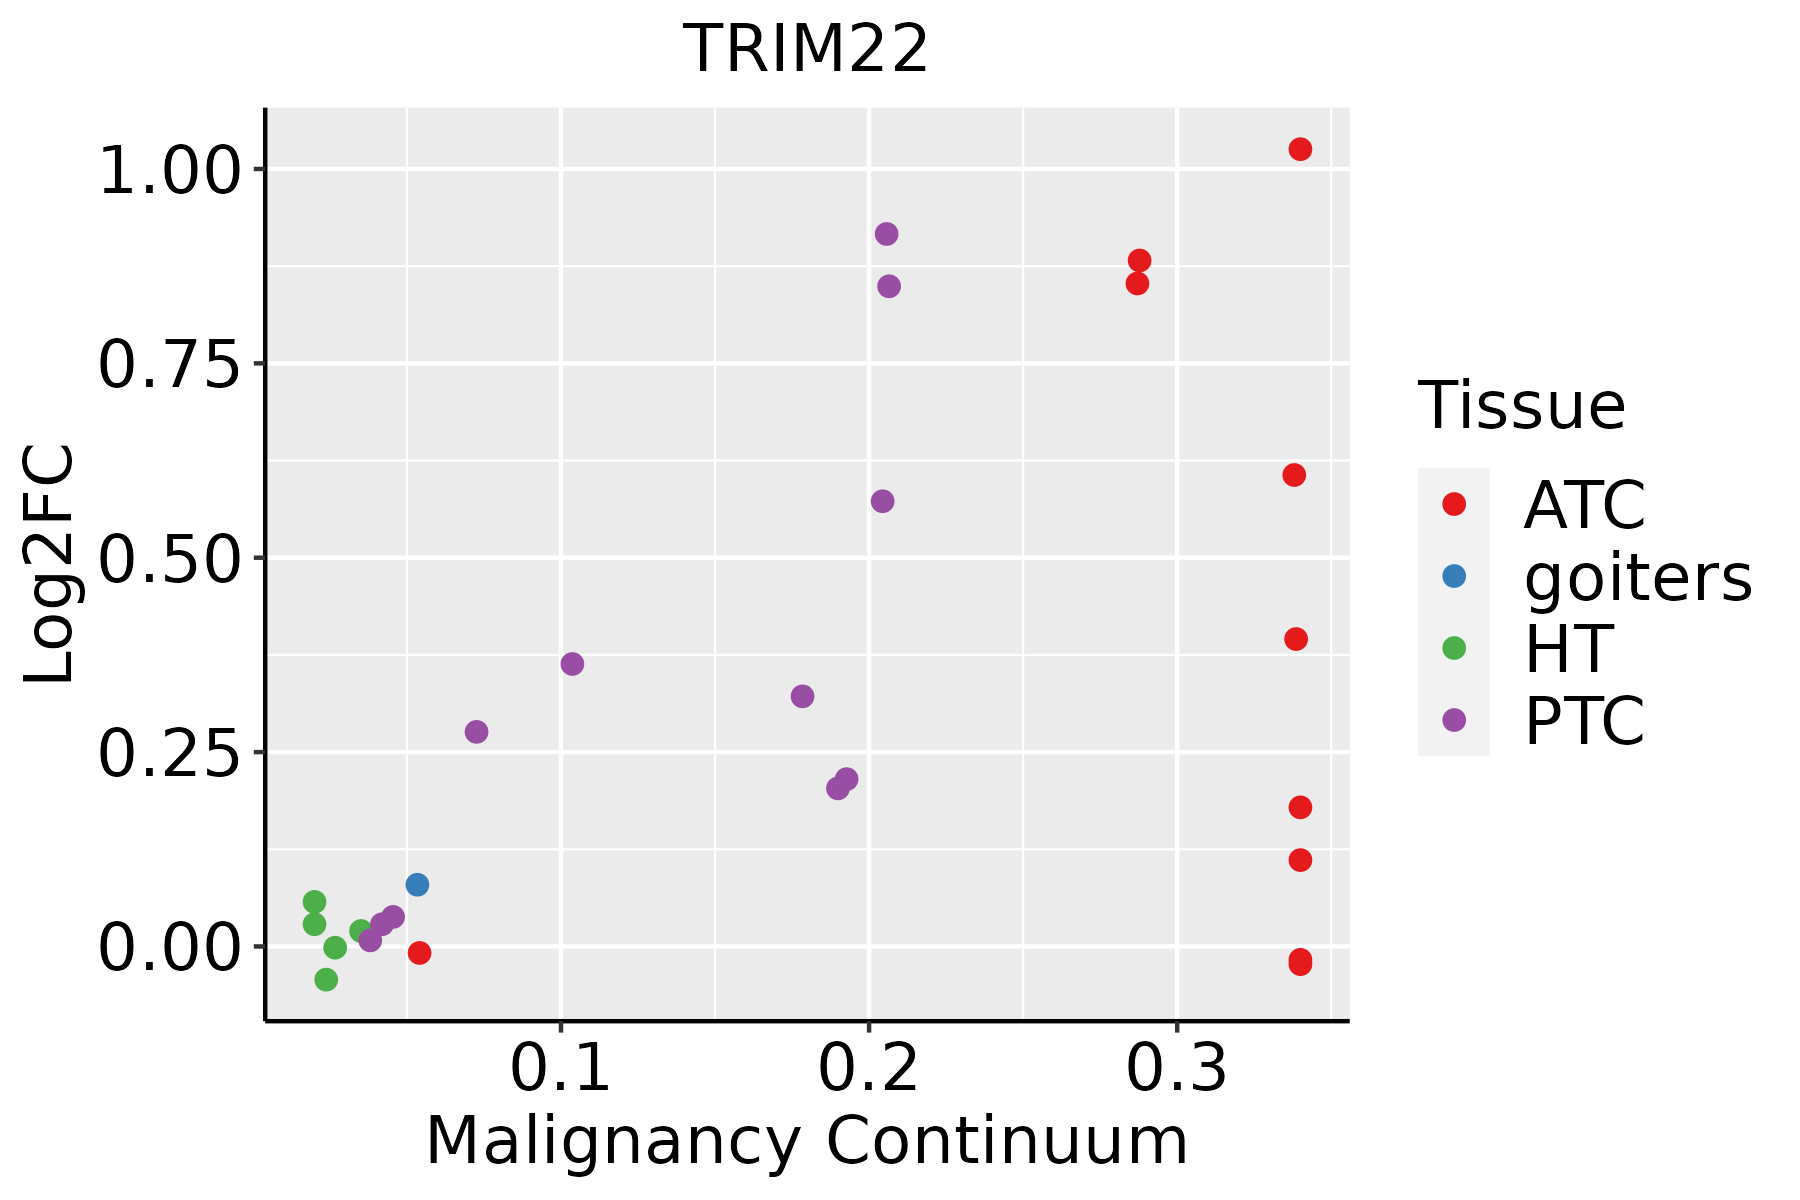 | ATC: Anaplastic thyroid cancer |
| HT: Hashimoto's thyroiditis | ||
| PTC: Papillary thyroid cancer |
| ∗log2FC in expression of this searched gene in stem-like cells from each diseased tissue sample relative to stem-like cells in normal samples in each tissue plotted against the malignancy continuum. Samples are colored based on if they are from different disease stage. |
Top |
Malignant transformation related pathway analysis |
| Find out the enriched GO biological processes and KEGG pathways involved in transition from healthy to precancer to cancer |
| Tissue | Disease Stage | Enriched GO biological Processes |
| Colorectum | AD |  |
| Colorectum | SER |  |
| Colorectum | MSS |  |
| Colorectum | MSI-H |  |
| Colorectum | FAP |  |
| ∗Top 15 enriched GO BP terms are showed in the bar plot of each disease state in each tissue. Each row represents a significant GO biological process which is colored according to the -log10(p.adjust). |
| Page: 1 2 3 4 5 6 7 8 9 |
| GO ID | Tissue | Disease Stage | Description | Gene Ratio | Bg Ratio | pvalue | p.adjust | Count |
| GO:0016032111 | Esophagus | ESCC | viral process | 301/8552 | 415/18723 | 3.34e-29 | 1.32e-26 | 301 |
| GO:0009896111 | Esophagus | ESCC | positive regulation of catabolic process | 332/8552 | 492/18723 | 4.36e-23 | 9.22e-21 | 332 |
| GO:0031331111 | Esophagus | ESCC | positive regulation of cellular catabolic process | 292/8552 | 427/18723 | 8.67e-22 | 1.53e-19 | 292 |
| GO:0019058111 | Esophagus | ESCC | viral life cycle | 226/8552 | 317/18723 | 1.17e-20 | 1.76e-18 | 226 |
| GO:001050617 | Esophagus | ESCC | regulation of autophagy | 220/8552 | 317/18723 | 6.72e-18 | 6.36e-16 | 220 |
| GO:000020917 | Esophagus | ESCC | protein polyubiquitination | 170/8552 | 236/18723 | 1.40e-16 | 1.09e-14 | 170 |
| GO:000961518 | Esophagus | ESCC | response to virus | 238/8552 | 367/18723 | 6.65e-14 | 3.32e-12 | 238 |
| GO:004312318 | Esophagus | ESCC | positive regulation of I-kappaB kinase/NF-kappaB signaling | 132/8552 | 186/18723 | 2.07e-12 | 8.58e-11 | 132 |
| GO:0050792111 | Esophagus | ESCC | regulation of viral process | 119/8552 | 164/18723 | 2.19e-12 | 9.03e-11 | 119 |
| GO:0043122110 | Esophagus | ESCC | regulation of I-kappaB kinase/NF-kappaB signaling | 167/8552 | 249/18723 | 6.11e-12 | 2.32e-10 | 167 |
| GO:000724919 | Esophagus | ESCC | I-kappaB kinase/NF-kappaB signaling | 183/8552 | 281/18723 | 3.02e-11 | 1.01e-09 | 183 |
| GO:1903900111 | Esophagus | ESCC | regulation of viral life cycle | 106/8552 | 148/18723 | 1.26e-10 | 3.72e-09 | 106 |
| GO:0044403111 | Esophagus | ESCC | biological process involved in symbiotic interaction | 186/8552 | 290/18723 | 1.43e-10 | 4.16e-09 | 186 |
| GO:00516075 | Esophagus | ESCC | defense response to virus | 171/8552 | 265/18723 | 3.91e-10 | 1.05e-08 | 171 |
| GO:01405465 | Esophagus | ESCC | defense response to symbiont | 171/8552 | 265/18723 | 3.91e-10 | 1.05e-08 | 171 |
| GO:0051701111 | Esophagus | ESCC | biological process involved in interaction with host | 135/8552 | 203/18723 | 1.49e-09 | 3.49e-08 | 135 |
| GO:0052126111 | Esophagus | ESCC | movement in host environment | 117/8552 | 175/18723 | 1.14e-08 | 2.26e-07 | 117 |
| GO:00510908 | Esophagus | ESCC | regulation of DNA-binding transcription factor activity | 252/8552 | 440/18723 | 5.22e-07 | 6.97e-06 | 252 |
| GO:00510918 | Esophagus | ESCC | positive regulation of DNA-binding transcription factor activity | 155/8552 | 260/18723 | 3.83e-06 | 4.14e-05 | 155 |
| GO:0044409111 | Esophagus | ESCC | entry into host | 96/8552 | 151/18723 | 6.73e-06 | 6.84e-05 | 96 |
| Page: 1 2 3 4 5 6 7 8 |
| Pathway ID | Tissue | Disease Stage | Description | Gene Ratio | Bg Ratio | pvalue | p.adjust | qvalue | Count |
| Page: 1 |
Top |
Cell-cell communication analysis |
| Identification of potential cell-cell interactions between two cell types and their ligand-receptor pairs for different disease states |
| Ligand | Receptor | LRpair | Pathway | Tissue | Disease Stage |
| Page: 1 |
Top |
Single-cell gene regulatory network inference analysis |
| Find out the significant the regulons (TFs) and the target genes of each regulon across cell types for different disease states |
| TF | Cell Type | Tissue | Disease Stage | Target Gene | RSS | Regulon Activity |
| ∗The dot plots of a searched regulon are shown for all cell subpopulations in each disease state of each tissue based on the regulon specific score inferred using pySCENIC and by calculating the average expression. |
| Page: 1 |
Top |
Somatic mutation of malignant transformation related genes |
| Annotation of somatic variants for genes involved in malignant transformation |
| Hugo Symbol | Variant Class | Variant Classification | dbSNP RS | HGVSc | HGVSp | HGVSp Short | SWISSPROT | BIOTYPE | SIFT | PolyPhen | Tumor Sample Barcode | Tissue | Histology | Sex | Age | Stage | Therapy Types | Drugs | Outcome |
| TRIM22 | SNV | Missense_Mutation | c.87T>A | p.Asp29Glu | p.D29E | Q8IYM9 | protein_coding | deleterious(0.04) | possibly_damaging(0.497) | TCGA-A8-A0A7-01 | Breast | breast invasive carcinoma | Female | <65 | I/II | Unknown | Unknown | SD | |
| TRIM22 | SNV | Missense_Mutation | rs775271050 | c.1055N>T | p.Ser352Leu | p.S352L | Q8IYM9 | protein_coding | deleterious(0) | probably_damaging(1) | TCGA-AN-A046-01 | Breast | breast invasive carcinoma | Female | >=65 | I/II | Unknown | Unknown | SD |
| TRIM22 | SNV | Missense_Mutation | rs368256788 | c.1418N>A | p.Arg473His | p.R473H | Q8IYM9 | protein_coding | tolerated(0.55) | benign(0.01) | TCGA-AN-A046-01 | Breast | breast invasive carcinoma | Female | >=65 | I/II | Unknown | Unknown | SD |
| TRIM22 | SNV | Missense_Mutation | rs372042006 | c.979C>T | p.Arg327Cys | p.R327C | Q8IYM9 | protein_coding | tolerated(0.21) | benign(0) | TCGA-A6-2686-01 | Colorectum | colon adenocarcinoma | Female | >=65 | I/II | Unknown | Unknown | SD |
| TRIM22 | SNV | Missense_Mutation | novel | c.179A>G | p.Gln60Arg | p.Q60R | Q8IYM9 | protein_coding | tolerated(1) | possibly_damaging(0.601) | TCGA-AA-3710-01 | Colorectum | colon adenocarcinoma | Female | >=65 | I/II | Unknown | Unknown | SD |
| TRIM22 | SNV | Missense_Mutation | c.757N>T | p.Ile253Phe | p.I253F | Q8IYM9 | protein_coding | tolerated(0.15) | benign(0.001) | TCGA-AA-3715-01 | Colorectum | colon adenocarcinoma | Male | >=65 | I/II | Unknown | Unknown | PD | |
| TRIM22 | SNV | Missense_Mutation | rs553638122 | c.511G>A | p.Ala171Thr | p.A171T | Q8IYM9 | protein_coding | tolerated(0.13) | benign(0) | TCGA-AA-3811-01 | Colorectum | colon adenocarcinoma | Female | >=65 | III/IV | Unknown | Unknown | PD |
| TRIM22 | SNV | Missense_Mutation | c.223G>A | p.Ala75Thr | p.A75T | Q8IYM9 | protein_coding | deleterious(0.04) | benign(0.036) | TCGA-AA-3864-01 | Colorectum | colon adenocarcinoma | Male | >=65 | I/II | Unknown | Unknown | SD | |
| TRIM22 | SNV | Missense_Mutation | c.1417C>T | p.Arg473Cys | p.R473C | Q8IYM9 | protein_coding | tolerated(0.22) | benign(0.003) | TCGA-AA-A00N-01 | Colorectum | colon adenocarcinoma | Male | >=65 | I/II | Unknown | Unknown | PD | |
| TRIM22 | SNV | Missense_Mutation | c.1013N>C | p.Asp338Ala | p.D338A | Q8IYM9 | protein_coding | tolerated(0.1) | benign(0.243) | TCGA-AA-A010-01 | Colorectum | colon adenocarcinoma | Female | <65 | I/II | Chemotherapy | folinic | CR |
| Page: 1 2 3 4 5 6 7 |
Top |
Related drugs of malignant transformation related genes |
| Identification of chemicals and drugs interact with genes involved in malignant transfromation |
| (DGIdb 4.0) |
| Entrez ID | Symbol | Category | Interaction Types | Drug Claim Name | Drug Name | PMIDs |
| Page: 1 |

Copyright 2023-Present -The University of Texas Health Science Center at Houston |