Schematic overview of the cellular and molecular mechanisms involved in the cancer progression, including the proposed cellular and molecular mechanisms in cancer cells trajectory. AT1: alveolar type 1 cells; AT2: alveolar type 2 cells; AAH: atypical adenomatous hyperplasia; AIS: adenocarcinoma in situ; MIA: minimally invasive adenocarcinoma; IA: invasive adenocarcinoma; EMT: epithelial-mesenchymal transition

Home

Download

Statistics

Help

Contact

Center for Computational Systems Medicine
leaf

Gene summary

leaf

Malignant transformation analysis

leaf

Malignant transformation related pathway analysis

leaf

Cell-cell communication analysis

leaf

Single-cell gene regulatory network inference analysis

leaf

Somatic mutation of malignant transformation related genes

leaf

Related drugs of malignant transformation related genes

Gene: TRIM13

Gene summary for TRIM13

check button Gene summary.

Gene informationSpeciesHuman
Gene symbol

TRIM13

Gene ID

10206

Gene nametripartite motif containing 13
Gene AliasCAR
Cytomap13q14.2
Gene Typeprotein-coding
GO ID

GO:0002376

UniProtAcc

L7MTJ6


Top

Malignant transformation analysis

check button Identification of the aberrant gene expression in precancerous and cancerous lesions by comparing the gene expression of stem-like cells in diseased tissues with normal stem cells
check button Malignant transformation involving gene list.
Entrez IDSymbolReplicatesSpeciesOrganTissueAdj P-valueLog2FCMalignancy
10206TRIM13LZE4THumanEsophagusESCC5.08e-073.06e-010.0811
10206TRIM13LZE7THumanEsophagusESCC2.24e-072.85e-010.0667
10206TRIM13LZE8THumanEsophagusESCC6.86e-052.41e-010.067
10206TRIM13LZE20THumanEsophagusESCC3.35e-049.89e-020.0662
10206TRIM13LZE22THumanEsophagusESCC7.15e-062.70e-010.068
10206TRIM13LZE24THumanEsophagusESCC2.81e-113.01e-010.0596
10206TRIM13LZE21THumanEsophagusESCC5.07e-052.56e-010.0655
10206TRIM13P1T-EHumanEsophagusESCC4.91e-084.75e-010.0875
10206TRIM13P2T-EHumanEsophagusESCC1.71e-234.66e-010.1177
10206TRIM13P4T-EHumanEsophagusESCC3.87e-092.08e-010.1323
10206TRIM13P5T-EHumanEsophagusESCC4.77e-051.50e-010.1327
10206TRIM13P8T-EHumanEsophagusESCC9.83e-212.79e-010.0889
10206TRIM13P9T-EHumanEsophagusESCC1.63e-102.79e-010.1131
10206TRIM13P10T-EHumanEsophagusESCC3.09e-254.18e-010.116
10206TRIM13P11T-EHumanEsophagusESCC1.42e-102.97e-010.1426
10206TRIM13P12T-EHumanEsophagusESCC7.44e-325.70e-010.1122
10206TRIM13P15T-EHumanEsophagusESCC1.72e-204.83e-010.1149
10206TRIM13P16T-EHumanEsophagusESCC4.01e-345.24e-010.1153
10206TRIM13P20T-EHumanEsophagusESCC1.14e-163.03e-010.1124
10206TRIM13P21T-EHumanEsophagusESCC5.82e-212.47e-010.1617
Page: 1 2 3 4 5 

check button Transcriptomic changes along malignancy continuum.
TissueExpression DynamicsAbbreviation
EsophagusThe image shows the transcriptomic changes along malignancy continuum.log2FC in expression of this searched gene in stem-like cells from each diseased tissue sample relative to stem-like cells in normal samples in each tissue plotted against the malignancy continuum. Samples are colored based on if they are from different disease stage.
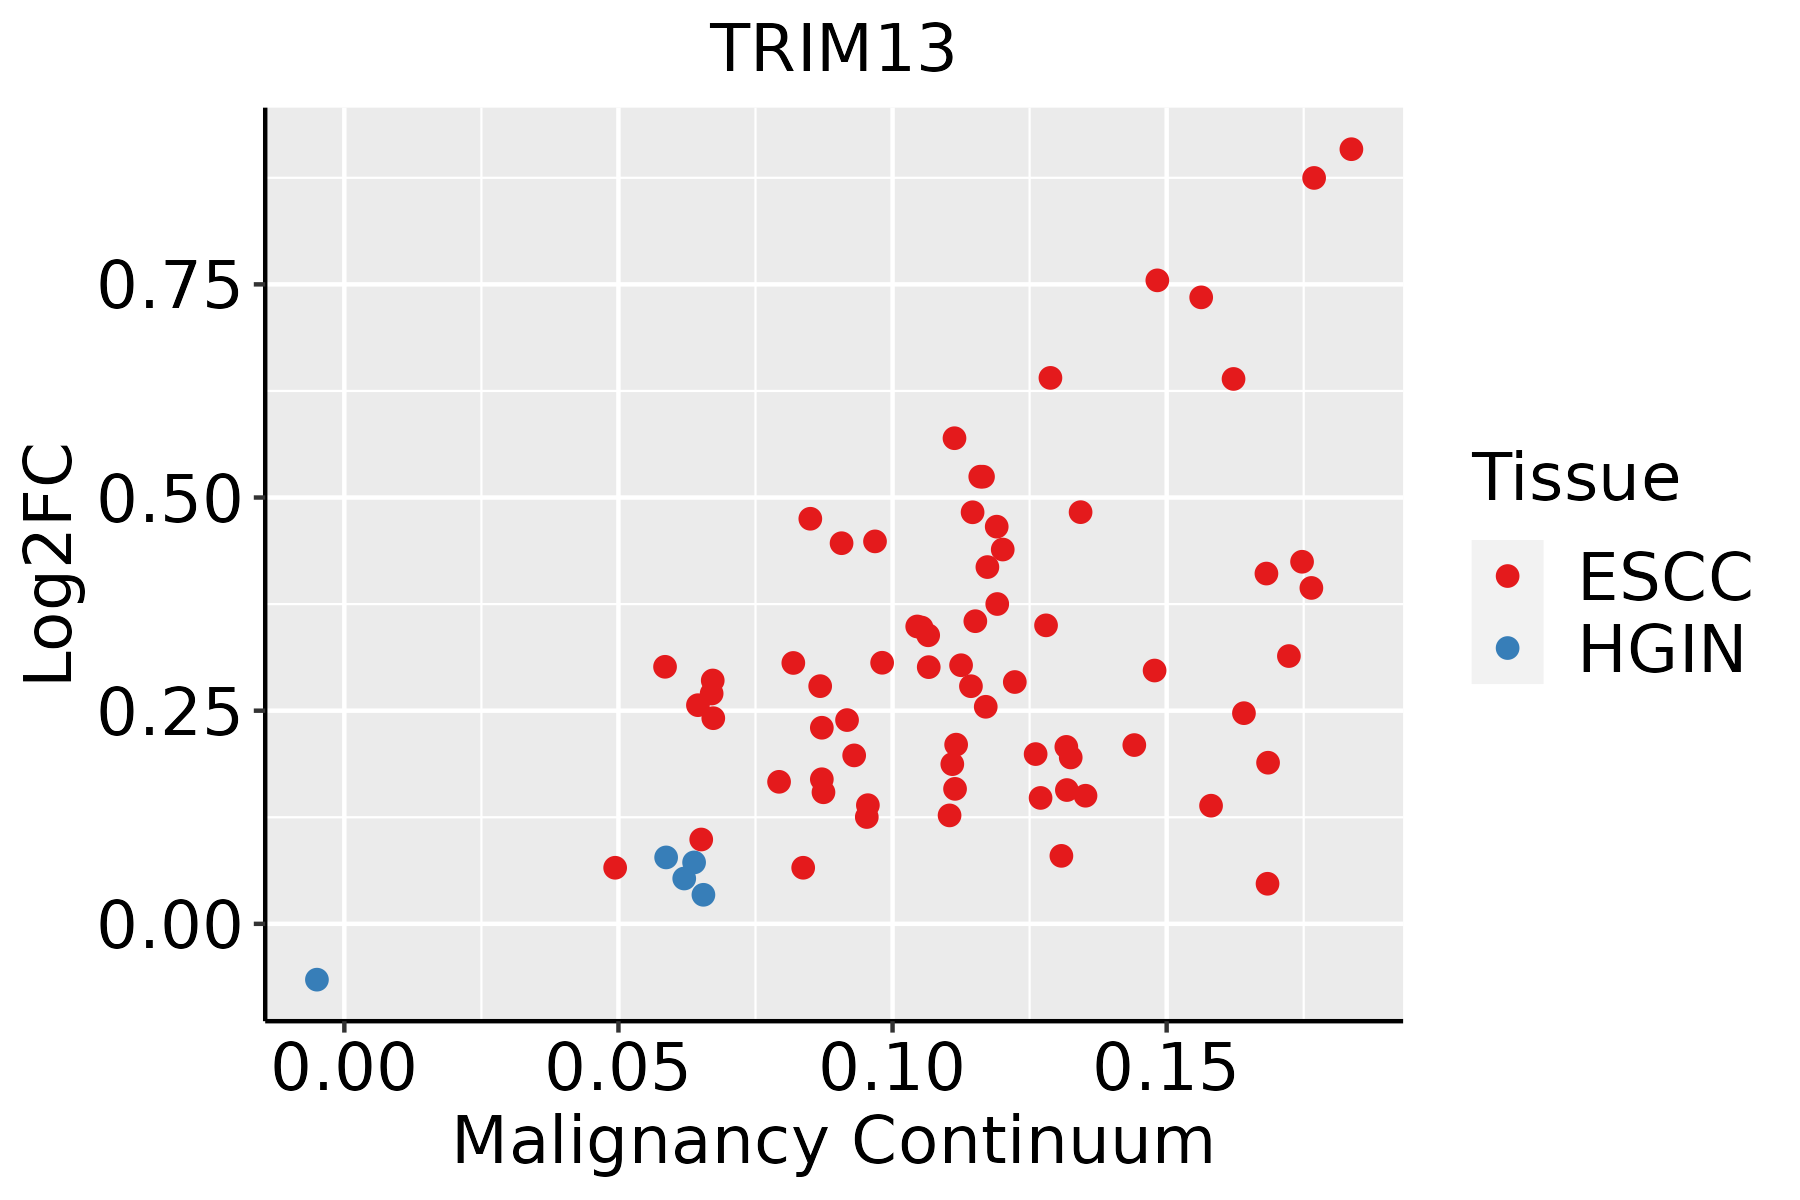
ESCC: Esophageal squamous cell carcinoma
HGIN: High-grade intraepithelial neoplasias
LGIN: Low-grade intraepithelial neoplasias
LiverThe image shows the transcriptomic changes along malignancy continuum.log2FC in expression of this searched gene in stem-like cells from each diseased tissue sample relative to stem-like cells in normal samples in each tissue plotted against the malignancy continuum. Samples are colored based on if they are from different disease stage.HCC: Hepatocellular carcinoma
NAFLD: Non-alcoholic fatty liver disease
Oral CavityThe image shows the transcriptomic changes along malignancy continuum.log2FC in expression of this searched gene in stem-like cells from each diseased tissue sample relative to stem-like cells in normal samples in each tissue plotted against the malignancy continuum. Samples are colored based on if they are from different disease stage.
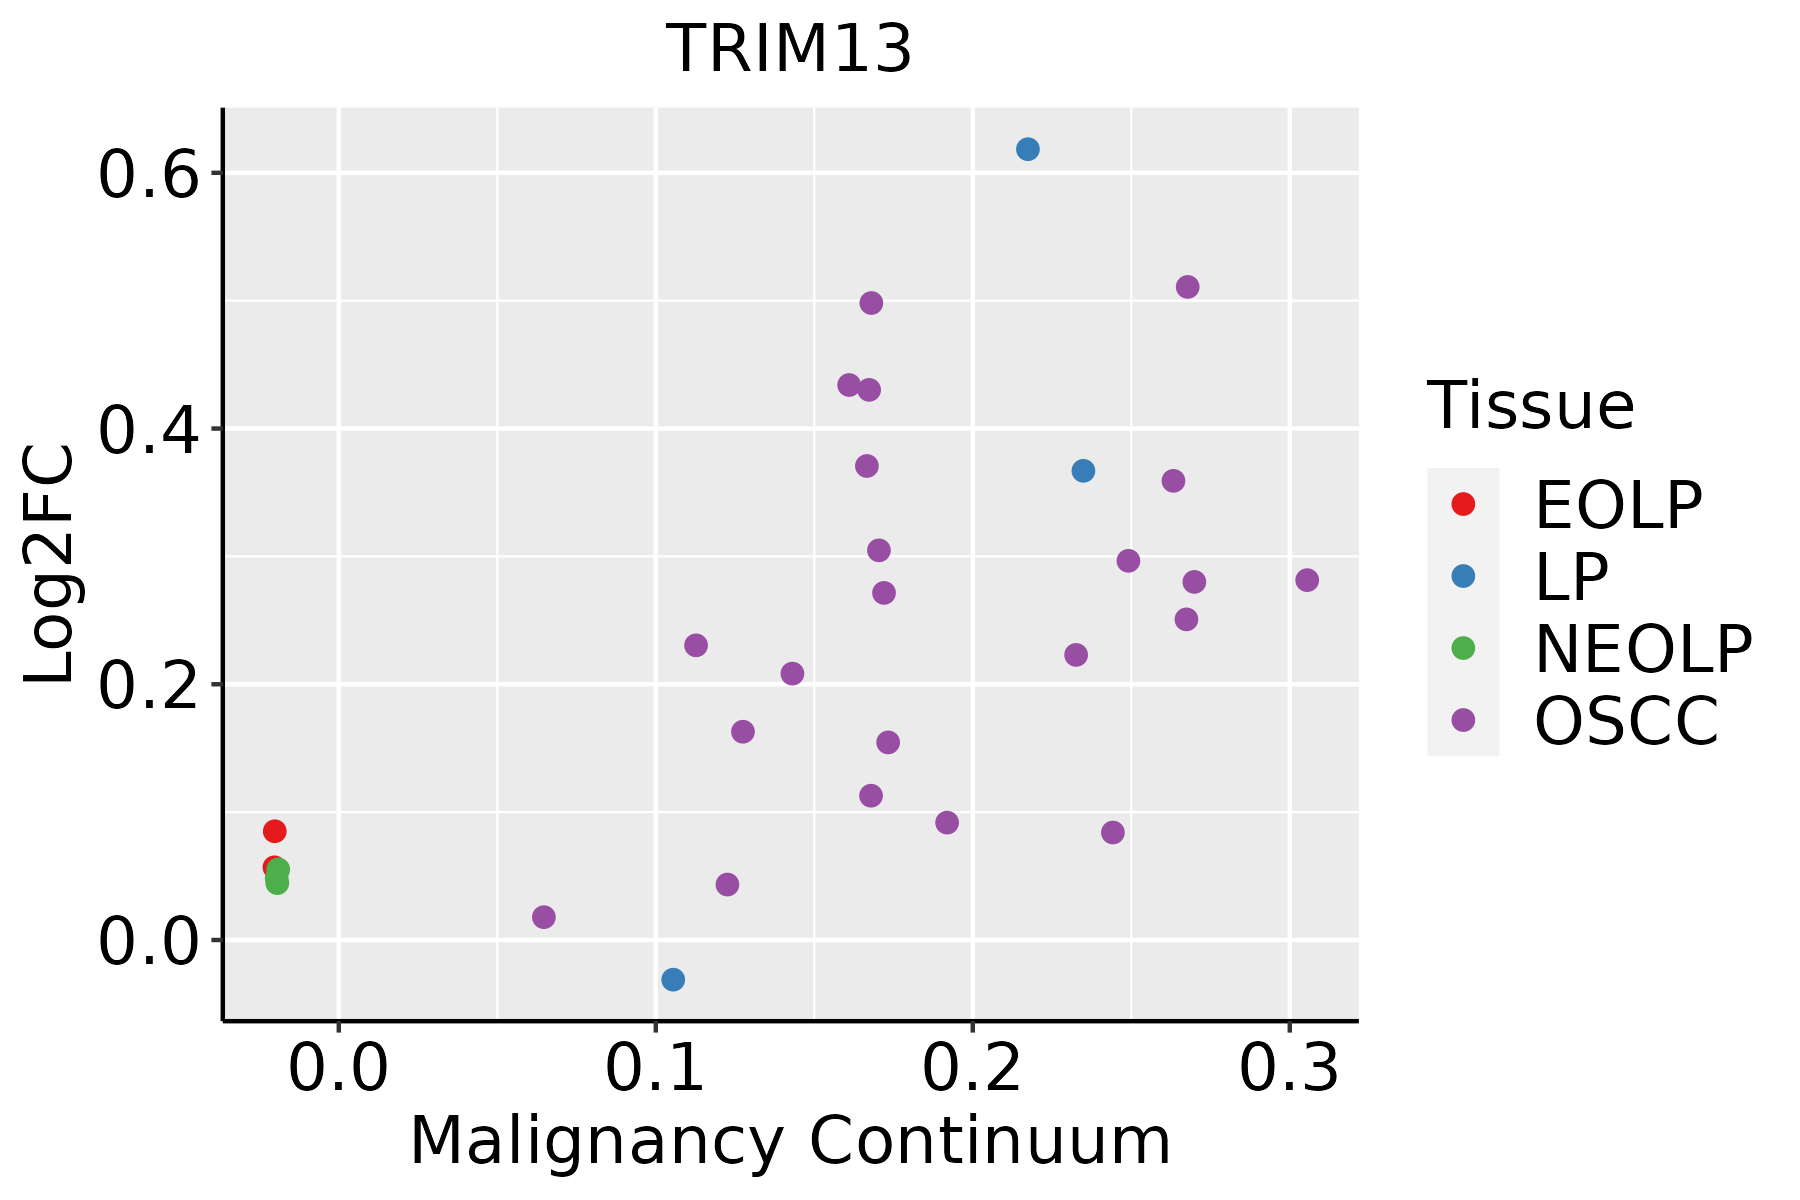
EOLP: Erosive Oral lichen planus
LP: leukoplakia
NEOLP: Non-erosive oral lichen planus
OSCC: Oral squamous cell carcinoma
ThyroidThe image shows the transcriptomic changes along malignancy continuum.log2FC in expression of this searched gene in stem-like cells from each diseased tissue sample relative to stem-like cells in normal samples in each tissue plotted against the malignancy continuum. Samples are colored based on if they are from different disease stage.ATC: Anaplastic thyroid cancer
HT: Hashimoto's thyroiditis
PTC: Papillary thyroid cancer
∗log2FC in expression of this searched gene in stem-like cells from each diseased tissue sample relative to stem-like cells in normal samples in each tissue plotted against the malignancy continuum. Samples are colored based on if they are from different disease stage.

Top

Malignant transformation related pathway analysis

check buttonFind out the enriched GO biological processes and KEGG pathways involved in transition from healthy to precancer to cancer
check button Figure of enriched GO biological processes.
TissueDisease StageEnriched GO biological Processes
ColorectumADGO analysis - Figure of enriched GO biological processes: Top 15 enriched GO BP terms are showed in the bar plot of each disease state in each tissue. Each row represents a significant GO biological process which is colored according to the -log10(p.adjust).
ColorectumSERGO analysis - Figure of enriched GO biological processes: Top 15 enriched GO BP terms are showed in the bar plot of each disease state in each tissue. Each row represents a significant GO biological process which is colored according to the -log10(p.adjust).
ColorectumMSSGO analysis - Figure of enriched GO biological processes: Top 15 enriched GO BP terms are showed in the bar plot of each disease state in each tissue. Each row represents a significant GO biological process which is colored according to the -log10(p.adjust).
ColorectumMSI-HGO analysis - Figure of enriched GO biological processes: Top 15 enriched GO BP terms are showed in the bar plot of each disease state in each tissue. Each row represents a significant GO biological process which is colored according to the -log10(p.adjust).
ColorectumFAPGO analysis - Figure of enriched GO biological processes: Top 15 enriched GO BP terms are showed in the bar plot of each disease state in each tissue. Each row represents a significant GO biological process which is colored according to the -log10(p.adjust).
∗Top 15 enriched GO BP terms are showed in the bar plot of each disease state in each tissue. Each row represents a significant GO biological process which is colored according to the -log10(p.adjust).
Page: 1 2 3 4 5 6 7 8 9 

check button Enriched GO biological processes.
GO IDTissueDisease StageDescriptionGene RatioBg Ratiopvaluep.adjustCount
GO:0010498111EsophagusESCCproteasomal protein catabolic process369/8552490/187231.13e-411.80e-38369
GO:0043161111EsophagusESCCproteasome-mediated ubiquitin-dependent protein catabolic process312/8552412/187233.53e-364.48e-33312
GO:0016032111EsophagusESCCviral process301/8552415/187233.34e-291.32e-26301
GO:001623617EsophagusESCCmacroautophagy216/8552291/187231.94e-234.57e-21216
GO:0009896111EsophagusESCCpositive regulation of catabolic process332/8552492/187234.36e-239.22e-21332
GO:0034976111EsophagusESCCresponse to endoplasmic reticulum stress192/8552256/187237.15e-221.30e-19192
GO:0031331111EsophagusESCCpositive regulation of cellular catabolic process292/8552427/187238.67e-221.53e-19292
GO:0019058111EsophagusESCCviral life cycle226/8552317/187231.17e-201.76e-18226
GO:001050617EsophagusESCCregulation of autophagy220/8552317/187236.72e-186.36e-16220
GO:001908017EsophagusESCCviral gene expression80/855294/187232.04e-151.28e-1380
GO:001021217EsophagusESCCresponse to ionizing radiation110/8552148/187231.11e-124.78e-11110
GO:004312318EsophagusESCCpositive regulation of I-kappaB kinase/NF-kappaB signaling132/8552186/187232.07e-128.58e-11132
GO:0050792111EsophagusESCCregulation of viral process119/8552164/187232.19e-129.03e-11119
GO:0043122110EsophagusESCCregulation of I-kappaB kinase/NF-kappaB signaling167/8552249/187236.11e-122.32e-10167
GO:000724919EsophagusESCCI-kappaB kinase/NF-kappaB signaling183/8552281/187233.02e-111.01e-09183
GO:000931419EsophagusESCCresponse to radiation277/8552456/187234.42e-111.43e-09277
GO:003650315EsophagusESCCERAD pathway82/8552107/187235.80e-111.84e-0982
GO:001624114EsophagusESCCregulation of macroautophagy102/8552141/187231.09e-103.27e-09102
GO:1903900111EsophagusESCCregulation of viral life cycle106/8552148/187231.26e-103.72e-09106
GO:0044403111EsophagusESCCbiological process involved in symbiotic interaction186/8552290/187231.43e-104.16e-09186
Page: 1 2 3 4 5 6 7 8 9 10 11 12 13 14 

check button Enriched KEGG pathways.
Pathway IDTissueDisease StageDescriptionGene RatioBg Ratiopvaluep.adjustqvalueCount
Page: 1 

Top

Cell-cell communication analysis

check buttonIdentification of potential cell-cell interactions between two cell types and their ligand-receptor pairs for different disease states
LigandReceptorLRpairPathwayTissueDisease Stage
Page: 1 

Top

Single-cell gene regulatory network inference analysis

check buttonFind out the significant the regulons (TFs) and the target genes of each regulon across cell types for different disease states
TFCell TypeTissueDisease StageTarget GeneRSSRegulon Activity
∗The dot plots of a searched regulon are shown for all cell subpopulations in each disease state of each tissue based on the regulon specific score inferred using pySCENIC and by calculating the average expression.
Page: 1 

Top

Somatic mutation of malignant transformation related genes

check buttonAnnotation of somatic variants for genes involved in malignant transformation
Hugo SymbolVariant ClassVariant ClassificationdbSNP RSHGVScHGVSpHGVSp ShortSWISSPROTBIOTYPESIFTPolyPhenTumor Sample BarcodeTissueHistologySexAgeStageTherapy TypesDrugsOutcome
TRIM13SNVMissense_Mutationnovelc.454N>Cp.Phe152Leup.F152LO60858protein_codingtolerated(1)benign(0.194)TCGA-AN-A046-01Breastbreast invasive carcinomaFemale>=65I/IIUnknownUnknownSD
TRIM13SNVMissense_Mutationnovelc.563N>Gp.Phe188Cysp.F188CO60858protein_codingdeleterious(0)probably_damaging(0.935)TCGA-AN-A046-01Breastbreast invasive carcinomaFemale>=65I/IIUnknownUnknownSD
TRIM13SNVMissense_Mutationnovelc.308N>Gp.Gln103Argp.Q103RO60858protein_codingdeleterious(0.01)probably_damaging(0.91)TCGA-B6-A40C-01Breastbreast invasive carcinomaFemale<65I/IIHormone TherapycyclophosphamideSD
TRIM13SNVMissense_Mutationnovelc.843G>Ap.Met281Ilep.M281IO60858protein_codingtolerated(0.77)benign(0.001)TCGA-BH-A1F8-01Breastbreast invasive carcinomaFemale>=65III/IVUnknownUnknownPD
TRIM13SNVMissense_Mutationc.1159N>Ap.Glu387Lysp.E387KO60858protein_codingtolerated_low_confidence(0.22)benign(0.003)TCGA-E2-A10C-01Breastbreast invasive carcinomaFemale<65I/IIChemotherapycytoxanSD
TRIM13insertionFrame_Shift_Insnovelc.459_460insGATCCACGGGTTTTGCCTTGCTCCCACAACTTCTGCAAAAp.Thr154AspfsTer30p.T154Dfs*30O60858protein_codingTCGA-A2-A0D1-01Breastbreast invasive carcinomaFemale>=65I/IIChemotherapytaxotereSD
TRIM13insertionFrame_Shift_Insnovelc.568_569insCp.Glu190AlafsTer13p.E190Afs*13O60858protein_codingTCGA-A8-A090-01Breastbreast invasive carcinomaFemale>=65I/IIUnknownUnknownSD
TRIM13insertionNonsense_Mutationnovelc.681_682insCTCTCAACATTTTCTGCCTGACTGATATGCAGCTGATTTGTGGGp.Ile228LeufsTer7p.I228Lfs*7O60858protein_codingTCGA-AN-A0FX-01Breastbreast invasive carcinomaFemale<65I/IIUnknownUnknownSD
TRIM13insertionFrame_Shift_Insnovelc.575_576insGTGGGp.Gln193TrpfsTer20p.Q193Wfs*20O60858protein_codingTCGA-AO-A03L-01Breastbreast invasive carcinomaFemale<65III/IVChemotherapycyclophosphamideSD
TRIM13deletionFrame_Shift_Delc.1207_1208delNNp.Phe403CysfsTer5p.F403Cfs*5O60858protein_codingTCGA-BH-A0AW-01Breastbreast invasive carcinomaFemale<65I/IIChemotherapycarboplatinSD
Page: 1 2 3 4 5 6 

Top

Related drugs of malignant transformation related genes

check buttonIdentification of chemicals and drugs interact with genes involved in malignant transfromation
(DGIdb 4.0)
Entrez IDSymbolCategoryInteraction TypesDrug Claim NameDrug NamePMIDs
Page: 1