
|
|||||
|
 | |
| |
| |
| |
| |
| |
|
Gene: TRIL |
Gene summary for TRIL |
| Gene information | Species | Human | Gene symbol | TRIL | Gene ID | 9865 |
| Gene name | TLR4 interactor with leucine rich repeats | |
| Gene Alias | TRIL | |
| Cytomap | 7p14.3 | |
| Gene Type | protein-coding | GO ID | GO:0001816 | UniProtAcc | Q7L0X0 |
Top |
Malignant transformation analysis |
| Identification of the aberrant gene expression in precancerous and cancerous lesions by comparing the gene expression of stem-like cells in diseased tissues with normal stem cells |
| Entrez ID | Symbol | Replicates | Species | Organ | Tissue | Adj P-value | Log2FC | Malignancy |
| 9865 | TRIL | male-WTA | Human | Thyroid | PTC | 1.29e-07 | 1.25e-01 | 0.1037 |
| 9865 | TRIL | PTC01 | Human | Thyroid | PTC | 1.50e-04 | 7.22e-02 | 0.1899 |
| 9865 | TRIL | PTC06 | Human | Thyroid | PTC | 2.24e-03 | 1.14e-01 | 0.2057 |
| 9865 | TRIL | PTC07 | Human | Thyroid | PTC | 5.85e-03 | 7.91e-02 | 0.2044 |
| 9865 | TRIL | ATC12 | Human | Thyroid | ATC | 5.95e-07 | 1.73e-01 | 0.34 |
| 9865 | TRIL | ATC13 | Human | Thyroid | ATC | 1.96e-38 | 9.16e-01 | 0.34 |
| 9865 | TRIL | ATC4 | Human | Thyroid | ATC | 5.39e-04 | 1.81e-01 | 0.34 |
| 9865 | TRIL | ATC5 | Human | Thyroid | ATC | 3.59e-51 | 9.97e-01 | 0.34 |
| Page: 1 |
| Tissue | Expression Dynamics | Abbreviation |
| Thyroid | 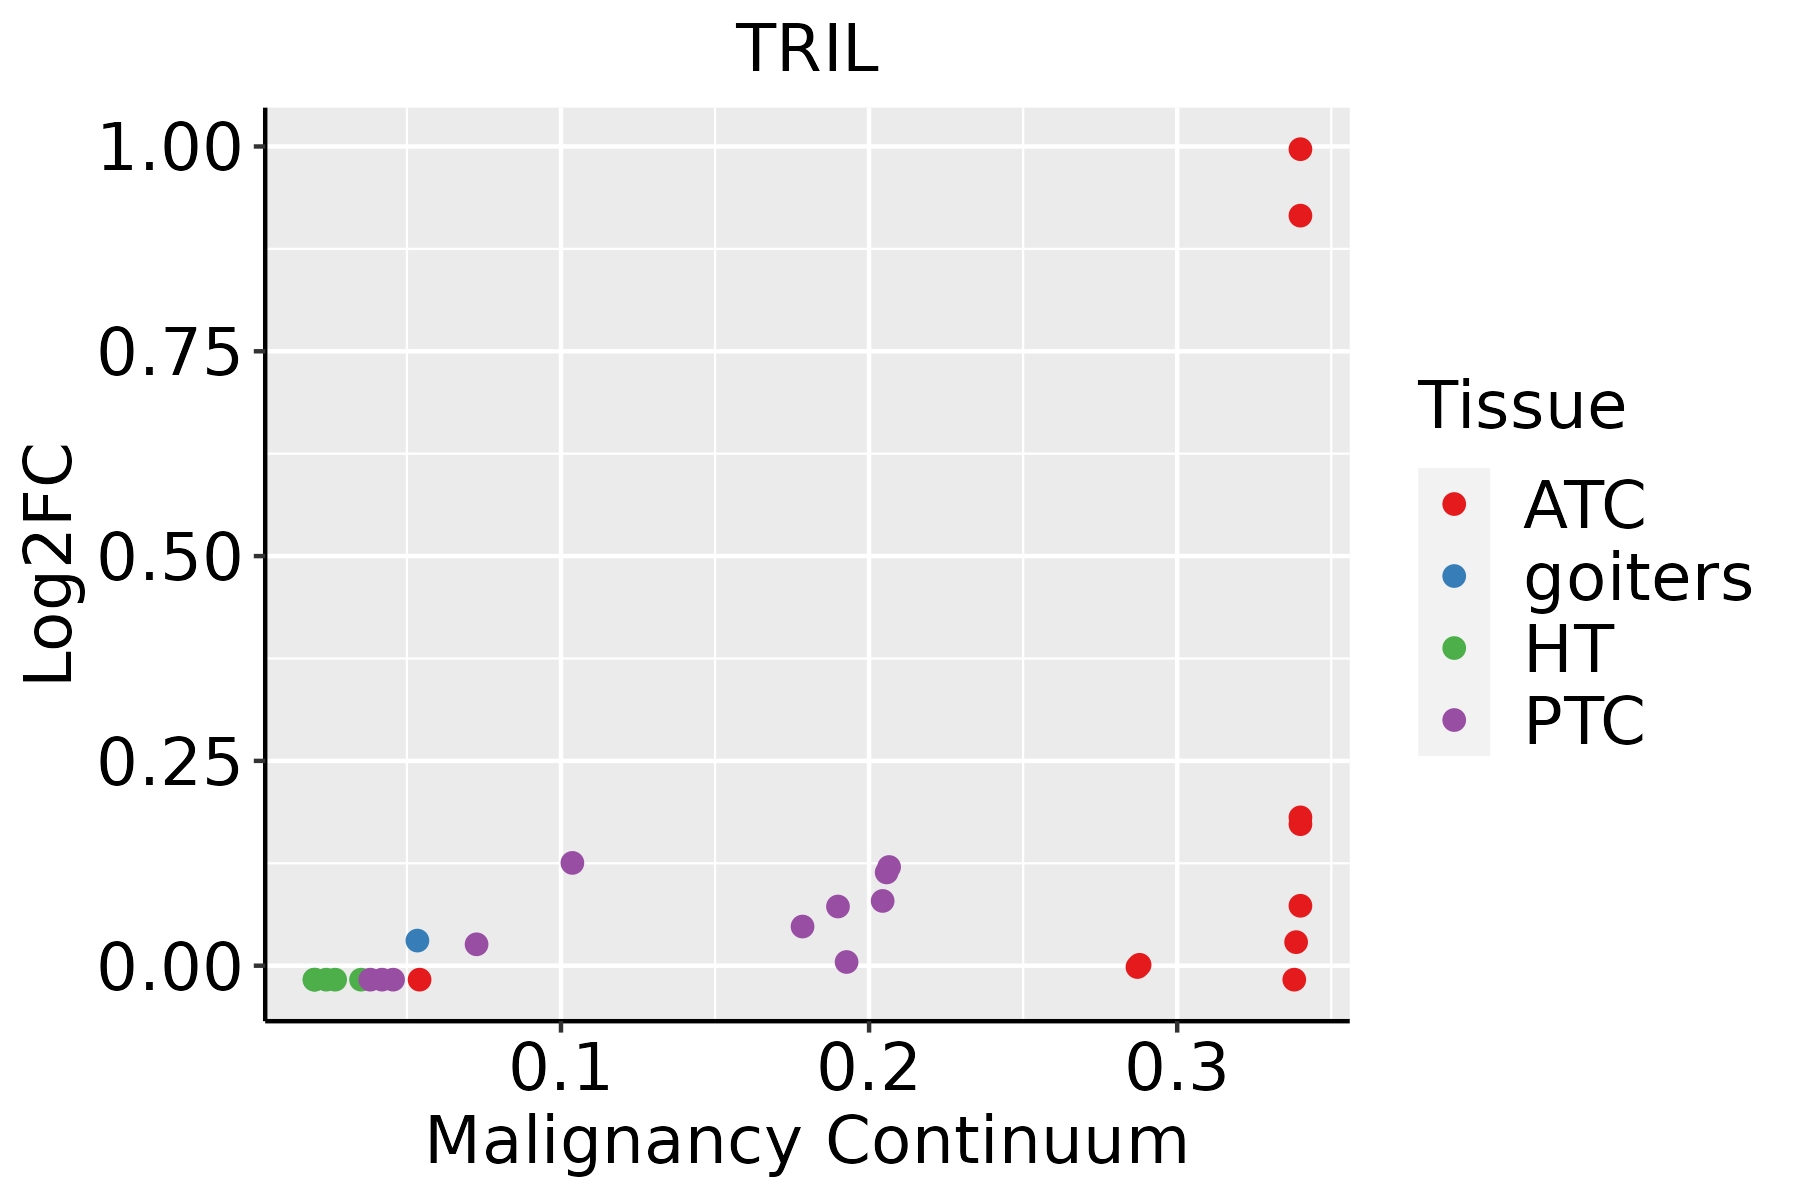 | ATC: Anaplastic thyroid cancer |
| HT: Hashimoto's thyroiditis | ||
| PTC: Papillary thyroid cancer |
| ∗log2FC in expression of this searched gene in stem-like cells from each diseased tissue sample relative to stem-like cells in normal samples in each tissue plotted against the malignancy continuum. Samples are colored based on if they are from different disease stage. |
Top |
Malignant transformation related pathway analysis |
| Find out the enriched GO biological processes and KEGG pathways involved in transition from healthy to precancer to cancer |
| Tissue | Disease Stage | Enriched GO biological Processes |
| Colorectum | AD |  |
| Colorectum | SER |  |
| Colorectum | MSS |  |
| Colorectum | MSI-H |  |
| Colorectum | FAP |  |
| ∗Top 15 enriched GO BP terms are showed in the bar plot of each disease state in each tissue. Each row represents a significant GO biological process which is colored according to the -log10(p.adjust). |
| Page: 1 2 3 4 5 6 7 8 9 |
| GO ID | Tissue | Disease Stage | Description | Gene Ratio | Bg Ratio | pvalue | p.adjust | Count |
| GO:00022215 | Thyroid | PTC | pattern recognition receptor signaling pathway | 77/5968 | 172/18723 | 2.56e-04 | 1.84e-03 | 77 |
| GO:000222114 | Thyroid | ATC | pattern recognition receptor signaling pathway | 80/6293 | 172/18723 | 2.89e-04 | 1.84e-03 | 80 |
| Page: 1 |
| Pathway ID | Tissue | Disease Stage | Description | Gene Ratio | Bg Ratio | pvalue | p.adjust | qvalue | Count |
| Page: 1 |
Top |
Cell-cell communication analysis |
| Identification of potential cell-cell interactions between two cell types and their ligand-receptor pairs for different disease states |
| Ligand | Receptor | LRpair | Pathway | Tissue | Disease Stage |
| Page: 1 |
Top |
Single-cell gene regulatory network inference analysis |
| Find out the significant the regulons (TFs) and the target genes of each regulon across cell types for different disease states |
| TF | Cell Type | Tissue | Disease Stage | Target Gene | RSS | Regulon Activity |
| ∗The dot plots of a searched regulon are shown for all cell subpopulations in each disease state of each tissue based on the regulon specific score inferred using pySCENIC and by calculating the average expression. |
| Page: 1 |
Top |
Somatic mutation of malignant transformation related genes |
| Annotation of somatic variants for genes involved in malignant transformation |
| Hugo Symbol | Variant Class | Variant Classification | dbSNP RS | HGVSc | HGVSp | HGVSp Short | SWISSPROT | BIOTYPE | SIFT | PolyPhen | Tumor Sample Barcode | Tissue | Histology | Sex | Age | Stage | Therapy Types | Drugs | Outcome |
| TRIL | SNV | Missense_Mutation | novel | c.691N>T | p.Leu231Phe | p.L231F | Q7L0X0 | protein_coding | deleterious(0) | probably_damaging(0.995) | TCGA-A8-A079-01 | Breast | breast invasive carcinoma | Female | >=65 | III/IV | Chemotherapy | 5-fluorouracil | SD |
| TRIL | SNV | Missense_Mutation | novel | c.766G>C | p.Gly256Arg | p.G256R | Q7L0X0 | protein_coding | deleterious(0.02) | possibly_damaging(0.474) | TCGA-A8-A08R-01 | Breast | breast invasive carcinoma | Female | <65 | I/II | Unknown | Unknown | SD |
| TRIL | SNV | Missense_Mutation | novel | c.2365N>C | p.Asp789His | p.D789H | Q7L0X0 | protein_coding | deleterious(0) | possibly_damaging(0.65) | TCGA-AQ-A54N-01 | Breast | breast invasive carcinoma | Female | <65 | I/II | Unknown | Unknown | SD |
| TRIL | SNV | Missense_Mutation | novel | c.2311G>A | p.Val771Met | p.V771M | Q7L0X0 | protein_coding | tolerated(0.24) | benign(0.191) | TCGA-EA-A3HS-01 | Cervix | cervical & endocervical cancer | Female | <65 | I/II | Unknown | Unknown | SD |
| TRIL | SNV | Missense_Mutation | novel | c.2303N>A | p.Arg768His | p.R768H | Q7L0X0 | protein_coding | deleterious(0.01) | possibly_damaging(0.899) | TCGA-JW-A5VG-01 | Cervix | cervical & endocervical cancer | Female | <65 | I/II | Chemotherapy | cisplatin | SD |
| TRIL | SNV | Missense_Mutation | novel | c.1358N>C | p.Gln453Pro | p.Q453P | Q7L0X0 | protein_coding | tolerated(0.14) | benign(0.149) | TCGA-Q1-A6DV-01 | Cervix | cervical & endocervical cancer | Female | <65 | I/II | Unknown | Unknown | SD |
| TRIL | SNV | Missense_Mutation | novel | c.102N>T | p.Gln34His | p.Q34H | Q7L0X0 | protein_coding | deleterious(0.03) | benign(0.158) | TCGA-5M-AAT6-01 | Colorectum | colon adenocarcinoma | Female | <65 | III/IV | Unknown | Unknown | PD |
| TRIL | SNV | Missense_Mutation | rs369164887 | c.740N>A | p.Arg247His | p.R247H | Q7L0X0 | protein_coding | tolerated(0.33) | benign(0.015) | TCGA-AA-A01P-01 | Colorectum | colon adenocarcinoma | Female | >=65 | III/IV | Unknown | Unknown | PD |
| TRIL | SNV | Missense_Mutation | novel | c.839N>A | p.Arg280His | p.R280H | Q7L0X0 | protein_coding | deleterious(0) | probably_damaging(0.988) | TCGA-AD-6895-01 | Colorectum | colon adenocarcinoma | Male | >=65 | III/IV | Unknown | Unknown | SD |
| TRIL | SNV | Missense_Mutation | novel | c.286N>A | p.Arg96Ser | p.R96S | Q7L0X0 | protein_coding | deleterious(0.03) | benign(0.189) | TCGA-AM-5821-01 | Colorectum | colon adenocarcinoma | Female | >=65 | I/II | Unknown | Unknown | SD |
| Page: 1 2 3 4 5 6 |
Top |
Related drugs of malignant transformation related genes |
| Identification of chemicals and drugs interact with genes involved in malignant transfromation |
| (DGIdb 4.0) |
| Entrez ID | Symbol | Category | Interaction Types | Drug Claim Name | Drug Name | PMIDs |
| Page: 1 |

Copyright 2023-Present -The University of Texas Health Science Center at Houston |