
|
|||||
|
 | |
| |
| |
| |
| |
| |
|
Gene: TRIB3 |
Gene summary for TRIB3 |
| Gene information | Species | Human | Gene symbol | TRIB3 | Gene ID | 57761 |
| Gene name | tribbles pseudokinase 3 | |
| Gene Alias | C20orf97 | |
| Cytomap | 20p13 | |
| Gene Type | protein-coding | GO ID | GO:0000122 | UniProtAcc | Q96RU7 |
Top |
Malignant transformation analysis |
| Identification of the aberrant gene expression in precancerous and cancerous lesions by comparing the gene expression of stem-like cells in diseased tissues with normal stem cells |
| Entrez ID | Symbol | Replicates | Species | Organ | Tissue | Adj P-value | Log2FC | Malignancy |
| 57761 | TRIB3 | P2T-E | Human | Esophagus | ESCC | 3.92e-11 | 7.70e-01 | 0.1177 |
| 57761 | TRIB3 | P4T-E | Human | Esophagus | ESCC | 1.28e-11 | 7.00e-01 | 0.1323 |
| 57761 | TRIB3 | P5T-E | Human | Esophagus | ESCC | 1.10e-06 | 2.20e-01 | 0.1327 |
| 57761 | TRIB3 | P9T-E | Human | Esophagus | ESCC | 7.43e-07 | 2.11e-01 | 0.1131 |
| 57761 | TRIB3 | P10T-E | Human | Esophagus | ESCC | 2.67e-09 | 2.54e-01 | 0.116 |
| 57761 | TRIB3 | P12T-E | Human | Esophagus | ESCC | 1.60e-10 | 4.09e-01 | 0.1122 |
| 57761 | TRIB3 | P16T-E | Human | Esophagus | ESCC | 2.12e-17 | 5.07e-01 | 0.1153 |
| 57761 | TRIB3 | P17T-E | Human | Esophagus | ESCC | 1.73e-03 | 4.06e-01 | 0.1278 |
| 57761 | TRIB3 | P19T-E | Human | Esophagus | ESCC | 2.33e-03 | 2.91e-01 | 0.1662 |
| 57761 | TRIB3 | P21T-E | Human | Esophagus | ESCC | 2.64e-15 | 5.07e-01 | 0.1617 |
| 57761 | TRIB3 | P22T-E | Human | Esophagus | ESCC | 8.24e-09 | 2.14e-01 | 0.1236 |
| 57761 | TRIB3 | P23T-E | Human | Esophagus | ESCC | 5.83e-08 | 6.45e-01 | 0.108 |
| 57761 | TRIB3 | P24T-E | Human | Esophagus | ESCC | 5.58e-24 | 9.36e-01 | 0.1287 |
| 57761 | TRIB3 | P26T-E | Human | Esophagus | ESCC | 1.03e-13 | 3.35e-01 | 0.1276 |
| 57761 | TRIB3 | P28T-E | Human | Esophagus | ESCC | 6.64e-14 | 4.67e-01 | 0.1149 |
| 57761 | TRIB3 | P31T-E | Human | Esophagus | ESCC | 3.50e-03 | 2.66e-01 | 0.1251 |
| 57761 | TRIB3 | P32T-E | Human | Esophagus | ESCC | 3.19e-13 | 6.78e-01 | 0.1666 |
| 57761 | TRIB3 | P36T-E | Human | Esophagus | ESCC | 7.17e-11 | 8.90e-01 | 0.1187 |
| 57761 | TRIB3 | P37T-E | Human | Esophagus | ESCC | 2.01e-08 | 2.93e-01 | 0.1371 |
| 57761 | TRIB3 | P38T-E | Human | Esophagus | ESCC | 3.02e-07 | 4.74e-01 | 0.127 |
| Page: 1 2 3 4 |
| Tissue | Expression Dynamics | Abbreviation |
| Esophagus |  | ESCC: Esophageal squamous cell carcinoma |
| HGIN: High-grade intraepithelial neoplasias | ||
| LGIN: Low-grade intraepithelial neoplasias | ||
| Liver | 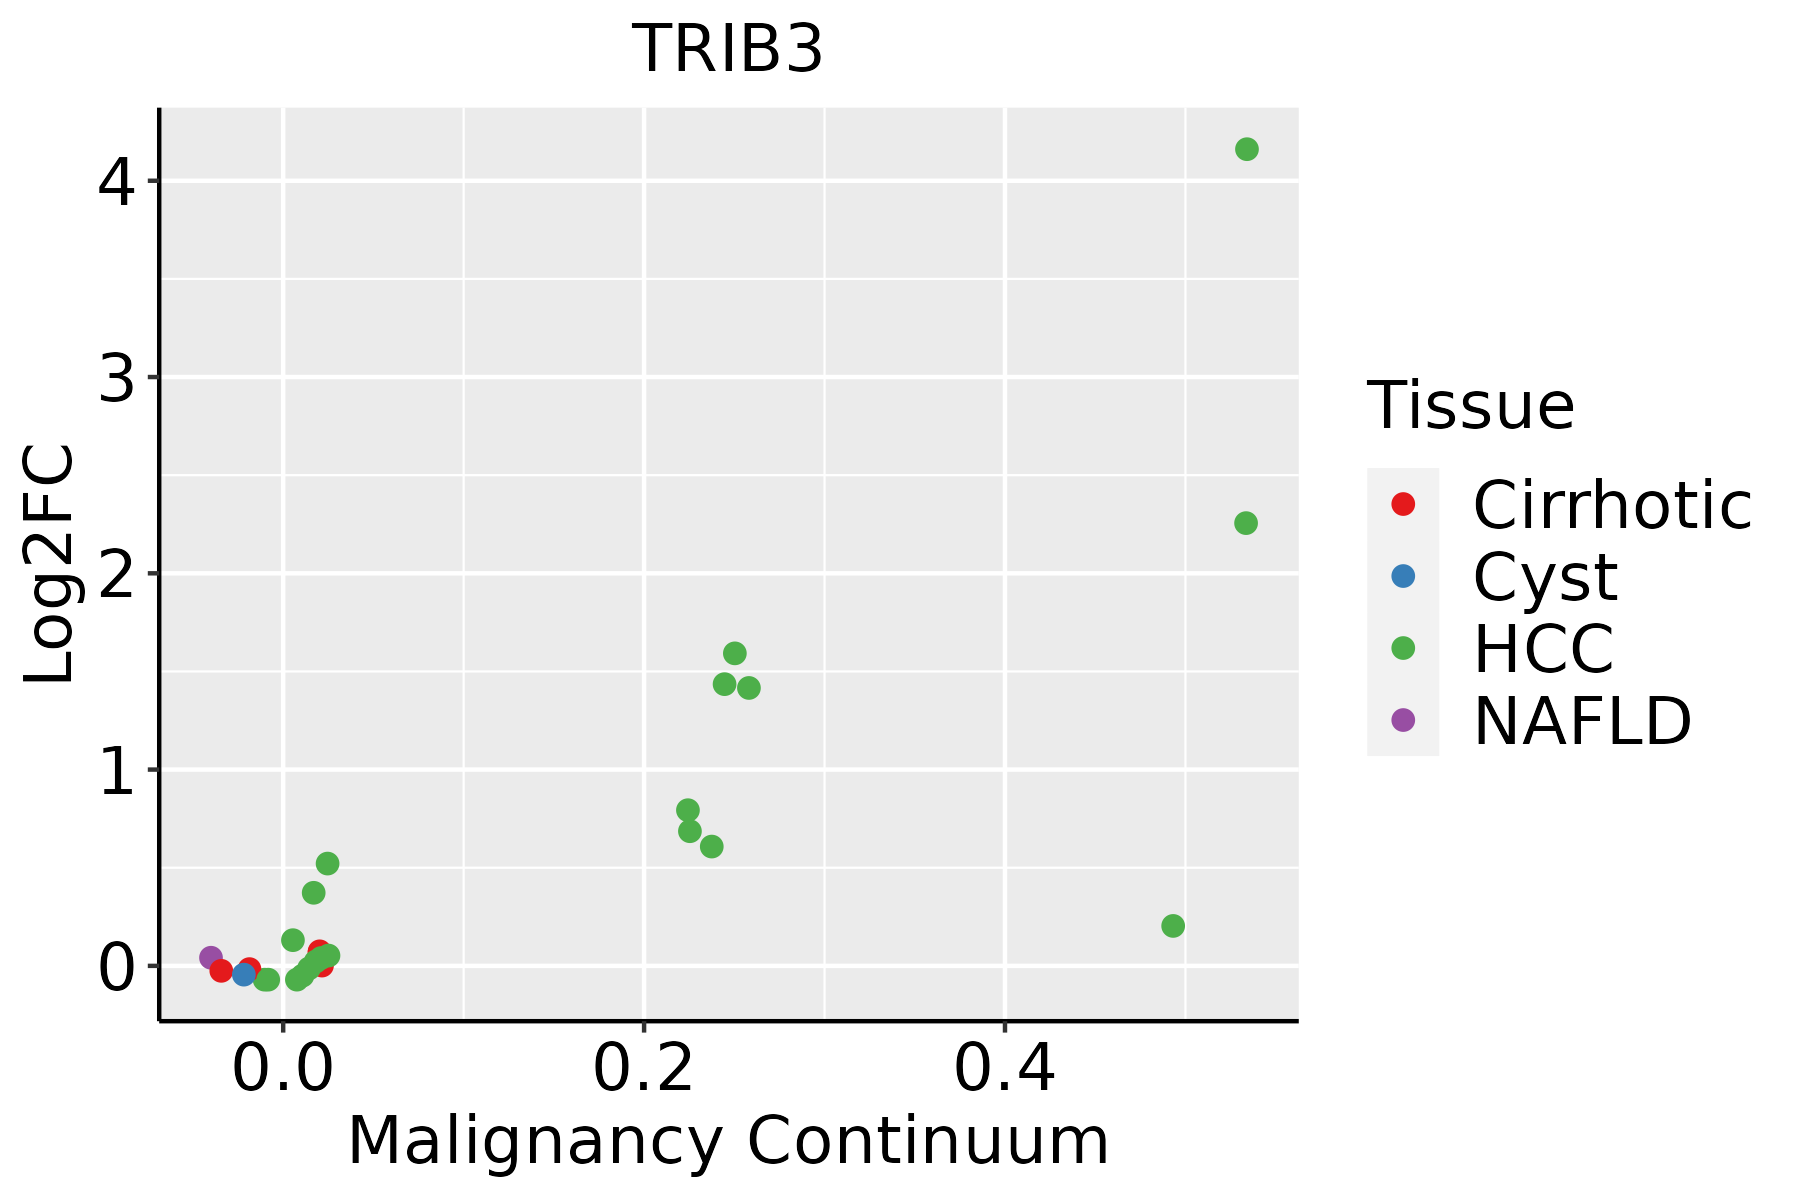 | HCC: Hepatocellular carcinoma |
| NAFLD: Non-alcoholic fatty liver disease | ||
| Oral Cavity |  | EOLP: Erosive Oral lichen planus |
| LP: leukoplakia | ||
| NEOLP: Non-erosive oral lichen planus | ||
| OSCC: Oral squamous cell carcinoma | ||
| Thyroid | 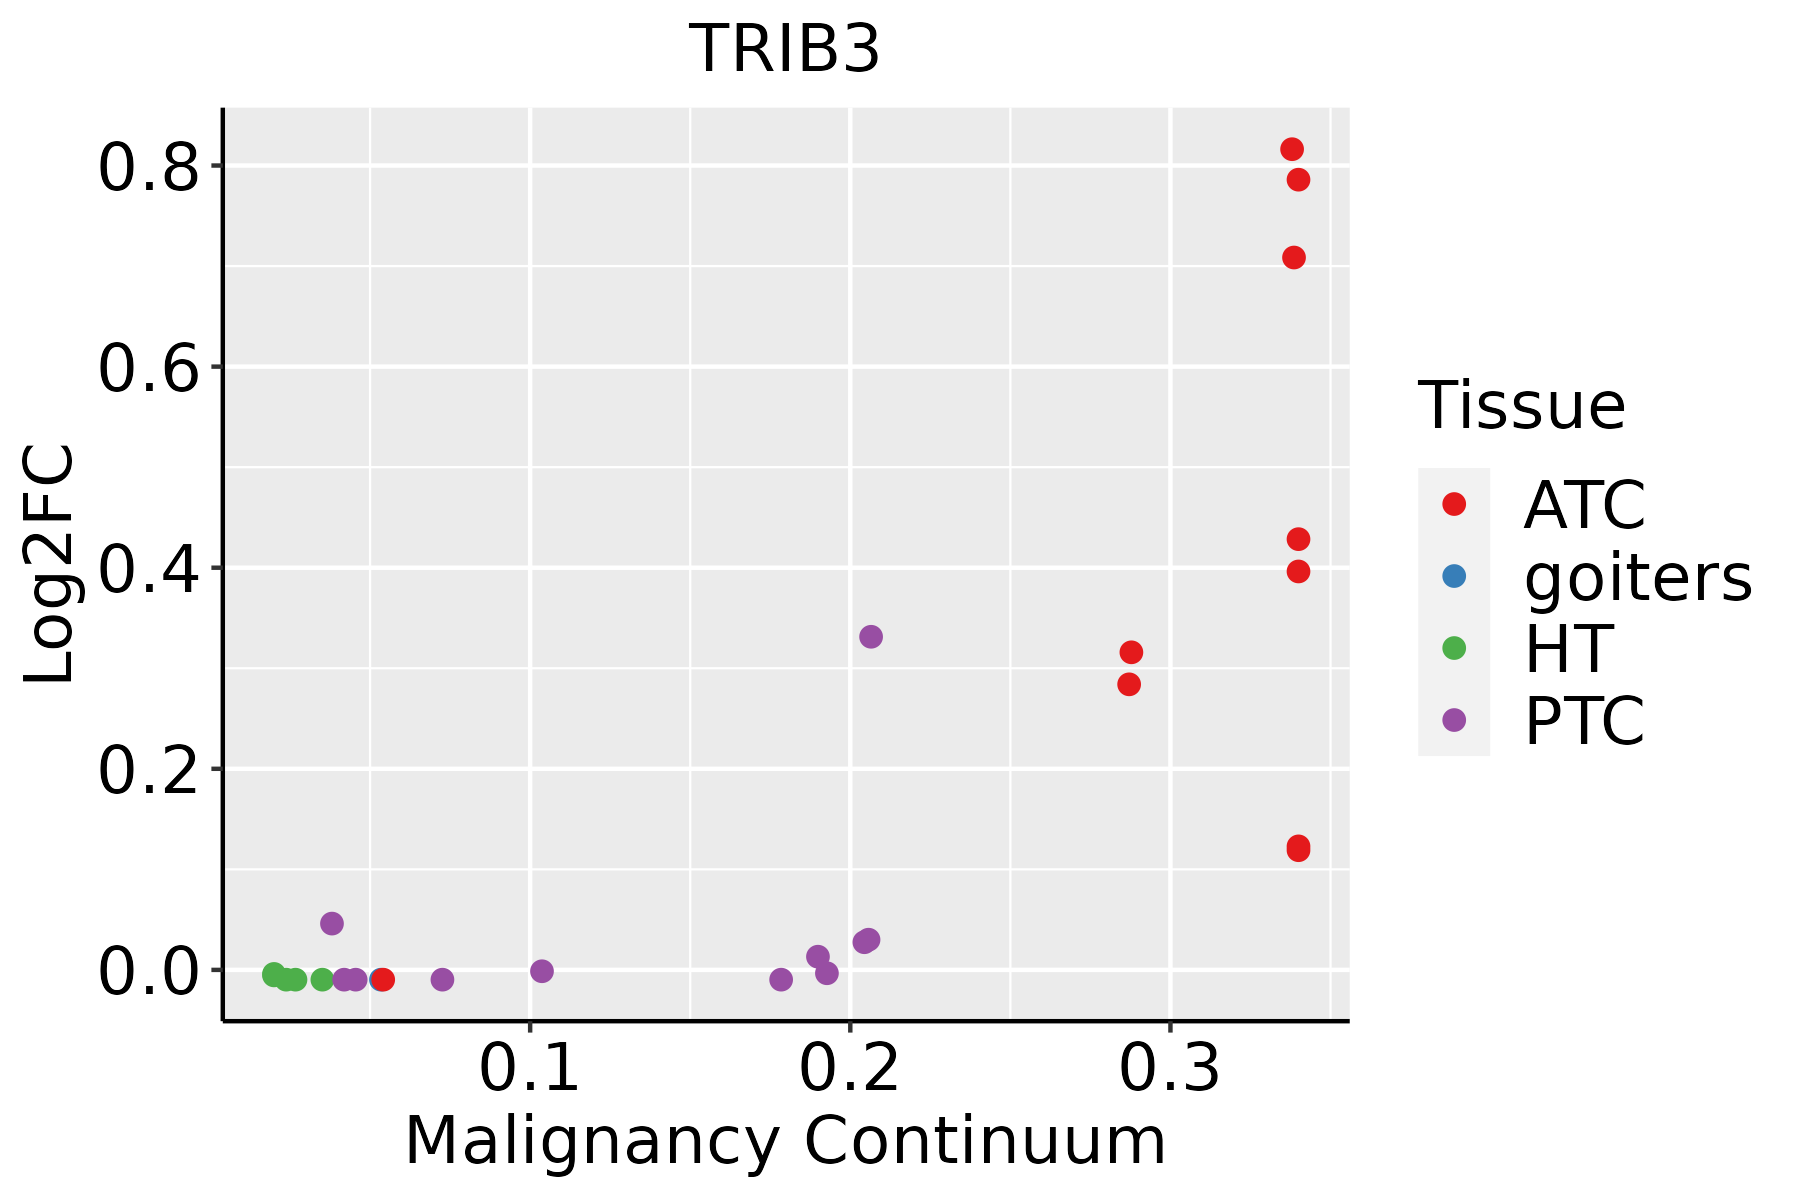 | ATC: Anaplastic thyroid cancer |
| HT: Hashimoto's thyroiditis | ||
| PTC: Papillary thyroid cancer |
| ∗log2FC in expression of this searched gene in stem-like cells from each diseased tissue sample relative to stem-like cells in normal samples in each tissue plotted against the malignancy continuum. Samples are colored based on if they are from different disease stage. |
Top |
Malignant transformation related pathway analysis |
| Find out the enriched GO biological processes and KEGG pathways involved in transition from healthy to precancer to cancer |
| Tissue | Disease Stage | Enriched GO biological Processes |
| Colorectum | AD |  |
| Colorectum | SER |  |
| Colorectum | MSS |  |
| Colorectum | MSI-H |  |
| Colorectum | FAP |  |
| ∗Top 15 enriched GO BP terms are showed in the bar plot of each disease state in each tissue. Each row represents a significant GO biological process which is colored according to the -log10(p.adjust). |
| Page: 1 2 3 4 5 6 7 8 9 |
| GO ID | Tissue | Disease Stage | Description | Gene Ratio | Bg Ratio | pvalue | p.adjust | Count |
| GO:0010498111 | Esophagus | ESCC | proteasomal protein catabolic process | 369/8552 | 490/18723 | 1.13e-41 | 1.80e-38 | 369 |
| GO:0043161111 | Esophagus | ESCC | proteasome-mediated ubiquitin-dependent protein catabolic process | 312/8552 | 412/18723 | 3.53e-36 | 4.48e-33 | 312 |
| GO:0097193111 | Esophagus | ESCC | intrinsic apoptotic signaling pathway | 222/8552 | 288/18723 | 5.87e-28 | 2.02e-25 | 222 |
| GO:0042176111 | Esophagus | ESCC | regulation of protein catabolic process | 280/8552 | 391/18723 | 8.65e-26 | 2.39e-23 | 280 |
| GO:0009896111 | Esophagus | ESCC | positive regulation of catabolic process | 332/8552 | 492/18723 | 4.36e-23 | 9.22e-21 | 332 |
| GO:0034976111 | Esophagus | ESCC | response to endoplasmic reticulum stress | 192/8552 | 256/18723 | 7.15e-22 | 1.30e-19 | 192 |
| GO:0031331111 | Esophagus | ESCC | positive regulation of cellular catabolic process | 292/8552 | 427/18723 | 8.67e-22 | 1.53e-19 | 292 |
| GO:1903320111 | Esophagus | ESCC | regulation of protein modification by small protein conjugation or removal | 181/8552 | 242/18723 | 1.80e-20 | 2.60e-18 | 181 |
| GO:1903362111 | Esophagus | ESCC | regulation of cellular protein catabolic process | 188/8552 | 255/18723 | 5.12e-20 | 6.62e-18 | 188 |
| GO:0051098111 | Esophagus | ESCC | regulation of binding | 251/8552 | 363/18723 | 6.73e-20 | 8.46e-18 | 251 |
| GO:0045862111 | Esophagus | ESCC | positive regulation of proteolysis | 256/8552 | 372/18723 | 7.88e-20 | 9.43e-18 | 256 |
| GO:001050617 | Esophagus | ESCC | regulation of autophagy | 220/8552 | 317/18723 | 6.72e-18 | 6.36e-16 | 220 |
| GO:1903050111 | Esophagus | ESCC | regulation of proteolysis involved in cellular protein catabolic process | 163/8552 | 221/18723 | 1.44e-17 | 1.27e-15 | 163 |
| GO:0061136111 | Esophagus | ESCC | regulation of proteasomal protein catabolic process | 142/8552 | 187/18723 | 2.40e-17 | 2.00e-15 | 142 |
| GO:0045732111 | Esophagus | ESCC | positive regulation of protein catabolic process | 167/8552 | 231/18723 | 1.47e-16 | 1.14e-14 | 167 |
| GO:0031396111 | Esophagus | ESCC | regulation of protein ubiquitination | 154/8552 | 210/18723 | 2.70e-16 | 2.04e-14 | 154 |
| GO:0032434111 | Esophagus | ESCC | regulation of proteasomal ubiquitin-dependent protein catabolic process | 107/8552 | 134/18723 | 4.06e-16 | 2.93e-14 | 107 |
| GO:2000058111 | Esophagus | ESCC | regulation of ubiquitin-dependent protein catabolic process | 125/8552 | 164/18723 | 1.17e-15 | 7.76e-14 | 125 |
| GO:1903364111 | Esophagus | ESCC | positive regulation of cellular protein catabolic process | 117/8552 | 155/18723 | 3.25e-14 | 1.66e-12 | 117 |
| GO:1901800110 | Esophagus | ESCC | positive regulation of proteasomal protein catabolic process | 91/8552 | 114/18723 | 6.74e-14 | 3.34e-12 | 91 |
| Page: 1 2 3 4 5 6 7 8 9 10 11 12 13 |
| Pathway ID | Tissue | Disease Stage | Description | Gene Ratio | Bg Ratio | pvalue | p.adjust | qvalue | Count |
| hsa049318 | Esophagus | ESCC | Insulin resistance | 69/4205 | 108/8465 | 1.92e-03 | 5.54e-03 | 2.84e-03 | 69 |
| hsa0493113 | Esophagus | ESCC | Insulin resistance | 69/4205 | 108/8465 | 1.92e-03 | 5.54e-03 | 2.84e-03 | 69 |
| hsa0493121 | Liver | HCC | Insulin resistance | 77/4020 | 108/8465 | 3.89e-07 | 4.46e-06 | 2.48e-06 | 77 |
| hsa0493131 | Liver | HCC | Insulin resistance | 77/4020 | 108/8465 | 3.89e-07 | 4.46e-06 | 2.48e-06 | 77 |
| hsa049317 | Oral cavity | OSCC | Insulin resistance | 60/3704 | 108/8465 | 8.66e-03 | 1.97e-02 | 1.00e-02 | 60 |
| hsa0493112 | Oral cavity | OSCC | Insulin resistance | 60/3704 | 108/8465 | 8.66e-03 | 1.97e-02 | 1.00e-02 | 60 |
| Page: 1 |
Top |
Cell-cell communication analysis |
| Identification of potential cell-cell interactions between two cell types and their ligand-receptor pairs for different disease states |
| Ligand | Receptor | LRpair | Pathway | Tissue | Disease Stage |
| Page: 1 |
Top |
Single-cell gene regulatory network inference analysis |
| Find out the significant the regulons (TFs) and the target genes of each regulon across cell types for different disease states |
| TF | Cell Type | Tissue | Disease Stage | Target Gene | RSS | Regulon Activity |
| ∗The dot plots of a searched regulon are shown for all cell subpopulations in each disease state of each tissue based on the regulon specific score inferred using pySCENIC and by calculating the average expression. |
| Page: 1 |
Top |
Somatic mutation of malignant transformation related genes |
| Annotation of somatic variants for genes involved in malignant transformation |
| Hugo Symbol | Variant Class | Variant Classification | dbSNP RS | HGVSc | HGVSp | HGVSp Short | SWISSPROT | BIOTYPE | SIFT | PolyPhen | Tumor Sample Barcode | Tissue | Histology | Sex | Age | Stage | Therapy Types | Drugs | Outcome |
| TRIB3 | SNV | Missense_Mutation | c.177N>C | p.Gln59His | p.Q59H | protein_coding | tolerated(0.11) | benign(0.007) | TCGA-BH-A0W7-01 | Breast | breast invasive carcinoma | Female | <65 | I/II | Chemotherapy | taxotere | CR | ||
| TRIB3 | insertion | Frame_Shift_Ins | rs779981558 | c.238_239insTT | p.Pro80LeufsTer158 | p.P80Lfs*158 | protein_coding | TCGA-AC-A3QQ-01 | Breast | breast invasive carcinoma | Female | <65 | I/II | Unknown | Unknown | SD | |||
| TRIB3 | insertion | In_Frame_Ins | novel | c.761_762insCTTTTC | p.Gly254_Pro255insPheSer | p.G254_P255insFS | protein_coding | TCGA-AN-A041-01 | Breast | breast invasive carcinoma | Female | <65 | I/II | Unknown | Unknown | SD | |||
| TRIB3 | insertion | Frame_Shift_Ins | novel | c.762_763insTTAAAATACAATT | p.Pro255LeufsTer6 | p.P255Lfs*6 | protein_coding | TCGA-AN-A041-01 | Breast | breast invasive carcinoma | Female | <65 | I/II | Unknown | Unknown | SD | |||
| TRIB3 | insertion | Frame_Shift_Ins | novel | c.143_144insTCCCCTGCTGAAATCCTTCA | p.Leu48PhefsTer12 | p.L48Ffs*12 | protein_coding | TCGA-BH-A0B1-01 | Breast | breast invasive carcinoma | Female | >=65 | I/II | Chemotherapy | adriamycin | SD | |||
| TRIB3 | SNV | Missense_Mutation | c.897N>C | p.Lys299Asn | p.K299N | protein_coding | deleterious(0) | probably_damaging(0.998) | TCGA-EK-A2PG-01 | Cervix | cervical & endocervical cancer | Female | >=65 | I/II | Unknown | Unknown | SD | ||
| TRIB3 | SNV | Missense_Mutation | rs753115173 | c.808N>A | p.Asp270Asn | p.D270N | protein_coding | deleterious(0) | probably_damaging(0.969) | TCGA-EX-A8YF-01 | Cervix | cervical & endocervical cancer | Female | <65 | I/II | Unknown | Unknown | PD | |
| TRIB3 | SNV | Missense_Mutation | c.454N>A | p.Glu152Lys | p.E152K | protein_coding | deleterious(0.02) | possibly_damaging(0.786) | TCGA-JW-A5VL-01 | Cervix | cervical & endocervical cancer | Female | <65 | I/II | Unknown | Unknown | SD | ||
| TRIB3 | SNV | Missense_Mutation | c.734N>G | p.Asp245Gly | p.D245G | protein_coding | deleterious(0) | possibly_damaging(0.781) | TCGA-AA-3663-01 | Colorectum | colon adenocarcinoma | Male | <65 | I/II | Unknown | Unknown | SD | ||
| TRIB3 | SNV | Missense_Mutation | rs142361535 | c.167N>A | p.Arg56His | p.R56H | protein_coding | tolerated(0.54) | benign(0) | TCGA-AZ-4313-01 | Colorectum | colon adenocarcinoma | Female | <65 | I/II | Unknown | Unknown | SD |
| Page: 1 2 3 4 5 |
Top |
Related drugs of malignant transformation related genes |
| Identification of chemicals and drugs interact with genes involved in malignant transfromation |
| (DGIdb 4.0) |
| Entrez ID | Symbol | Category | Interaction Types | Drug Claim Name | Drug Name | PMIDs |
| 57761 | TRIB3 | DRUGGABLE GENOME, ENZYME, TRANSCRIPTION FACTOR, KINASE, SERINE THREONINE KINASE | methylphenidate | METHYLPHENIDATE | 29382897 |
| Page: 1 |

Copyright 2023-Present -The University of Texas Health Science Center at Houston |