
|
|||||
|
 | |
| |
| |
| |
| |
| |
|
Gene: TRH |
Gene summary for TRH |
| Gene information | Species | Human | Gene symbol | TRH | Gene ID | 7200 |
| Gene name | thyrotropin releasing hormone | |
| Gene Alias | Pro-TRH | |
| Cytomap | 3q22.1 | |
| Gene Type | protein-coding | GO ID | GO:0001666 | UniProtAcc | P20396 |
Top |
Malignant transformation analysis |
| Identification of the aberrant gene expression in precancerous and cancerous lesions by comparing the gene expression of stem-like cells in diseased tissues with normal stem cells |
| Entrez ID | Symbol | Replicates | Species | Organ | Tissue | Adj P-value | Log2FC | Malignancy |
| 7200 | TRH | GSM4909297 | Human | Breast | IDC | 1.87e-24 | 7.14e-01 | 0.1517 |
| 7200 | TRH | GSM4909320 | Human | Breast | IDC | 2.92e-12 | 6.62e-01 | 0.1575 |
| 7200 | TRH | M1 | Human | Breast | IDC | 7.64e-09 | 2.28e-01 | 0.1577 |
| 7200 | TRH | NCCBC2 | Human | Breast | DCIS | 1.47e-18 | 1.16e+00 | 0.1554 |
| 7200 | TRH | P1 | Human | Breast | IDC | 4.28e-02 | 2.23e-01 | 0.1527 |
| 7200 | TRH | AEH-subject3 | Human | Endometrium | AEH | 2.81e-09 | 4.86e-01 | -0.2576 |
| 7200 | TRH | AEH-subject4 | Human | Endometrium | AEH | 1.44e-03 | -1.63e-01 | -0.2657 |
| 7200 | TRH | AEH-subject5 | Human | Endometrium | AEH | 1.88e-08 | -1.63e-01 | -0.2953 |
| 7200 | TRH | EEC-subject1 | Human | Endometrium | EEC | 4.07e-08 | -1.61e-01 | -0.2682 |
| 7200 | TRH | EEC-subject2 | Human | Endometrium | EEC | 1.32e-04 | -1.41e-01 | -0.2607 |
| 7200 | TRH | EEC-subject4 | Human | Endometrium | EEC | 4.07e-08 | -1.63e-01 | -0.2571 |
| 7200 | TRH | GSM5276935 | Human | Endometrium | EEC | 1.88e-08 | -1.63e-01 | -0.123 |
| 7200 | TRH | GSM6177620_NYU_UCEC1_lib1_lib1 | Human | Endometrium | EEC | 6.26e-04 | -1.63e-01 | -0.1869 |
| 7200 | TRH | GSM6177620_NYU_UCEC1_lib2_lib2 | Human | Endometrium | EEC | 3.37e-03 | -1.63e-01 | -0.1875 |
| 7200 | TRH | GSM6177620_NYU_UCEC1_lib3_lib3 | Human | Endometrium | EEC | 3.64e-04 | -1.63e-01 | -0.1883 |
| 7200 | TRH | GSM6177621_NYU_UCEC2_lib1_lib1 | Human | Endometrium | EEC | 1.88e-08 | -1.63e-01 | -0.1934 |
| 7200 | TRH | GSM6177622_NYU_UCEC3_lib1_lib1 | Human | Endometrium | EEC | 4.01e-09 | -1.63e-01 | -0.1917 |
| 7200 | TRH | GSM6177622_NYU_UCEC3_lib2_lib2 | Human | Endometrium | EEC | 3.40e-06 | -1.63e-01 | -0.1916 |
| 7200 | TRH | GSM6177623_NYU_UCEC3_Vis | Human | Endometrium | EEC | 4.07e-08 | -1.63e-01 | -0.1269 |
| Page: 1 |
| Tissue | Expression Dynamics | Abbreviation |
| Breast |  | IDC: Invasive ductal carcinoma |
| DCIS: Ductal carcinoma in situ | ||
| Precancer(BRCA1-mut): Precancerous lesion from BRCA1 mutation carriers | ||
| Endometrium | 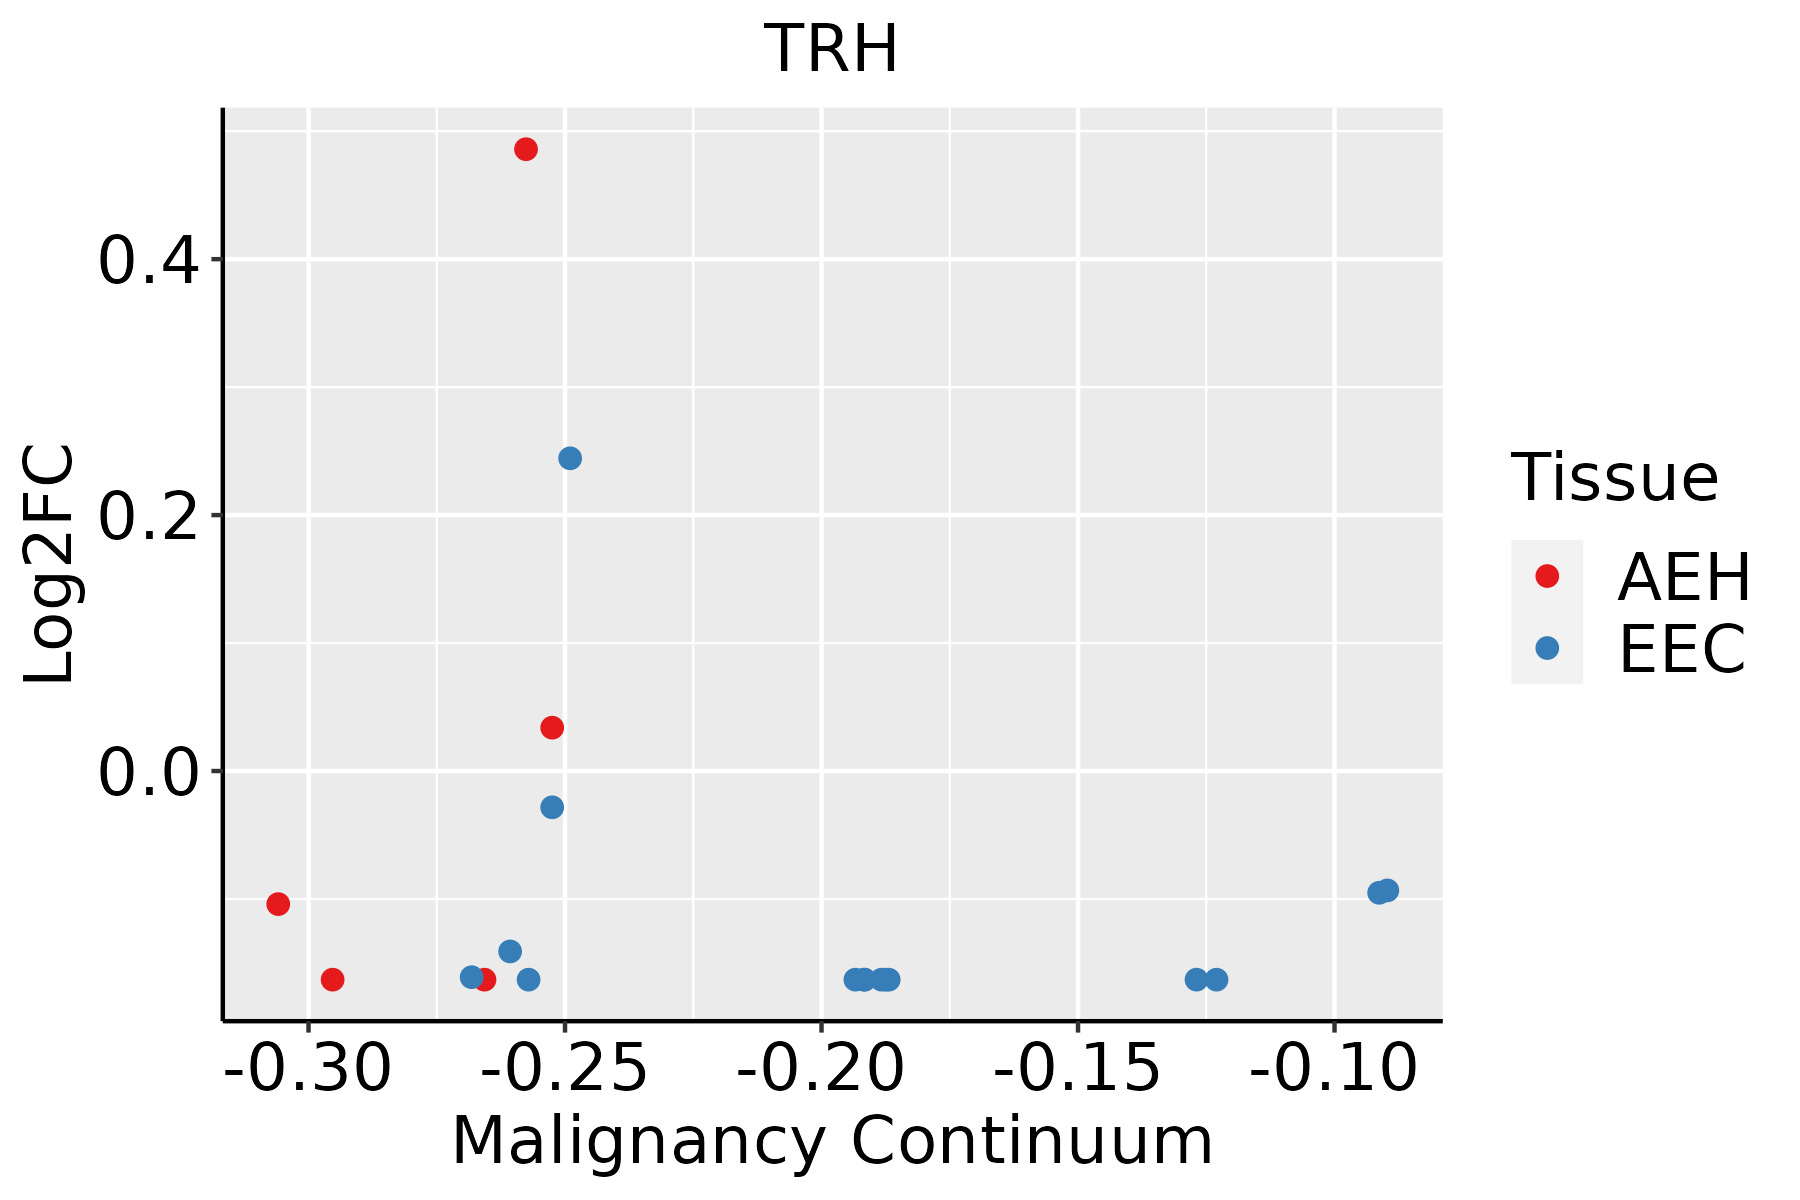 | AEH: Atypical endometrial hyperplasia |
| EEC: Endometrioid Cancer |
| ∗log2FC in expression of this searched gene in stem-like cells from each diseased tissue sample relative to stem-like cells in normal samples in each tissue plotted against the malignancy continuum. Samples are colored based on if they are from different disease stage. |
Top |
Malignant transformation related pathway analysis |
| Find out the enriched GO biological processes and KEGG pathways involved in transition from healthy to precancer to cancer |
| Tissue | Disease Stage | Enriched GO biological Processes |
| Colorectum | AD |  |
| Colorectum | SER |  |
| Colorectum | MSS |  |
| Colorectum | MSI-H |  |
| Colorectum | FAP |  |
| ∗Top 15 enriched GO BP terms are showed in the bar plot of each disease state in each tissue. Each row represents a significant GO biological process which is colored according to the -log10(p.adjust). |
| Page: 1 2 3 4 5 6 7 8 9 |
| GO ID | Tissue | Disease Stage | Description | Gene Ratio | Bg Ratio | pvalue | p.adjust | Count |
| GO:004854514 | Breast | IDC | response to steroid hormone | 70/1434 | 339/18723 | 1.34e-14 | 4.23e-12 | 70 |
| GO:007048214 | Breast | IDC | response to oxygen levels | 64/1434 | 347/18723 | 3.45e-11 | 5.57e-09 | 64 |
| GO:003629314 | Breast | IDC | response to decreased oxygen levels | 60/1434 | 322/18723 | 9.26e-11 | 1.25e-08 | 60 |
| GO:000166614 | Breast | IDC | response to hypoxia | 58/1434 | 307/18723 | 1.09e-10 | 1.38e-08 | 58 |
| GO:003196013 | Breast | IDC | response to corticosteroid | 37/1434 | 167/18723 | 3.10e-09 | 2.63e-07 | 37 |
| GO:005138413 | Breast | IDC | response to glucocorticoid | 32/1434 | 148/18723 | 6.52e-08 | 4.07e-06 | 32 |
| GO:000926612 | Breast | IDC | response to temperature stimulus | 34/1434 | 178/18723 | 5.88e-07 | 2.83e-05 | 34 |
| GO:190165414 | Breast | IDC | response to ketone | 33/1434 | 194/18723 | 1.17e-05 | 3.13e-04 | 33 |
| GO:003428414 | Breast | IDC | response to monosaccharide | 36/1434 | 225/18723 | 1.94e-05 | 4.83e-04 | 36 |
| GO:000974314 | Breast | IDC | response to carbohydrate | 38/1434 | 253/18723 | 4.87e-05 | 1.07e-03 | 38 |
| GO:190495113 | Breast | IDC | positive regulation of establishment of protein localization | 45/1434 | 319/18723 | 5.01e-05 | 1.09e-03 | 45 |
| GO:000940912 | Breast | IDC | response to cold | 13/1434 | 49/18723 | 5.70e-05 | 1.20e-03 | 13 |
| GO:000974613 | Breast | IDC | response to hexose | 33/1434 | 219/18723 | 1.39e-04 | 2.49e-03 | 33 |
| GO:009730514 | Breast | IDC | response to alcohol | 36/1434 | 253/18723 | 2.29e-04 | 3.64e-03 | 36 |
| GO:005138511 | Breast | IDC | response to mineralocorticoid | 10/1434 | 36/18723 | 2.70e-04 | 4.18e-03 | 10 |
| GO:000974913 | Breast | IDC | response to glucose | 31/1434 | 212/18723 | 3.75e-04 | 5.35e-03 | 31 |
| GO:005122213 | Breast | IDC | positive regulation of protein transport | 40/1434 | 303/18723 | 5.14e-04 | 6.70e-03 | 40 |
| GO:005070812 | Breast | IDC | regulation of protein secretion | 36/1434 | 268/18723 | 6.93e-04 | 8.50e-03 | 36 |
| GO:005141211 | Breast | IDC | response to corticosterone | 7/1434 | 22/18723 | 9.31e-04 | 1.06e-02 | 7 |
| GO:00432703 | Breast | IDC | positive regulation of ion transport | 36/1434 | 275/18723 | 1.11e-03 | 1.22e-02 | 36 |
| Page: 1 2 3 4 5 6 |
| Pathway ID | Tissue | Disease Stage | Description | Gene Ratio | Bg Ratio | pvalue | p.adjust | qvalue | Count |
| Page: 1 |
Top |
Cell-cell communication analysis |
| Identification of potential cell-cell interactions between two cell types and their ligand-receptor pairs for different disease states |
| Ligand | Receptor | LRpair | Pathway | Tissue | Disease Stage |
| Page: 1 |
Top |
Single-cell gene regulatory network inference analysis |
| Find out the significant the regulons (TFs) and the target genes of each regulon across cell types for different disease states |
| TF | Cell Type | Tissue | Disease Stage | Target Gene | RSS | Regulon Activity |
| ∗The dot plots of a searched regulon are shown for all cell subpopulations in each disease state of each tissue based on the regulon specific score inferred using pySCENIC and by calculating the average expression. |
| Page: 1 |
Top |
Somatic mutation of malignant transformation related genes |
| Annotation of somatic variants for genes involved in malignant transformation |
| Hugo Symbol | Variant Class | Variant Classification | dbSNP RS | HGVSc | HGVSp | HGVSp Short | SWISSPROT | BIOTYPE | SIFT | PolyPhen | Tumor Sample Barcode | Tissue | Histology | Sex | Age | Stage | Therapy Types | Drugs | Outcome |
| TRH | SNV | Missense_Mutation | rs767974066 | c.319N>C | p.Ala107Pro | p.A107P | P20396 | protein_coding | tolerated(0.18) | possibly_damaging(0.9) | TCGA-LL-A740-01 | Breast | breast invasive carcinoma | Female | <65 | I/II | Chemotherapy | adriamycin | CR |
| TRH | deletion | Frame_Shift_Del | c.313delN | p.Ala107LeufsTer23 | p.A107Lfs*23 | P20396 | protein_coding | TCGA-AO-A128-01 | Breast | breast invasive carcinoma | Female | <65 | I/II | Chemotherapy | doxorubicin | SD | |||
| TRH | SNV | Missense_Mutation | c.177N>G | p.Ile59Met | p.I59M | P20396 | protein_coding | deleterious(0.01) | benign(0.099) | TCGA-DR-A0ZM-01 | Cervix | cervical & endocervical cancer | Female | <65 | III/IV | Unspecific | Cisplatin | SD | |
| TRH | insertion | Frame_Shift_Ins | rs770451471 | c.312_313insG | p.Ala107GlyfsTer16 | p.A107Gfs*16 | P20396 | protein_coding | TCGA-VS-A94Z-01 | Cervix | cervical & endocervical cancer | Female | <65 | I/II | Chemotherapy | cisplatin | CR | ||
| TRH | deletion | Frame_Shift_Del | c.313delN | p.Ala107LeufsTer23 | p.A107Lfs*23 | P20396 | protein_coding | TCGA-VS-A9UJ-01 | Cervix | cervical & endocervical cancer | Female | <65 | I/II | Unknown | Unknown | PD | |||
| TRH | SNV | Missense_Mutation | rs13306057 | c.7N>A | p.Gly3Ser | p.G3S | P20396 | protein_coding | tolerated(0.23) | benign(0.001) | TCGA-AA-3663-01 | Colorectum | colon adenocarcinoma | Male | <65 | I/II | Unknown | Unknown | SD |
| TRH | SNV | Missense_Mutation | rs756356142 | c.329C>T | p.Pro110Leu | p.P110L | P20396 | protein_coding | tolerated(1) | benign(0.007) | TCGA-AA-3672-01 | Colorectum | colon adenocarcinoma | Female | >=65 | III/IV | Unknown | Unknown | SD |
| TRH | SNV | Missense_Mutation | c.211N>A | p.Ala71Thr | p.A71T | P20396 | protein_coding | tolerated(0.18) | benign(0.09) | TCGA-AZ-6598-01 | Colorectum | colon adenocarcinoma | Female | >=65 | I/II | Unknown | Unknown | SD | |
| TRH | SNV | Missense_Mutation | c.361G>T | p.Asp121Tyr | p.D121Y | P20396 | protein_coding | deleterious(0) | possibly_damaging(0.905) | TCGA-AG-3892-01 | Colorectum | rectum adenocarcinoma | Female | <65 | I/II | Unknown | Unknown | SD | |
| TRH | SNV | Missense_Mutation | novel | c.577N>A | p.Leu193Met | p.L193M | P20396 | protein_coding | tolerated(0.09) | possibly_damaging(0.588) | TCGA-A5-A1OF-01 | Endometrium | uterine corpus endometrioid carcinoma | Female | <65 | I/II | Unknown | Unknown | SD |
| Page: 1 2 3 4 |
Top |
Related drugs of malignant transformation related genes |
| Identification of chemicals and drugs interact with genes involved in malignant transfromation |
| (DGIdb 4.0) |
| Entrez ID | Symbol | Category | Interaction Types | Drug Claim Name | Drug Name | PMIDs |
| 7200 | TRH | DRUGGABLE GENOME | ERYTHRO | 4219111 | ||
| 7200 | TRH | DRUGGABLE GENOME | 6-AMINONICOTINAMIDE | 6-AMINONICOTINAMIDE | 6240361 | |
| 7200 | TRH | DRUGGABLE GENOME | PHENYTOIN | PHENYTOIN | 6262046 | |
| 7200 | TRH | DRUGGABLE GENOME | KPS-0373 | ROVATIRELIN | ||
| 7200 | TRH | DRUGGABLE GENOME | VINBLASTINE | VINBLASTINE | 6774314 |
| Page: 1 |

Copyright 2023-Present -The University of Texas Health Science Center at Houston |