
|
|||||
|
 | |
| |
| |
| |
| |
| |
|
Gene: TRERF1 |
Gene summary for TRERF1 |
| Gene information | Species | Human | Gene symbol | TRERF1 | Gene ID | 55809 |
| Gene name | transcriptional regulating factor 1 | |
| Gene Alias | BCAR2 | |
| Cytomap | 6p21.1 | |
| Gene Type | protein-coding | GO ID | GO:0006139 | UniProtAcc | Q05GC8 |
Top |
Malignant transformation analysis |
| Identification of the aberrant gene expression in precancerous and cancerous lesions by comparing the gene expression of stem-like cells in diseased tissues with normal stem cells |
| Entrez ID | Symbol | Replicates | Species | Organ | Tissue | Adj P-value | Log2FC | Malignancy |
| 55809 | TRERF1 | CCI_1 | Human | Cervix | CC | 1.56e-12 | 1.12e+00 | 0.528 |
| 55809 | TRERF1 | CCI_2 | Human | Cervix | CC | 4.71e-09 | 1.20e+00 | 0.5249 |
| 55809 | TRERF1 | CCI_3 | Human | Cervix | CC | 2.10e-14 | 1.16e+00 | 0.516 |
| 55809 | TRERF1 | HTA12-25-1 | Human | Pancreas | PDAC | 2.72e-05 | 5.48e-01 | 0.313 |
| 55809 | TRERF1 | HTA12-26-1 | Human | Pancreas | PDAC | 5.52e-05 | 3.34e-01 | 0.3728 |
| 55809 | TRERF1 | HTA12-29-1 | Human | Pancreas | PDAC | 1.09e-21 | 5.17e-01 | 0.3722 |
| 55809 | TRERF1 | HTA12-3-16 | Human | Pancreas | PDAC | 4.67e-03 | 7.62e-01 | 0.1553 |
| 55809 | TRERF1 | ATC12 | Human | Thyroid | ATC | 4.90e-03 | 1.13e-01 | 0.34 |
| 55809 | TRERF1 | ATC13 | Human | Thyroid | ATC | 6.62e-35 | 6.60e-01 | 0.34 |
| 55809 | TRERF1 | ATC4 | Human | Thyroid | ATC | 4.41e-04 | 1.44e-01 | 0.34 |
| 55809 | TRERF1 | ATC5 | Human | Thyroid | ATC | 2.79e-42 | 7.08e-01 | 0.34 |
| Page: 1 |
| Tissue | Expression Dynamics | Abbreviation |
| Cervix | 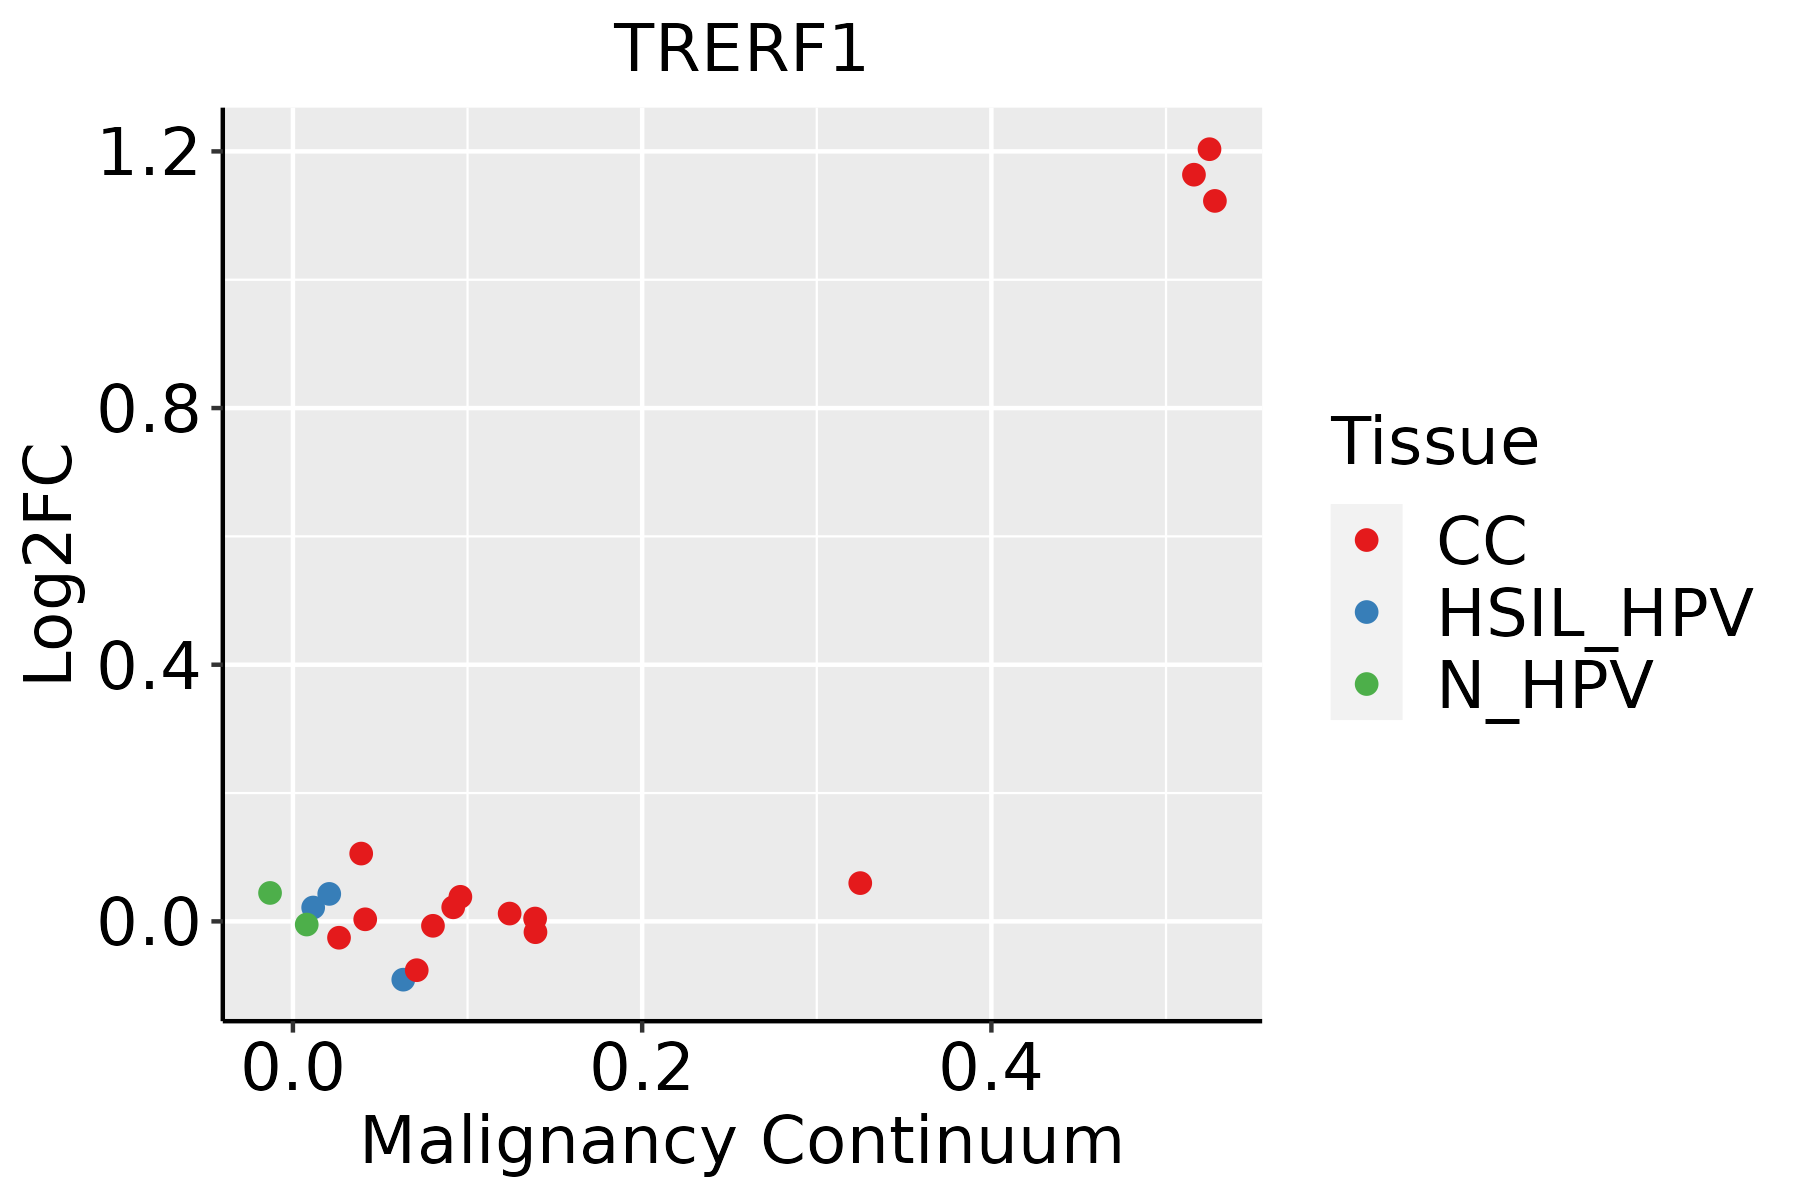 | CC: Cervix cancer |
| HSIL_HPV: HPV-infected high-grade squamous intraepithelial lesions | ||
| N_HPV: HPV-infected normal cervix | ||
| Thyroid | 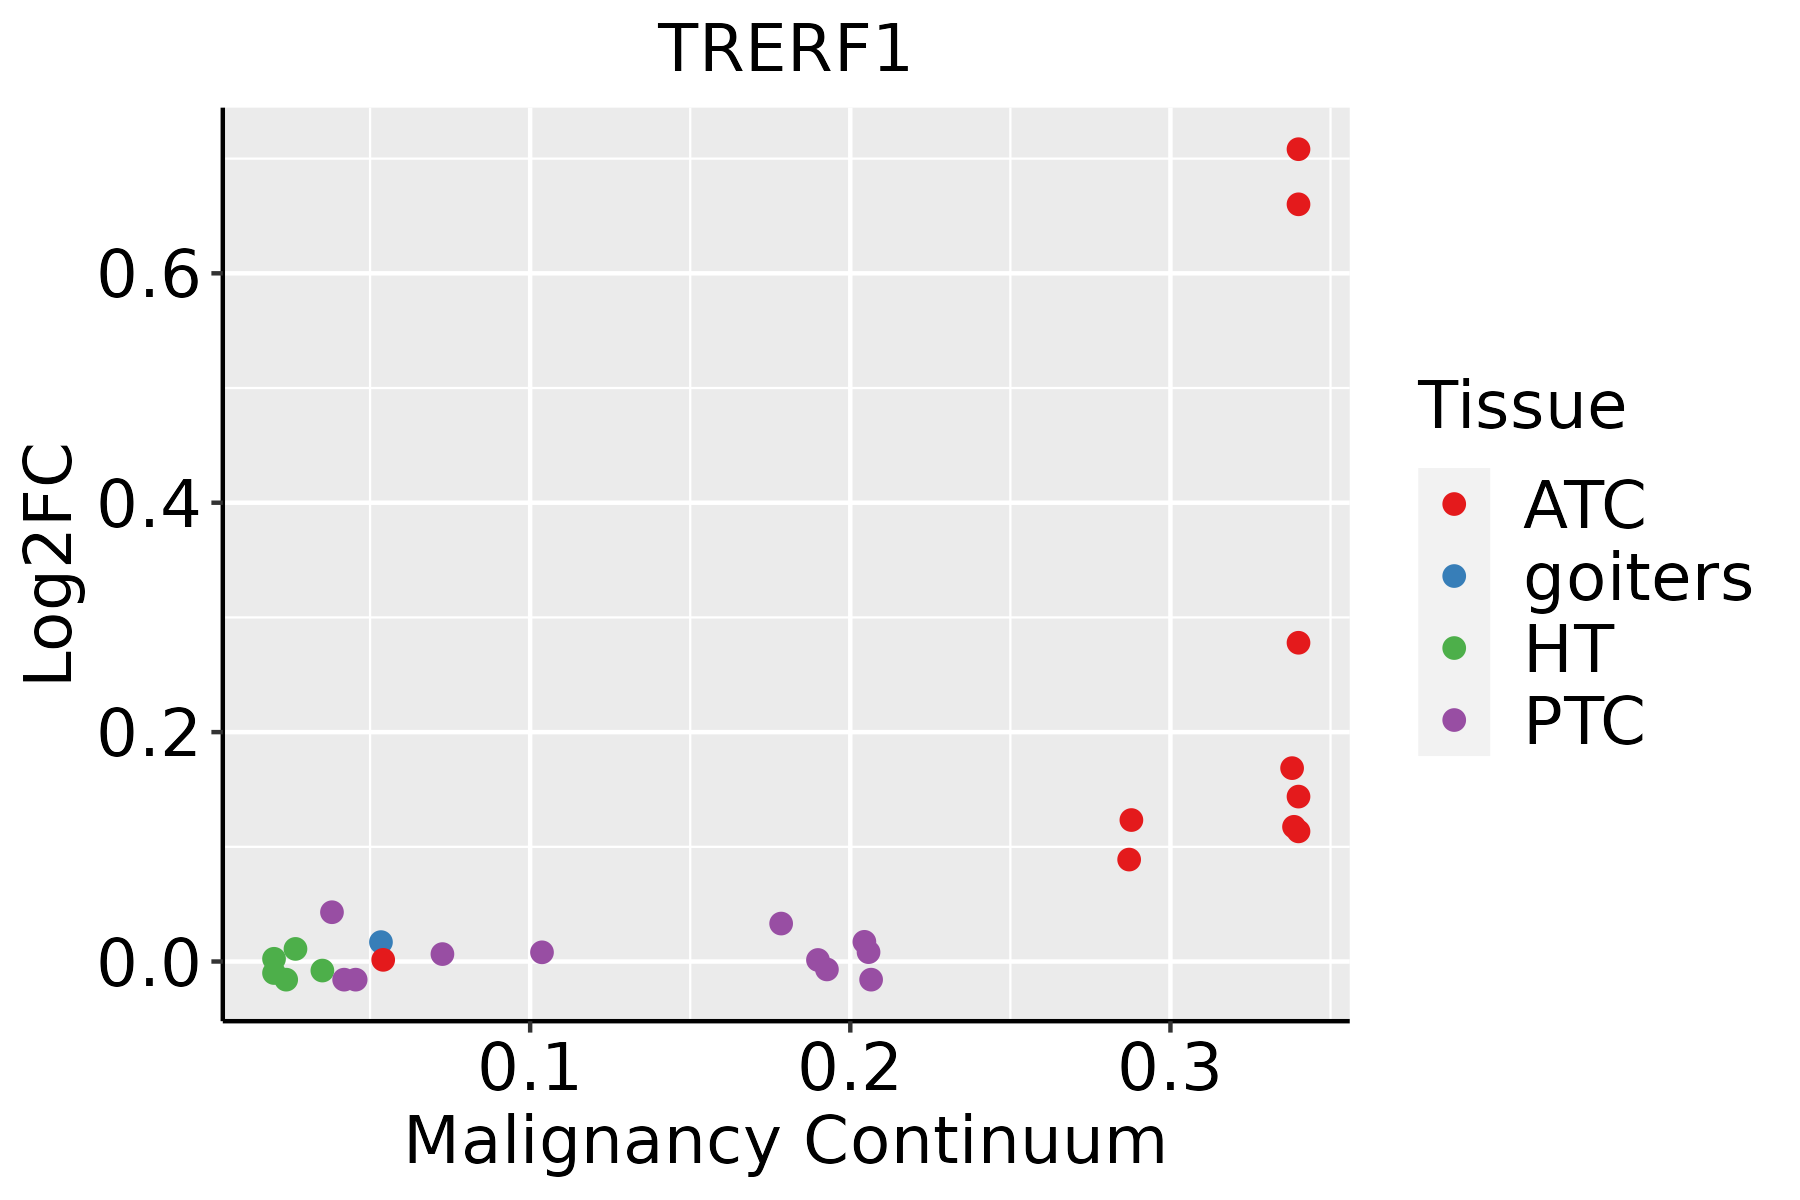 | ATC: Anaplastic thyroid cancer |
| HT: Hashimoto's thyroiditis | ||
| PTC: Papillary thyroid cancer |
| ∗log2FC in expression of this searched gene in stem-like cells from each diseased tissue sample relative to stem-like cells in normal samples in each tissue plotted against the malignancy continuum. Samples are colored based on if they are from different disease stage. |
Top |
Malignant transformation related pathway analysis |
| Find out the enriched GO biological processes and KEGG pathways involved in transition from healthy to precancer to cancer |
| Tissue | Disease Stage | Enriched GO biological Processes |
| Colorectum | AD |  |
| Colorectum | SER |  |
| Colorectum | MSS |  |
| Colorectum | MSI-H |  |
| Colorectum | FAP |  |
| ∗Top 15 enriched GO BP terms are showed in the bar plot of each disease state in each tissue. Each row represents a significant GO biological process which is colored according to the -log10(p.adjust). |
| Page: 1 2 3 4 5 6 7 8 9 |
| GO ID | Tissue | Disease Stage | Description | Gene Ratio | Bg Ratio | pvalue | p.adjust | Count |
| GO:004854510 | Cervix | CC | response to steroid hormone | 74/2311 | 339/18723 | 5.71e-07 | 2.09e-05 | 74 |
| GO:00305229 | Cervix | CC | intracellular receptor signaling pathway | 60/2311 | 265/18723 | 1.89e-06 | 5.97e-05 | 60 |
| GO:190165410 | Cervix | CC | response to ketone | 45/2311 | 194/18723 | 1.83e-05 | 3.44e-04 | 45 |
| GO:00165705 | Cervix | CC | histone modification | 84/2311 | 463/18723 | 1.70e-04 | 2.01e-03 | 84 |
| GO:00325704 | Cervix | CC | response to progesterone | 13/2311 | 37/18723 | 2.99e-04 | 3.21e-03 | 13 |
| GO:00713839 | Cervix | CC | cellular response to steroid hormone stimulus | 40/2311 | 204/18723 | 1.93e-03 | 1.42e-02 | 40 |
| GO:00305188 | Cervix | CC | intracellular steroid hormone receptor signaling pathway | 25/2311 | 116/18723 | 3.59e-03 | 2.30e-02 | 25 |
| GO:001657017 | Thyroid | ATC | histone modification | 243/6293 | 463/18723 | 2.23e-17 | 2.27e-15 | 243 |
| GO:0048545210 | Thyroid | ATC | response to steroid hormone | 168/6293 | 339/18723 | 7.21e-10 | 1.88e-08 | 168 |
| GO:190165427 | Thyroid | ATC | response to ketone | 105/6293 | 194/18723 | 2.96e-09 | 6.96e-08 | 105 |
| GO:0030522112 | Thyroid | ATC | intracellular receptor signaling pathway | 134/6293 | 265/18723 | 7.58e-09 | 1.63e-07 | 134 |
| GO:007138328 | Thyroid | ATC | cellular response to steroid hormone stimulus | 103/6293 | 204/18723 | 4.32e-07 | 6.30e-06 | 103 |
| GO:003051826 | Thyroid | ATC | intracellular steroid hormone receptor signaling pathway | 65/6293 | 116/18723 | 5.58e-07 | 7.93e-06 | 65 |
| GO:003560114 | Thyroid | ATC | protein deacylation | 61/6293 | 112/18723 | 4.37e-06 | 4.79e-05 | 61 |
| GO:000647614 | Thyroid | ATC | protein deacetylation | 56/6293 | 101/18723 | 5.15e-06 | 5.57e-05 | 56 |
| GO:0043401111 | Thyroid | ATC | steroid hormone mediated signaling pathway | 71/6293 | 136/18723 | 5.72e-06 | 6.07e-05 | 71 |
| GO:001657512 | Thyroid | ATC | histone deacetylation | 47/6293 | 82/18723 | 8.75e-06 | 8.81e-05 | 47 |
| GO:009873213 | Thyroid | ATC | macromolecule deacylation | 61/6293 | 116/18723 | 1.89e-05 | 1.72e-04 | 61 |
| GO:003257018 | Thyroid | ATC | response to progesterone | 25/6293 | 37/18723 | 2.50e-05 | 2.16e-04 | 25 |
| GO:190165521 | Thyroid | ATC | cellular response to ketone | 52/6293 | 96/18723 | 2.65e-05 | 2.27e-04 | 52 |
| Page: 1 2 |
| Pathway ID | Tissue | Disease Stage | Description | Gene Ratio | Bg Ratio | pvalue | p.adjust | qvalue | Count |
| Page: 1 |
Top |
Cell-cell communication analysis |
| Identification of potential cell-cell interactions between two cell types and their ligand-receptor pairs for different disease states |
| Ligand | Receptor | LRpair | Pathway | Tissue | Disease Stage |
| Page: 1 |
Top |
Single-cell gene regulatory network inference analysis |
| Find out the significant the regulons (TFs) and the target genes of each regulon across cell types for different disease states |
| TF | Cell Type | Tissue | Disease Stage | Target Gene | RSS | Regulon Activity |
| ∗The dot plots of a searched regulon are shown for all cell subpopulations in each disease state of each tissue based on the regulon specific score inferred using pySCENIC and by calculating the average expression. |
| Page: 1 |
Top |
Somatic mutation of malignant transformation related genes |
| Annotation of somatic variants for genes involved in malignant transformation |
| Hugo Symbol | Variant Class | Variant Classification | dbSNP RS | HGVSc | HGVSp | HGVSp Short | SWISSPROT | BIOTYPE | SIFT | PolyPhen | Tumor Sample Barcode | Tissue | Histology | Sex | Age | Stage | Therapy Types | Drugs | Outcome |
| TRERF1 | SNV | Missense_Mutation | c.1663N>G | p.Gln555Glu | p.Q555E | protein_coding | tolerated_low_confidence(0.26) | benign(0.035) | TCGA-A2-A0EQ-01 | Breast | breast invasive carcinoma | Female | <65 | I/II | Chemotherapy | adriamycin | SD | ||
| TRERF1 | SNV | Missense_Mutation | novel | c.2789N>A | p.Ile930Asn | p.I930N | protein_coding | tolerated(0.06) | benign(0.347) | TCGA-AC-A2QI-01 | Breast | breast invasive carcinoma | Female | >=65 | III/IV | Chemotherapy | cytoxan | CR | |
| TRERF1 | SNV | Missense_Mutation | c.1660N>A | p.Pro554Thr | p.P554T | protein_coding | tolerated_low_confidence(0.08) | benign(0.143) | TCGA-AN-A0AR-01 | Breast | breast invasive carcinoma | Female | <65 | I/II | Unknown | Unknown | SD | ||
| TRERF1 | SNV | Missense_Mutation | novel | c.689N>A | p.Gly230Glu | p.G230E | protein_coding | deleterious_low_confidence(0) | possibly_damaging(0.696) | TCGA-BH-A0HF-01 | Breast | breast invasive carcinoma | Female | >=65 | I/II | Hormone Therapy | arimidex | SD | |
| TRERF1 | insertion | Nonsense_Mutation | novel | c.3008_3009insATAGGCAAGTTCTAGAG | p.Pro1004Ter | p.P1004* | protein_coding | TCGA-A7-A0CJ-01 | Breast | breast invasive carcinoma | Female | <65 | I/II | Chemotherapy | cytoxan | SD | |||
| TRERF1 | insertion | Nonsense_Mutation | novel | c.686_687insGGACTTTTTGTGACCTTTAATATGGTAGTATGCATTGT | p.Gly230AspfsTer4 | p.G230Dfs*4 | protein_coding | TCGA-AN-A03X-01 | Breast | breast invasive carcinoma | Female | >=65 | I/II | Unknown | Unknown | SD | |||
| TRERF1 | SNV | Missense_Mutation | novel | c.3415G>A | p.Ala1139Thr | p.A1139T | protein_coding | deleterious(0.01) | probably_damaging(0.996) | TCGA-2W-A8YY-01 | Cervix | cervical & endocervical cancer | Female | <65 | I/II | Chemotherapy | cisplatin | CR | |
| TRERF1 | SNV | Missense_Mutation | novel | c.3202G>A | p.Gly1068Ser | p.G1068S | protein_coding | tolerated(0.71) | benign(0.001) | TCGA-EA-A410-01 | Cervix | cervical & endocervical cancer | Female | <65 | I/II | Unknown | Unknown | SD | |
| TRERF1 | SNV | Missense_Mutation | c.2620N>A | p.Glu874Lys | p.E874K | protein_coding | deleterious(0.02) | probably_damaging(0.968) | TCGA-EK-A3GK-01 | Cervix | cervical & endocervical cancer | Female | <65 | I/II | Unknown | Unknown | SD | ||
| TRERF1 | SNV | Missense_Mutation | c.1901C>T | p.Ser634Phe | p.S634F | protein_coding | deleterious(0.01) | probably_damaging(0.994) | TCGA-Q1-A6DT-01 | Cervix | cervical & endocervical cancer | Female | <65 | I/II | Unknown | Unknown | PD |
| Page: 1 2 3 4 5 6 7 8 9 10 11 12 13 14 |
Top |
Related drugs of malignant transformation related genes |
| Identification of chemicals and drugs interact with genes involved in malignant transfromation |
| (DGIdb 4.0) |
| Entrez ID | Symbol | Category | Interaction Types | Drug Claim Name | Drug Name | PMIDs |
| Page: 1 |

Copyright 2023-Present -The University of Texas Health Science Center at Houston |