
|
|||||
|
 | |
| |
| |
| |
| |
| |
|
Gene: TREM1 |
Gene summary for TREM1 |
| Gene information | Species | Human | Gene symbol | TREM1 | Gene ID | 54210 |
| Gene name | triggering receptor expressed on myeloid cells 1 | |
| Gene Alias | CD354 | |
| Cytomap | 6p21.1 | |
| Gene Type | protein-coding | GO ID | GO:0001816 | UniProtAcc | Q9NP99 |
Top |
Malignant transformation analysis |
| Identification of the aberrant gene expression in precancerous and cancerous lesions by comparing the gene expression of stem-like cells in diseased tissues with normal stem cells |
| Entrez ID | Symbol | Replicates | Species | Organ | Tissue | Adj P-value | Log2FC | Malignancy |
| 54210 | TREM1 | LZE6T | Human | Esophagus | ESCC | 5.85e-09 | 7.82e-01 | 0.0845 |
| 54210 | TREM1 | P17T-E | Human | Esophagus | ESCC | 1.35e-10 | 9.21e-01 | 0.1278 |
| 54210 | TREM1 | P47T-E | Human | Esophagus | ESCC | 1.38e-02 | 2.26e-01 | 0.1067 |
| 54210 | TREM1 | P89T-E | Human | Esophagus | ESCC | 8.98e-11 | 2.26e+00 | 0.1752 |
| Page: 1 |
| Tissue | Expression Dynamics | Abbreviation |
| Esophagus | 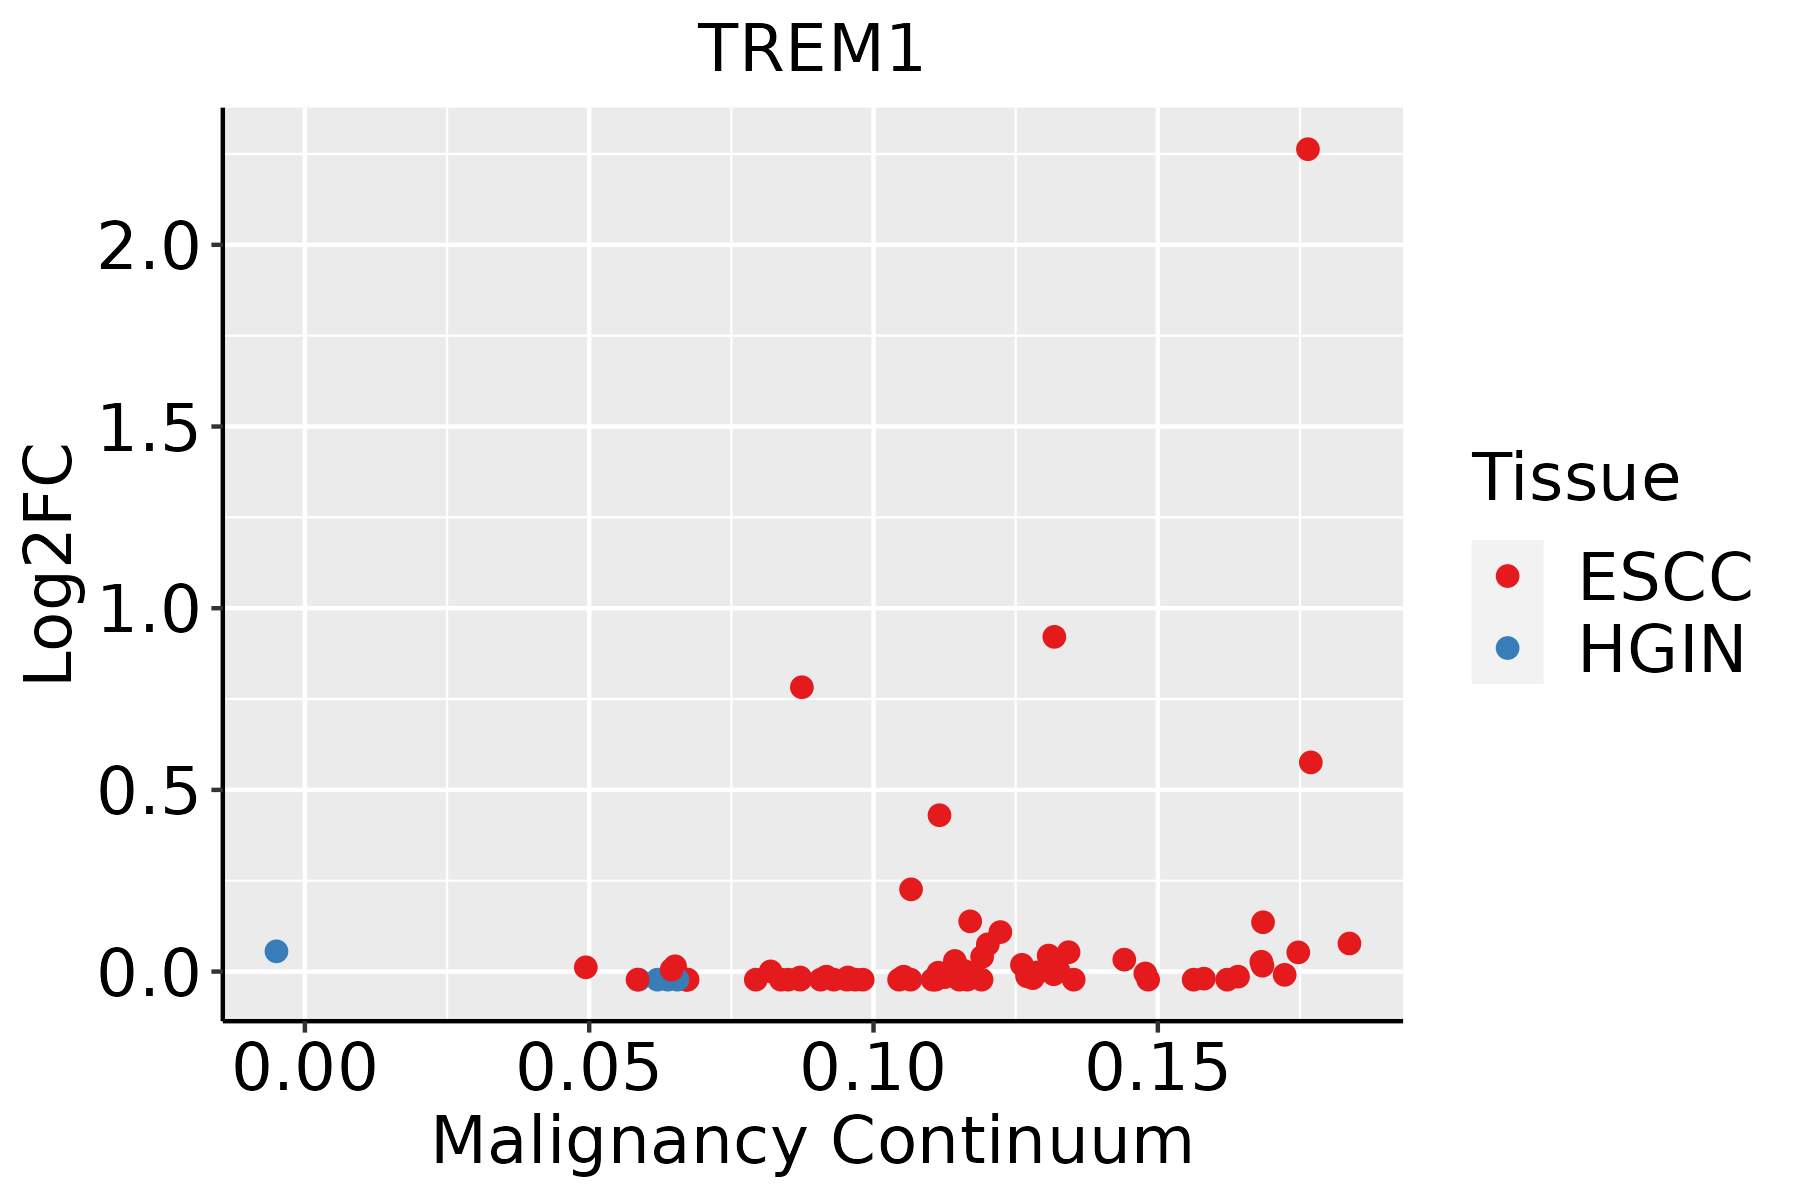 | ESCC: Esophageal squamous cell carcinoma |
| HGIN: High-grade intraepithelial neoplasias | ||
| LGIN: Low-grade intraepithelial neoplasias |
| ∗log2FC in expression of this searched gene in stem-like cells from each diseased tissue sample relative to stem-like cells in normal samples in each tissue plotted against the malignancy continuum. Samples are colored based on if they are from different disease stage. |
Top |
Malignant transformation related pathway analysis |
| Find out the enriched GO biological processes and KEGG pathways involved in transition from healthy to precancer to cancer |
| Tissue | Disease Stage | Enriched GO biological Processes |
| Colorectum | AD |  |
| Colorectum | SER |  |
| Colorectum | MSS |  |
| Colorectum | MSI-H |  |
| Colorectum | FAP |  |
| ∗Top 15 enriched GO BP terms are showed in the bar plot of each disease state in each tissue. Each row represents a significant GO biological process which is colored according to the -log10(p.adjust). |
| Page: 1 2 3 4 5 6 7 8 9 |
| GO ID | Tissue | Disease Stage | Description | Gene Ratio | Bg Ratio | pvalue | p.adjust | Count |
| GO:0044403111 | Esophagus | ESCC | biological process involved in symbiotic interaction | 186/8552 | 290/18723 | 1.43e-10 | 4.16e-09 | 186 |
| GO:005170214 | Esophagus | ESCC | biological process involved in interaction with symbiont | 57/8552 | 94/18723 | 2.46e-03 | 1.07e-02 | 57 |
| Page: 1 |
| Pathway ID | Tissue | Disease Stage | Description | Gene Ratio | Bg Ratio | pvalue | p.adjust | qvalue | Count |
| Page: 1 |
Top |
Cell-cell communication analysis |
| Identification of potential cell-cell interactions between two cell types and their ligand-receptor pairs for different disease states |
| Ligand | Receptor | LRpair | Pathway | Tissue | Disease Stage |
| Page: 1 |
Top |
Single-cell gene regulatory network inference analysis |
| Find out the significant the regulons (TFs) and the target genes of each regulon across cell types for different disease states |
| TF | Cell Type | Tissue | Disease Stage | Target Gene | RSS | Regulon Activity |
| ∗The dot plots of a searched regulon are shown for all cell subpopulations in each disease state of each tissue based on the regulon specific score inferred using pySCENIC and by calculating the average expression. |
| Page: 1 |
Top |
Somatic mutation of malignant transformation related genes |
| Annotation of somatic variants for genes involved in malignant transformation |
| Hugo Symbol | Variant Class | Variant Classification | dbSNP RS | HGVSc | HGVSp | HGVSp Short | SWISSPROT | BIOTYPE | SIFT | PolyPhen | Tumor Sample Barcode | Tissue | Histology | Sex | Age | Stage | Therapy Types | Drugs | Outcome |
| TREM1 | SNV | Missense_Mutation | rs775893448 | c.463N>T | p.Pro155Ser | p.P155S | Q9NP99 | protein_coding | tolerated(0.09) | benign(0.031) | TCGA-AO-A03P-01 | Breast | breast invasive carcinoma | Female | <65 | I/II | Hormone Therapy | letrozole | PD |
| TREM1 | SNV | Missense_Mutation | novel | c.349N>A | p.Gln117Lys | p.Q117K | Q9NP99 | protein_coding | tolerated(0.29) | possibly_damaging(0.701) | TCGA-C8-A137-01 | Breast | breast invasive carcinoma | Female | <65 | I/II | Unknown | Unknown | PD |
| TREM1 | SNV | Missense_Mutation | rs750833928 | c.605N>T | p.Pro202Leu | p.P202L | Q9NP99 | protein_coding | tolerated(0.07) | benign(0.397) | TCGA-E2-A15A-06 | Breast | breast invasive carcinoma | Female | <65 | III/IV | Chemotherapy | cyclophosphamide | SD |
| TREM1 | SNV | Missense_Mutation | c.388C>A | p.Arg130Ser | p.R130S | Q9NP99 | protein_coding | deleterious(0.01) | possibly_damaging(0.848) | TCGA-EW-A1J1-01 | Breast | breast invasive carcinoma | Female | <65 | I/II | Chemotherapy | taxotere | SD | |
| TREM1 | SNV | Missense_Mutation | rs748711105 | c.379N>A | p.Asp127Asn | p.D127N | Q9NP99 | protein_coding | tolerated(0.24) | benign(0) | TCGA-WT-AB41-01 | Breast | breast invasive carcinoma | Female | <65 | I/II | Chemotherapy | taxotere | CR |
| TREM1 | SNV | Missense_Mutation | c.265G>A | p.Asp89Asn | p.D89N | Q9NP99 | protein_coding | deleterious(0.01) | probably_damaging(0.988) | TCGA-AA-3977-01 | Colorectum | colon adenocarcinoma | Male | >=65 | I/II | Unknown | Unknown | SD | |
| TREM1 | SNV | Missense_Mutation | rs780834156 | c.389N>A | p.Arg130His | p.R130H | Q9NP99 | protein_coding | tolerated(0.19) | benign(0.115) | TCGA-AA-3984-01 | Colorectum | colon adenocarcinoma | Female | <65 | I/II | Unknown | Unknown | SD |
| TREM1 | SNV | Missense_Mutation | c.383G>A | p.Arg128His | p.R128H | Q9NP99 | protein_coding | tolerated(0.09) | possibly_damaging(0.608) | TCGA-AA-A00N-01 | Colorectum | colon adenocarcinoma | Male | >=65 | I/II | Unknown | Unknown | PD | |
| TREM1 | SNV | Missense_Mutation | novel | c.593N>C | p.Ile198Thr | p.I198T | Q9NP99 | protein_coding | deleterious(0.01) | benign(0.083) | TCGA-AZ-4315-01 | Colorectum | colon adenocarcinoma | Male | <65 | I/II | Unknown | Unknown | SD |
| TREM1 | SNV | Missense_Mutation | c.68N>C | p.Lys23Thr | p.K23T | Q9NP99 | protein_coding | tolerated(0.14) | benign(0.045) | TCGA-AG-3902-01 | Colorectum | rectum adenocarcinoma | Male | <65 | I/II | Unknown | Unknown | SD |
| Page: 1 2 3 4 |
Top |
Related drugs of malignant transformation related genes |
| Identification of chemicals and drugs interact with genes involved in malignant transfromation |
| (DGIdb 4.0) |
| Entrez ID | Symbol | Category | Interaction Types | Drug Claim Name | Drug Name | PMIDs |
| Page: 1 |

Copyright 2023-Present -The University of Texas Health Science Center at Houston |