
|
|||||
|
 | |
| |
| |
| |
| |
| |
|
Gene: TRBC2 |
Gene summary for TRBC2 |
| Gene information | Species | Human | Gene symbol | TRBC2 | Gene ID | 28638 |
| Gene name | T cell receptor beta constant 2 | |
| Gene Alias | TCRBC2 | |
| Cytomap | 7q34 | |
| Gene Type | other | GO ID | GO:0001775 | UniProtAcc | NA |
Top |
Malignant transformation analysis |
| Identification of the aberrant gene expression in precancerous and cancerous lesions by comparing the gene expression of stem-like cells in diseased tissues with normal stem cells |
| Entrez ID | Symbol | Replicates | Species | Organ | Tissue | Adj P-value | Log2FC | Malignancy |
| 28638 | TRBC2 | LZE4T | Human | Esophagus | ESCC | 6.19e-10 | 4.65e-01 | 0.0811 |
| 28638 | TRBC2 | LZE7T | Human | Esophagus | ESCC | 2.07e-09 | 6.64e-01 | 0.0667 |
| 28638 | TRBC2 | LZE8T | Human | Esophagus | ESCC | 4.02e-05 | 2.88e-01 | 0.067 |
| 28638 | TRBC2 | LZE22D1 | Human | Esophagus | HGIN | 5.14e-03 | 2.83e-01 | 0.0595 |
| 28638 | TRBC2 | LZE24T | Human | Esophagus | ESCC | 1.80e-03 | 1.97e-01 | 0.0596 |
| 28638 | TRBC2 | LZE6T | Human | Esophagus | ESCC | 7.09e-15 | 8.07e-01 | 0.0845 |
| 28638 | TRBC2 | C21 | Human | Oral cavity | OSCC | 1.96e-23 | 6.74e-01 | 0.2678 |
| 28638 | TRBC2 | C30 | Human | Oral cavity | OSCC | 4.24e-20 | 6.48e-01 | 0.3055 |
| 28638 | TRBC2 | C38 | Human | Oral cavity | OSCC | 1.71e-13 | 2.00e+00 | 0.172 |
| 28638 | TRBC2 | C46 | Human | Oral cavity | OSCC | 4.10e-24 | 4.76e-01 | 0.1673 |
| 28638 | TRBC2 | C51 | Human | Oral cavity | OSCC | 5.61e-16 | 5.33e-01 | 0.2674 |
| 28638 | TRBC2 | C57 | Human | Oral cavity | OSCC | 6.98e-06 | 4.18e-01 | 0.1679 |
| 28638 | TRBC2 | C06 | Human | Oral cavity | OSCC | 4.00e-10 | 1.27e+00 | 0.2699 |
| 28638 | TRBC2 | C07 | Human | Oral cavity | OSCC | 3.99e-09 | 8.03e-01 | 0.2491 |
| 28638 | TRBC2 | C08 | Human | Oral cavity | OSCC | 4.46e-07 | 2.86e-01 | 0.1919 |
| 28638 | TRBC2 | C86 | Human | Oral cavity | OSCC | 1.66e-03 | 5.64e-01 | 0.161 |
| 28638 | TRBC2 | C09 | Human | Oral cavity | OSCC | 5.42e-21 | 4.97e-01 | 0.1431 |
| 28638 | TRBC2 | LN22 | Human | Oral cavity | OSCC | 3.38e-08 | 1.41e+00 | 0.1733 |
| 28638 | TRBC2 | LN38 | Human | Oral cavity | OSCC | 9.55e-05 | 1.17e+00 | 0.168 |
| 28638 | TRBC2 | LN46 | Human | Oral cavity | OSCC | 4.60e-17 | 5.63e-01 | 0.1666 |
| Page: 1 2 |
| Tissue | Expression Dynamics | Abbreviation |
| Esophagus |  | ESCC: Esophageal squamous cell carcinoma |
| HGIN: High-grade intraepithelial neoplasias | ||
| LGIN: Low-grade intraepithelial neoplasias | ||
| Oral Cavity | 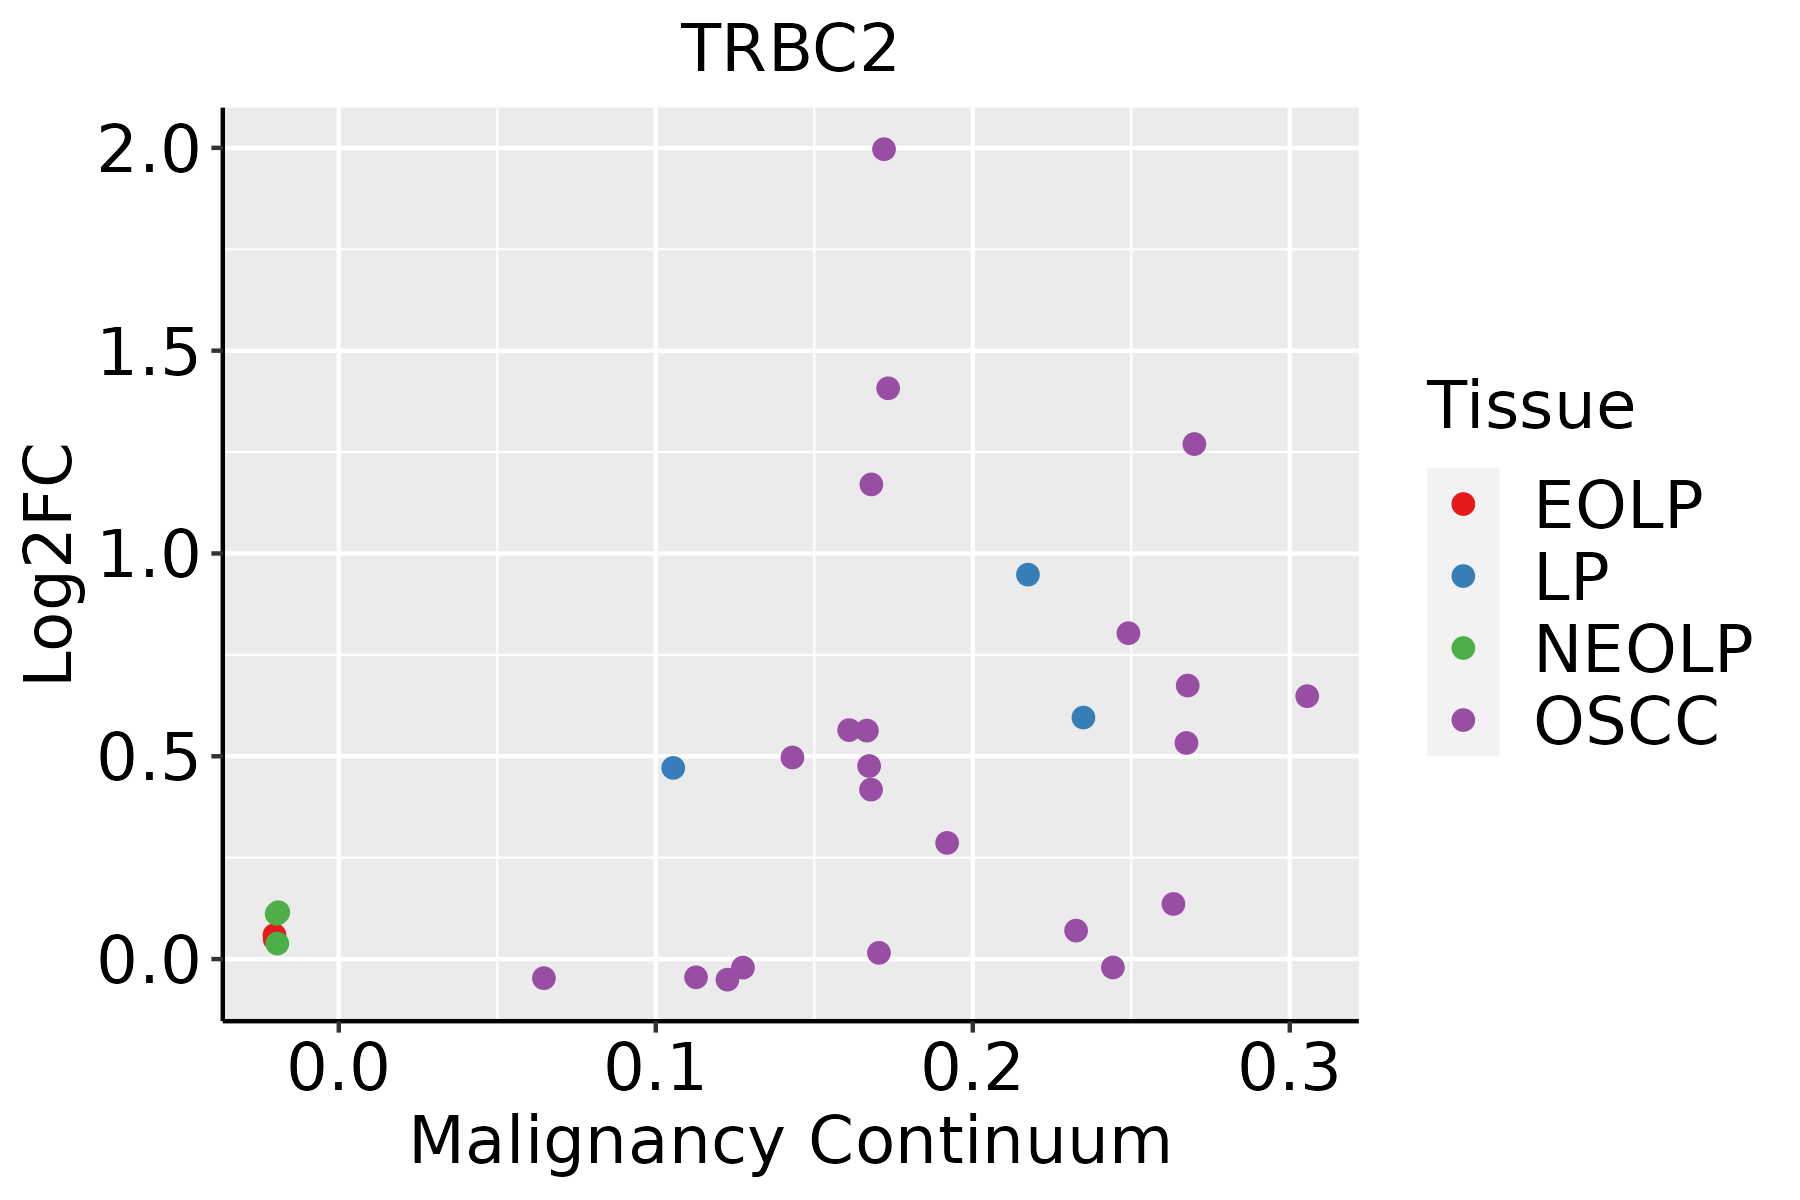 | EOLP: Erosive Oral lichen planus |
| LP: leukoplakia | ||
| NEOLP: Non-erosive oral lichen planus | ||
| OSCC: Oral squamous cell carcinoma | ||
| Thyroid | 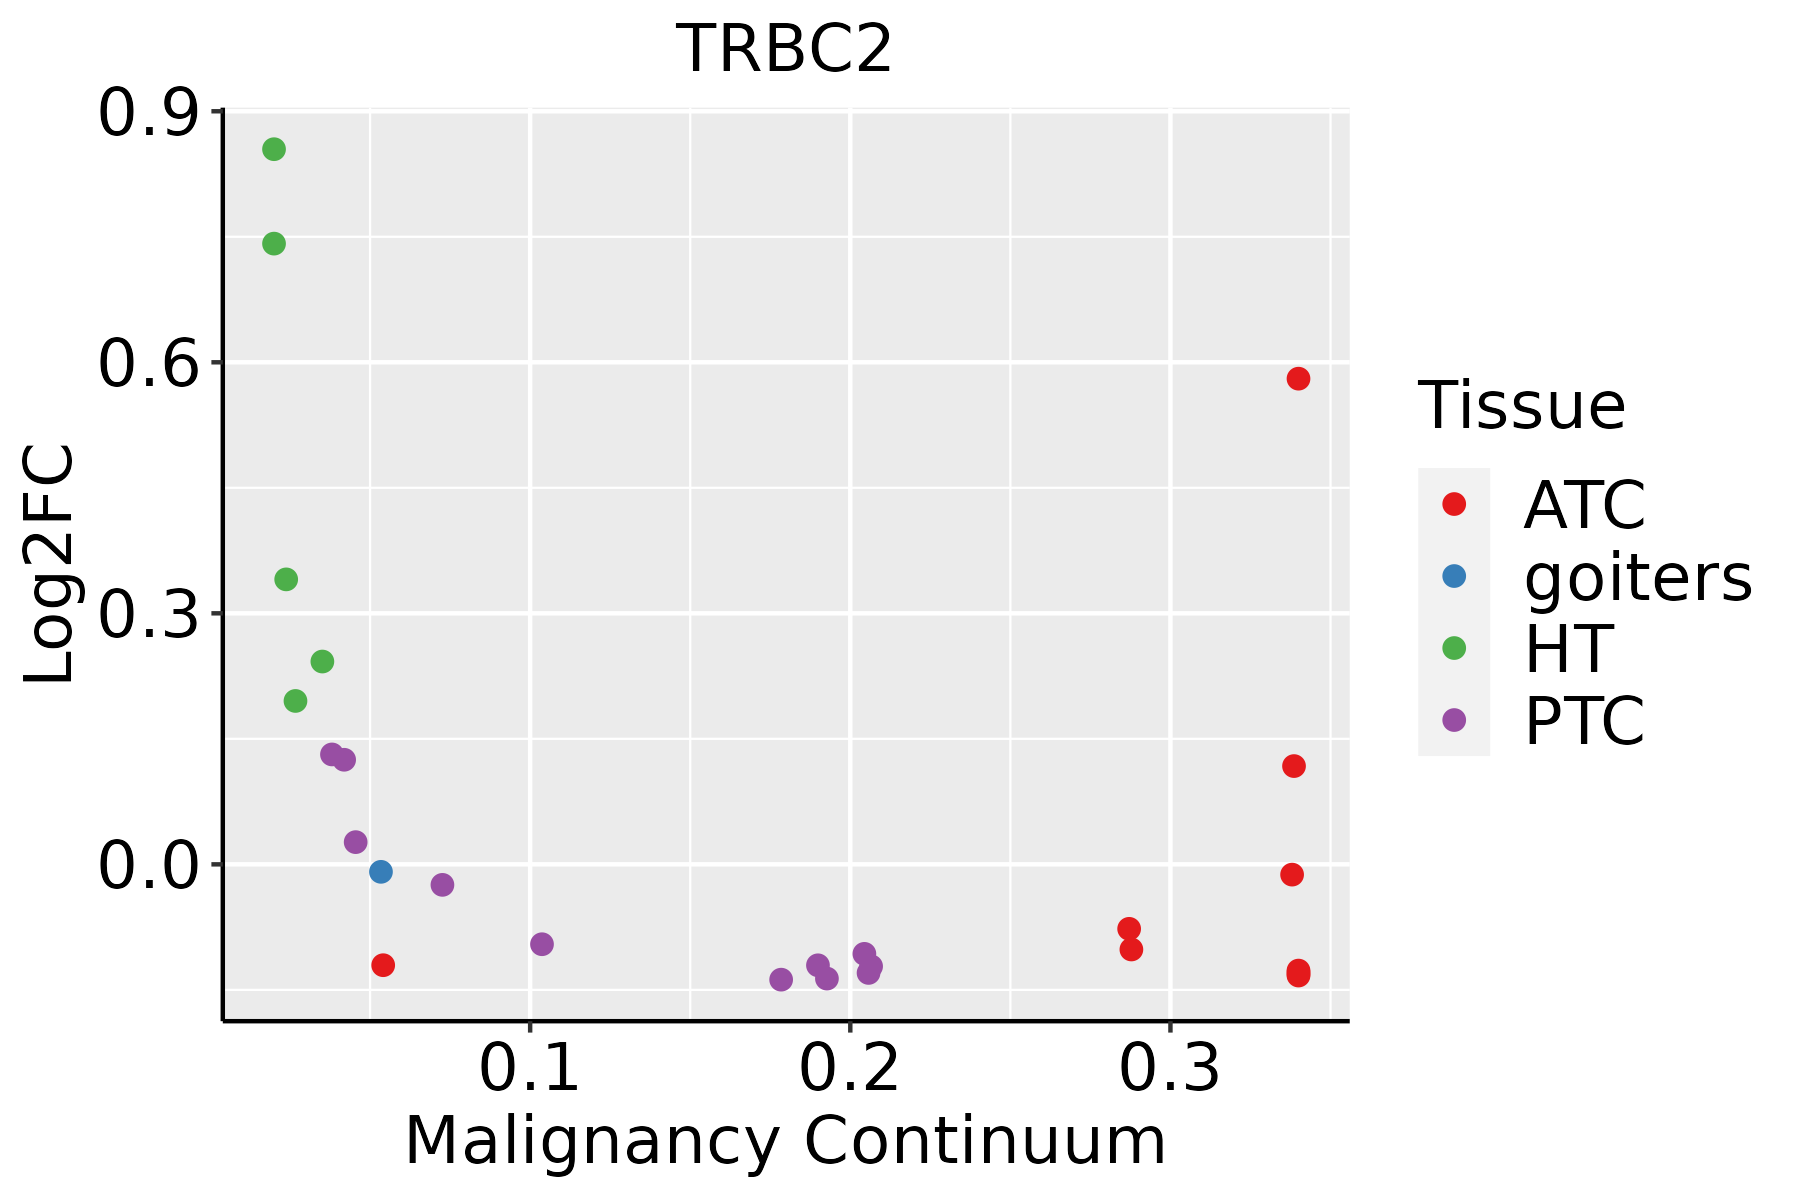 | ATC: Anaplastic thyroid cancer |
| HT: Hashimoto's thyroiditis | ||
| PTC: Papillary thyroid cancer |
| ∗log2FC in expression of this searched gene in stem-like cells from each diseased tissue sample relative to stem-like cells in normal samples in each tissue plotted against the malignancy continuum. Samples are colored based on if they are from different disease stage. |
Top |
Malignant transformation related pathway analysis |
| Find out the enriched GO biological processes and KEGG pathways involved in transition from healthy to precancer to cancer |
| Tissue | Disease Stage | Enriched GO biological Processes |
| Colorectum | AD |  |
| Colorectum | SER |  |
| Colorectum | MSS |  |
| Colorectum | MSI-H |  |
| Colorectum | FAP |  |
| ∗Top 15 enriched GO BP terms are showed in the bar plot of each disease state in each tissue. Each row represents a significant GO biological process which is colored according to the -log10(p.adjust). |
| Page: 1 2 3 4 5 6 7 8 9 |
| GO ID | Tissue | Disease Stage | Description | Gene Ratio | Bg Ratio | pvalue | p.adjust | Count |
| GO:00027646 | Oral cavity | OSCC | immune response-regulating signaling pathway | 212/7305 | 468/18723 | 2.93e-03 | 1.27e-02 | 212 |
| GO:00512519 | Thyroid | HT | positive regulation of lymphocyte activation | 51/1272 | 362/18723 | 5.57e-07 | 2.38e-05 | 51 |
| GO:000269610 | Thyroid | HT | positive regulation of leukocyte activation | 55/1272 | 409/18723 | 9.17e-07 | 3.70e-05 | 55 |
| GO:00508679 | Thyroid | HT | positive regulation of cell activation | 55/1272 | 420/18723 | 2.11e-06 | 7.61e-05 | 55 |
| GO:00160644 | Thyroid | HT | immunoglobulin mediated immune response | 32/1272 | 207/18723 | 1.05e-05 | 2.82e-04 | 32 |
| GO:00197244 | Thyroid | HT | B cell mediated immunity | 32/1272 | 210/18723 | 1.42e-05 | 3.57e-04 | 32 |
| GO:00024494 | Thyroid | HT | lymphocyte mediated immunity | 45/1272 | 350/18723 | 2.76e-05 | 6.05e-04 | 45 |
| GO:00022536 | Thyroid | HT | activation of immune response | 47/1272 | 375/18723 | 3.55e-05 | 7.40e-04 | 47 |
| GO:00069564 | Thyroid | HT | complement activation | 22/1272 | 130/18723 | 6.17e-05 | 1.16e-03 | 22 |
| GO:00069598 | Thyroid | HT | humoral immune response | 40/1272 | 317/18723 | 1.14e-04 | 1.86e-03 | 40 |
| GO:00024434 | Thyroid | HT | leukocyte mediated immunity | 51/1272 | 440/18723 | 1.30e-04 | 2.07e-03 | 51 |
| GO:00080371 | Thyroid | HT | cell recognition | 31/1272 | 225/18723 | 1.35e-04 | 2.12e-03 | 31 |
| GO:00024605 | Thyroid | HT | adaptive immune response based on somatic recombination of immune receptors built from immunoglobulin superfamily domains | 43/1272 | 356/18723 | 1.74e-04 | 2.59e-03 | 43 |
| GO:00421133 | Thyroid | HT | B cell activation | 39/1272 | 334/18723 | 6.66e-04 | 7.61e-03 | 39 |
| GO:00069583 | Thyroid | HT | complement activation, classical pathway | 17/1272 | 108/18723 | 9.56e-04 | 9.83e-03 | 17 |
| GO:00027648 | Thyroid | HT | immune response-regulating signaling pathway | 50/1272 | 468/18723 | 9.96e-04 | 1.02e-02 | 50 |
| GO:00024552 | Thyroid | HT | humoral immune response mediated by circulating immunoglobulin | 18/1272 | 121/18723 | 1.35e-03 | 1.29e-02 | 18 |
| GO:00069094 | Thyroid | HT | phagocytosis | 34/1272 | 308/18723 | 3.59e-03 | 2.73e-02 | 34 |
| GO:00103244 | Thyroid | HT | membrane invagination | 19/1272 | 144/18723 | 4.08e-03 | 2.99e-02 | 19 |
| GO:00508643 | Thyroid | HT | regulation of B cell activation | 24/1272 | 198/18723 | 4.18e-03 | 3.05e-02 | 24 |
| Page: 1 2 |
| Pathway ID | Tissue | Disease Stage | Description | Gene Ratio | Bg Ratio | pvalue | p.adjust | qvalue | Count |
| Page: 1 |
Top |
Cell-cell communication analysis |
| Identification of potential cell-cell interactions between two cell types and their ligand-receptor pairs for different disease states |
| Ligand | Receptor | LRpair | Pathway | Tissue | Disease Stage |
| Page: 1 |
Top |
Single-cell gene regulatory network inference analysis |
| Find out the significant the regulons (TFs) and the target genes of each regulon across cell types for different disease states |
| TF | Cell Type | Tissue | Disease Stage | Target Gene | RSS | Regulon Activity |
| ∗The dot plots of a searched regulon are shown for all cell subpopulations in each disease state of each tissue based on the regulon specific score inferred using pySCENIC and by calculating the average expression. |
| Page: 1 |
Top |
Somatic mutation of malignant transformation related genes |
| Annotation of somatic variants for genes involved in malignant transformation |
| Hugo Symbol | Variant Class | Variant Classification | dbSNP RS | HGVSc | HGVSp | HGVSp Short | SWISSPROT | BIOTYPE | SIFT | PolyPhen | Tumor Sample Barcode | Tissue | Histology | Sex | Age | Stage | Therapy Types | Drugs | Outcome |
| TRBC2 | SNV | Missense_Mutation | novel | c.291N>C | p.Val98Leu | p.V98L | TR_C_gene | deleterious(0.01) | benign(0.318) | TCGA-EA-A3HR-01 | Cervix | cervical & endocervical cancer | Female | <65 | I/II | Unknown | Unknown | SD | |
| TRBC2 | SNV | Missense_Mutation | rs782337323 | c.234C>T | p.Arg79Cys | p.R79C | TR_C_gene | deleterious(0) | probably_damaging(0.988) | TCGA-AG-4007-01 | Colorectum | rectum adenocarcinoma | Male | >=65 | III/IV | Unknown | Unknown | SD | |
| TRBC2 | SNV | Missense_Mutation | rs371775366 | c.321G>A | p.Glu108Lys | p.E108K | TR_C_gene | tolerated(0.34) | benign(0.005) | TCGA-AG-A002-01 | Colorectum | rectum adenocarcinoma | Male | <65 | I/II | Unknown | Unknown | SD | |
| TRBC2 | SNV | Missense_Mutation | novel | c.217N>T | p.Arg73Ile | p.R73I | TR_C_gene | deleterious(0.04) | benign(0.039) | TCGA-BS-A0UV-01 | Endometrium | uterine corpus endometrioid carcinoma | Female | <65 | III/IV | Unknown | Unknown | SD | |
| TRBC2 | SNV | Missense_Mutation | novel | c.220N>G | p.Tyr74Cys | p.Y74C | TR_C_gene | deleterious(0) | probably_damaging(1) | TCGA-D1-A175-01 | Endometrium | uterine corpus endometrioid carcinoma | Female | <65 | I/II | Chemotherapy | paclitaxel | SD | |
| TRBC2 | SNV | Missense_Mutation | novel | c.182N>T | p.Gln61His | p.Q61H | TR_C_gene | deleterious_low_confidence(0) | possibly_damaging(0.811) | TCGA-DF-A2KU-01 | Endometrium | uterine corpus endometrioid carcinoma | Female | Unknown | I/II | Unknown | Unknown | SD | |
| TRBC2 | SNV | Missense_Mutation | rs781847184 | c.15N>A | p.Val6Met | p.V6M | TR_C_gene | deleterious(0) | probably_damaging(1) | TCGA-EO-A22R-01 | Endometrium | uterine corpus endometrioid carcinoma | Female | <65 | I/II | Unknown | Unknown | SD | |
| TRBC2 | SNV | Missense_Mutation | novel | c.119N>G | p.His40Gln | p.H40Q | TR_C_gene | deleterious(0) | probably_damaging(0.999) | TCGA-05-4430-01 | Lung | lung adenocarcinoma | Female | <65 | I/II | Unknown | Unknown | SD | |
| TRBC2 | SNV | Missense_Mutation | novel | c.474N>C | p.Tyr159His | p.Y159H | TR_C_gene | deleterious(0) | probably_damaging(0.999) | TCGA-38-7271-01 | Lung | lung adenocarcinoma | Female | >=65 | I/II | Chemotherapy | cisplatin | PD | |
| TRBC2 | SNV | Missense_Mutation | rs782153350 | c.192G>A | p.Glu65Lys | p.E65K | TR_C_gene | deleterious(0) | possibly_damaging(0.633) | TCGA-44-2662-01 | Lung | lung adenocarcinoma | Male | >=65 | I/II | Other, specify in notesGSK Mage Vaccine Study | rec | PD |
| Page: 1 2 3 |
Top |
Related drugs of malignant transformation related genes |
| Identification of chemicals and drugs interact with genes involved in malignant transfromation |
| (DGIdb 4.0) |
| Entrez ID | Symbol | Category | Interaction Types | Drug Claim Name | Drug Name | PMIDs |
| Page: 1 |

Copyright 2023-Present -The University of Texas Health Science Center at Houston |