
|
|||||
|
 | |
| |
| |
| |
| |
| |
|
Gene: TRBC1 |
Gene summary for TRBC1 |
| Gene information | Species | Human | Gene symbol | TRBC1 | Gene ID | 28639 |
| Gene name | T cell receptor beta constant 1 | |
| Gene Alias | BV05S1J2.2 | |
| Cytomap | 7q34 | |
| Gene Type | other | GO ID | GO:0001775 | UniProtAcc | NA |
Top |
Malignant transformation analysis |
| Identification of the aberrant gene expression in precancerous and cancerous lesions by comparing the gene expression of stem-like cells in diseased tissues with normal stem cells |
| Entrez ID | Symbol | Replicates | Species | Organ | Tissue | Adj P-value | Log2FC | Malignancy |
| 28639 | TRBC1 | C21 | Human | Oral cavity | OSCC | 9.82e-25 | 1.02e+00 | 0.2678 |
| 28639 | TRBC1 | C30 | Human | Oral cavity | OSCC | 1.46e-03 | 2.26e-01 | 0.3055 |
| 28639 | TRBC1 | C38 | Human | Oral cavity | OSCC | 1.64e-08 | 1.20e+00 | 0.172 |
| 28639 | TRBC1 | C46 | Human | Oral cavity | OSCC | 4.36e-09 | 3.03e-01 | 0.1673 |
| 28639 | TRBC1 | C51 | Human | Oral cavity | OSCC | 2.57e-07 | 4.29e-01 | 0.2674 |
| 28639 | TRBC1 | C06 | Human | Oral cavity | OSCC | 2.53e-07 | 1.00e+00 | 0.2699 |
| 28639 | TRBC1 | C07 | Human | Oral cavity | OSCC | 1.55e-03 | 5.77e-01 | 0.2491 |
| 28639 | TRBC1 | C09 | Human | Oral cavity | OSCC | 9.65e-08 | 2.09e-01 | 0.1431 |
| 28639 | TRBC1 | LN22 | Human | Oral cavity | OSCC | 4.25e-02 | 1.14e+00 | 0.1733 |
| 28639 | TRBC1 | LN46 | Human | Oral cavity | OSCC | 7.12e-05 | 2.01e-01 | 0.1666 |
| Page: 1 |
| Tissue | Expression Dynamics | Abbreviation |
| Oral Cavity | 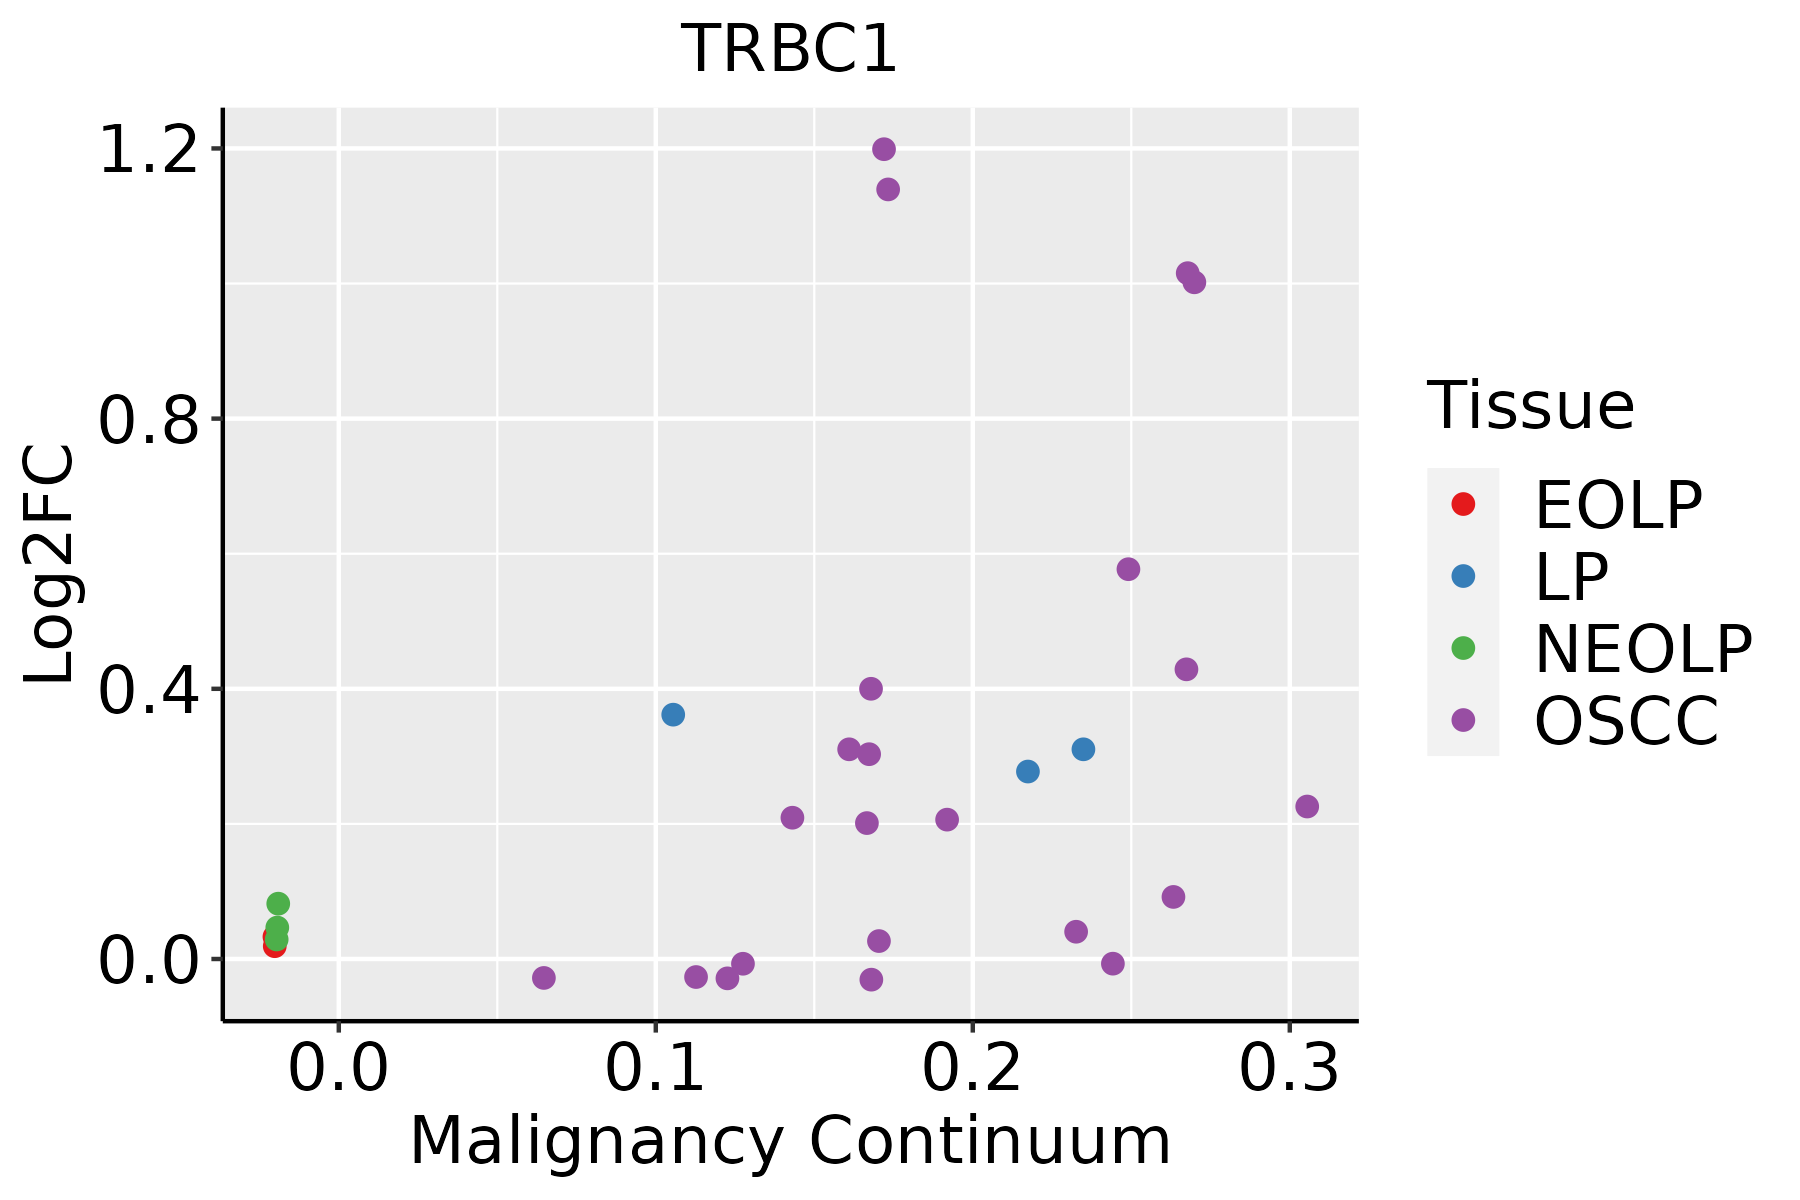 | EOLP: Erosive Oral lichen planus |
| LP: leukoplakia | ||
| NEOLP: Non-erosive oral lichen planus | ||
| OSCC: Oral squamous cell carcinoma |
| ∗log2FC in expression of this searched gene in stem-like cells from each diseased tissue sample relative to stem-like cells in normal samples in each tissue plotted against the malignancy continuum. Samples are colored based on if they are from different disease stage. |
Top |
Malignant transformation related pathway analysis |
| Find out the enriched GO biological processes and KEGG pathways involved in transition from healthy to precancer to cancer |
| Tissue | Disease Stage | Enriched GO biological Processes |
| Colorectum | AD |  |
| Colorectum | SER |  |
| Colorectum | MSS |  |
| Colorectum | MSI-H |  |
| Colorectum | FAP |  |
| ∗Top 15 enriched GO BP terms are showed in the bar plot of each disease state in each tissue. Each row represents a significant GO biological process which is colored according to the -log10(p.adjust). |
| Page: 1 2 3 4 5 6 7 8 9 |
| GO ID | Tissue | Disease Stage | Description | Gene Ratio | Bg Ratio | pvalue | p.adjust | Count |
| GO:00027646 | Oral cavity | OSCC | immune response-regulating signaling pathway | 212/7305 | 468/18723 | 2.93e-03 | 1.27e-02 | 212 |
| Page: 1 |
| Pathway ID | Tissue | Disease Stage | Description | Gene Ratio | Bg Ratio | pvalue | p.adjust | qvalue | Count |
| Page: 1 |
Top |
Cell-cell communication analysis |
| Identification of potential cell-cell interactions between two cell types and their ligand-receptor pairs for different disease states |
| Ligand | Receptor | LRpair | Pathway | Tissue | Disease Stage |
| Page: 1 |
Top |
Single-cell gene regulatory network inference analysis |
| Find out the significant the regulons (TFs) and the target genes of each regulon across cell types for different disease states |
| TF | Cell Type | Tissue | Disease Stage | Target Gene | RSS | Regulon Activity |
| ∗The dot plots of a searched regulon are shown for all cell subpopulations in each disease state of each tissue based on the regulon specific score inferred using pySCENIC and by calculating the average expression. |
| Page: 1 |
Top |
Somatic mutation of malignant transformation related genes |
| Annotation of somatic variants for genes involved in malignant transformation |
| Hugo Symbol | Variant Class | Variant Classification | dbSNP RS | HGVSc | HGVSp | HGVSp Short | SWISSPROT | BIOTYPE | SIFT | PolyPhen | Tumor Sample Barcode | Tissue | Histology | Sex | Age | Stage | Therapy Types | Drugs | Outcome |
| TRBC1 | SNV | Missense_Mutation | novel | c.59N>C | p.Glu20Asp | p.E20D | TR_C_gene | deleterious(0) | probably_damaging(0.998) | TCGA-5L-AAT1-01 | Breast | breast invasive carcinoma | Female | <65 | III/IV | Hormone Therapy | letrozol | SD | |
| TRBC1 | SNV | Missense_Mutation | novel | c.107C>A | p.Phe36Leu | p.F36L | TR_C_gene | deleterious(0) | probably_damaging(0.997) | TCGA-AN-A046-01 | Breast | breast invasive carcinoma | Female | >=65 | I/II | Unknown | Unknown | SD | |
| TRBC1 | SNV | Missense_Mutation | novel | c.235G>A | p.Arg79His | p.R79H | TR_C_gene | deleterious(0) | probably_damaging(0.998) | TCGA-E2-A15R-01 | Breast | breast invasive carcinoma | Female | <65 | I/II | Chemotherapy | cyclophosphamide | SD | |
| TRBC1 | SNV | Missense_Mutation | novel | c.114G>A | p.Asp39Asn | p.D39N | TR_C_gene | deleterious(0) | probably_damaging(1) | TCGA-ZJ-AAXT-01 | Cervix | cervical & endocervical cancer | Female | <65 | III/IV | Unknown | Unknown | SD | |
| TRBC1 | SNV | Missense_Mutation | novel | c.45N>T | p.Pro16Ser | p.P16S | TR_C_gene | deleterious(0) | probably_damaging(1) | TCGA-AP-A1DK-01 | Endometrium | uterine corpus endometrioid carcinoma | Female | <65 | I/II | Unknown | Unknown | SD | |
| TRBC1 | SNV | Missense_Mutation | novel | c.487N>C | p.Val163Ala | p.V163A | TR_C_gene | deleterious(0) | probably_damaging(0.995) | TCGA-AP-A1DV-01 | Endometrium | uterine corpus endometrioid carcinoma | Female | <65 | I/II | Unknown | Unknown | SD | |
| TRBC1 | SNV | Missense_Mutation | novel | c.12A>G | p.Lys5Glu | p.K5E | TR_C_gene | tolerated(0.8) | benign(0.001) | TCGA-B5-A3FC-01 | Endometrium | uterine corpus endometrioid carcinoma | Female | <65 | I/II | Unknown | Unknown | SD | |
| TRBC1 | SNV | Missense_Mutation | novel | c.316N>G | p.Asn106Ser | p.N106S | TR_C_gene | tolerated(0.16) | benign(0) | TCGA-DI-A1BU-01 | Endometrium | uterine corpus endometrioid carcinoma | Female | <65 | I/II | Chemotherapy | paclitaxel | SD | |
| TRBC1 | SNV | Missense_Mutation | novel | c.327A>G | p.Thr110Ala | p.T110A | TR_C_gene | tolerated(0.59) | benign(0.01) | TCGA-FI-A2D5-01 | Endometrium | uterine corpus endometrioid carcinoma | Female | <65 | III/IV | Chemotherapy | carboplatinum | PD | |
| TRBC1 | insertion | Frame_Shift_Ins | novel | c.191_192insACACACACCAAGAC | p.Glu65ThrfsTer17 | p.E65Tfs*17 | TR_C_gene | TCGA-BG-A0MC-01 | Endometrium | uterine corpus endometrioid carcinoma | Female | >=65 | I/II | Unknown | Unknown | SD |
| Page: 1 2 3 |
Top |
Related drugs of malignant transformation related genes |
| Identification of chemicals and drugs interact with genes involved in malignant transfromation |
| (DGIdb 4.0) |
| Entrez ID | Symbol | Category | Interaction Types | Drug Claim Name | Drug Name | PMIDs |
| 28639 | TRBC1 | KINASE, TRANSCRIPTION FACTOR, EXTERNAL SIDE OF PLASMA MEMBRANE | TRBC1 |
| Page: 1 |

Copyright 2023-Present -The University of Texas Health Science Center at Houston |