
|
|||||
|
 | |
| |
| |
| |
| |
| |
|
Gene: TRAPPC8 |
Gene summary for TRAPPC8 |
| Gene information | Species | Human | Gene symbol | TRAPPC8 | Gene ID | 22878 |
| Gene name | trafficking protein particle complex subunit 8 | |
| Gene Alias | GSG1 | |
| Cytomap | 18q12.1 | |
| Gene Type | protein-coding | GO ID | GO:0000045 | UniProtAcc | Q9Y2L5 |
Top |
Malignant transformation analysis |
| Identification of the aberrant gene expression in precancerous and cancerous lesions by comparing the gene expression of stem-like cells in diseased tissues with normal stem cells |
| Entrez ID | Symbol | Replicates | Species | Organ | Tissue | Adj P-value | Log2FC | Malignancy |
| 22878 | TRAPPC8 | CCI_2 | Human | Cervix | CC | 1.40e-04 | 6.89e-01 | 0.5249 |
| 22878 | TRAPPC8 | CCI_3 | Human | Cervix | CC | 2.38e-04 | 5.51e-01 | 0.516 |
| 22878 | TRAPPC8 | T3 | Human | Cervix | CC | 1.46e-02 | 7.74e-02 | 0.1389 |
| 22878 | TRAPPC8 | HTA11_3410_2000001011 | Human | Colorectum | AD | 8.99e-11 | -4.81e-01 | 0.0155 |
| 22878 | TRAPPC8 | HTA11_3361_2000001011 | Human | Colorectum | AD | 1.08e-03 | -4.74e-01 | -0.1207 |
| 22878 | TRAPPC8 | HTA11_696_2000001011 | Human | Colorectum | AD | 2.76e-06 | -3.33e-01 | -0.1464 |
| 22878 | TRAPPC8 | HTA11_1391_2000001011 | Human | Colorectum | AD | 2.56e-02 | -3.11e-01 | -0.059 |
| 22878 | TRAPPC8 | HTA11_546_2000001011 | Human | Colorectum | AD | 1.40e-02 | -4.84e-01 | -0.0842 |
| 22878 | TRAPPC8 | HTA11_866_3004761011 | Human | Colorectum | AD | 1.55e-10 | -4.78e-01 | 0.096 |
| 22878 | TRAPPC8 | HTA11_10711_2000001011 | Human | Colorectum | AD | 7.07e-05 | -4.66e-01 | 0.0338 |
| 22878 | TRAPPC8 | HTA11_7696_3000711011 | Human | Colorectum | AD | 5.86e-08 | -4.25e-01 | 0.0674 |
| 22878 | TRAPPC8 | HTA11_99999970781_79442 | Human | Colorectum | MSS | 6.17e-06 | -3.60e-01 | 0.294 |
| 22878 | TRAPPC8 | HTA11_99999971662_82457 | Human | Colorectum | MSS | 1.55e-11 | -4.61e-01 | 0.3859 |
| 22878 | TRAPPC8 | HTA11_99999974143_84620 | Human | Colorectum | MSS | 5.50e-17 | -5.41e-01 | 0.3005 |
| 22878 | TRAPPC8 | A002-C-010 | Human | Colorectum | FAP | 1.77e-02 | -1.43e-01 | 0.242 |
| 22878 | TRAPPC8 | A001-C-207 | Human | Colorectum | FAP | 6.02e-04 | -2.54e-01 | 0.1278 |
| 22878 | TRAPPC8 | A015-C-203 | Human | Colorectum | FAP | 6.09e-25 | -3.07e-01 | -0.1294 |
| 22878 | TRAPPC8 | A015-C-204 | Human | Colorectum | FAP | 5.65e-09 | -3.91e-01 | -0.0228 |
| 22878 | TRAPPC8 | A014-C-040 | Human | Colorectum | FAP | 1.05e-02 | -2.66e-01 | -0.1184 |
| 22878 | TRAPPC8 | A002-C-201 | Human | Colorectum | FAP | 1.64e-11 | -2.90e-01 | 0.0324 |
| Page: 1 2 3 |
| Tissue | Expression Dynamics | Abbreviation |
| Cervix | 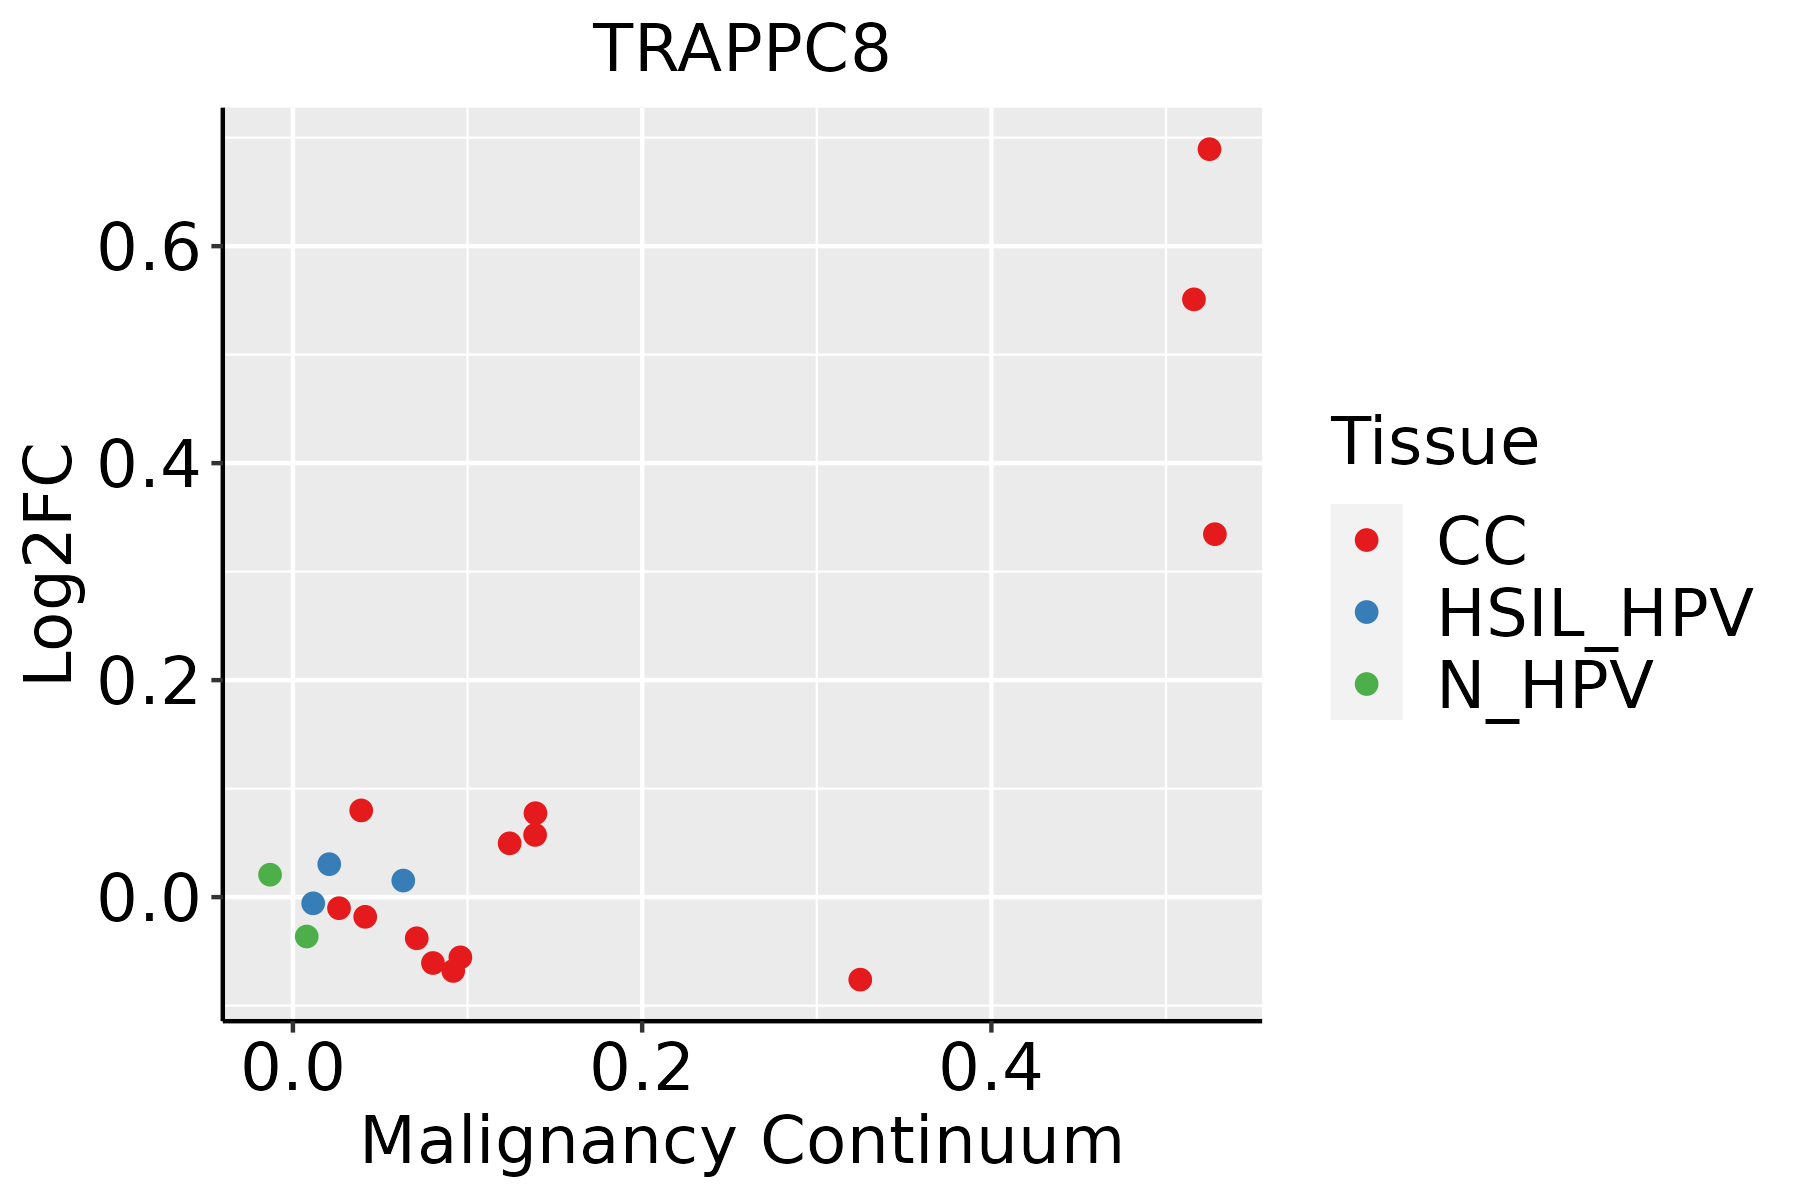 | CC: Cervix cancer |
| HSIL_HPV: HPV-infected high-grade squamous intraepithelial lesions | ||
| N_HPV: HPV-infected normal cervix | ||
| Colorectum (GSE201348) |  | FAP: Familial adenomatous polyposis |
| CRC: Colorectal cancer | ||
| Colorectum (HTA11) |  | AD: Adenomas |
| SER: Sessile serrated lesions | ||
| MSI-H: Microsatellite-high colorectal cancer | ||
| MSS: Microsatellite stable colorectal cancer | ||
| Endometrium |  | AEH: Atypical endometrial hyperplasia |
| EEC: Endometrioid Cancer | ||
| Liver | 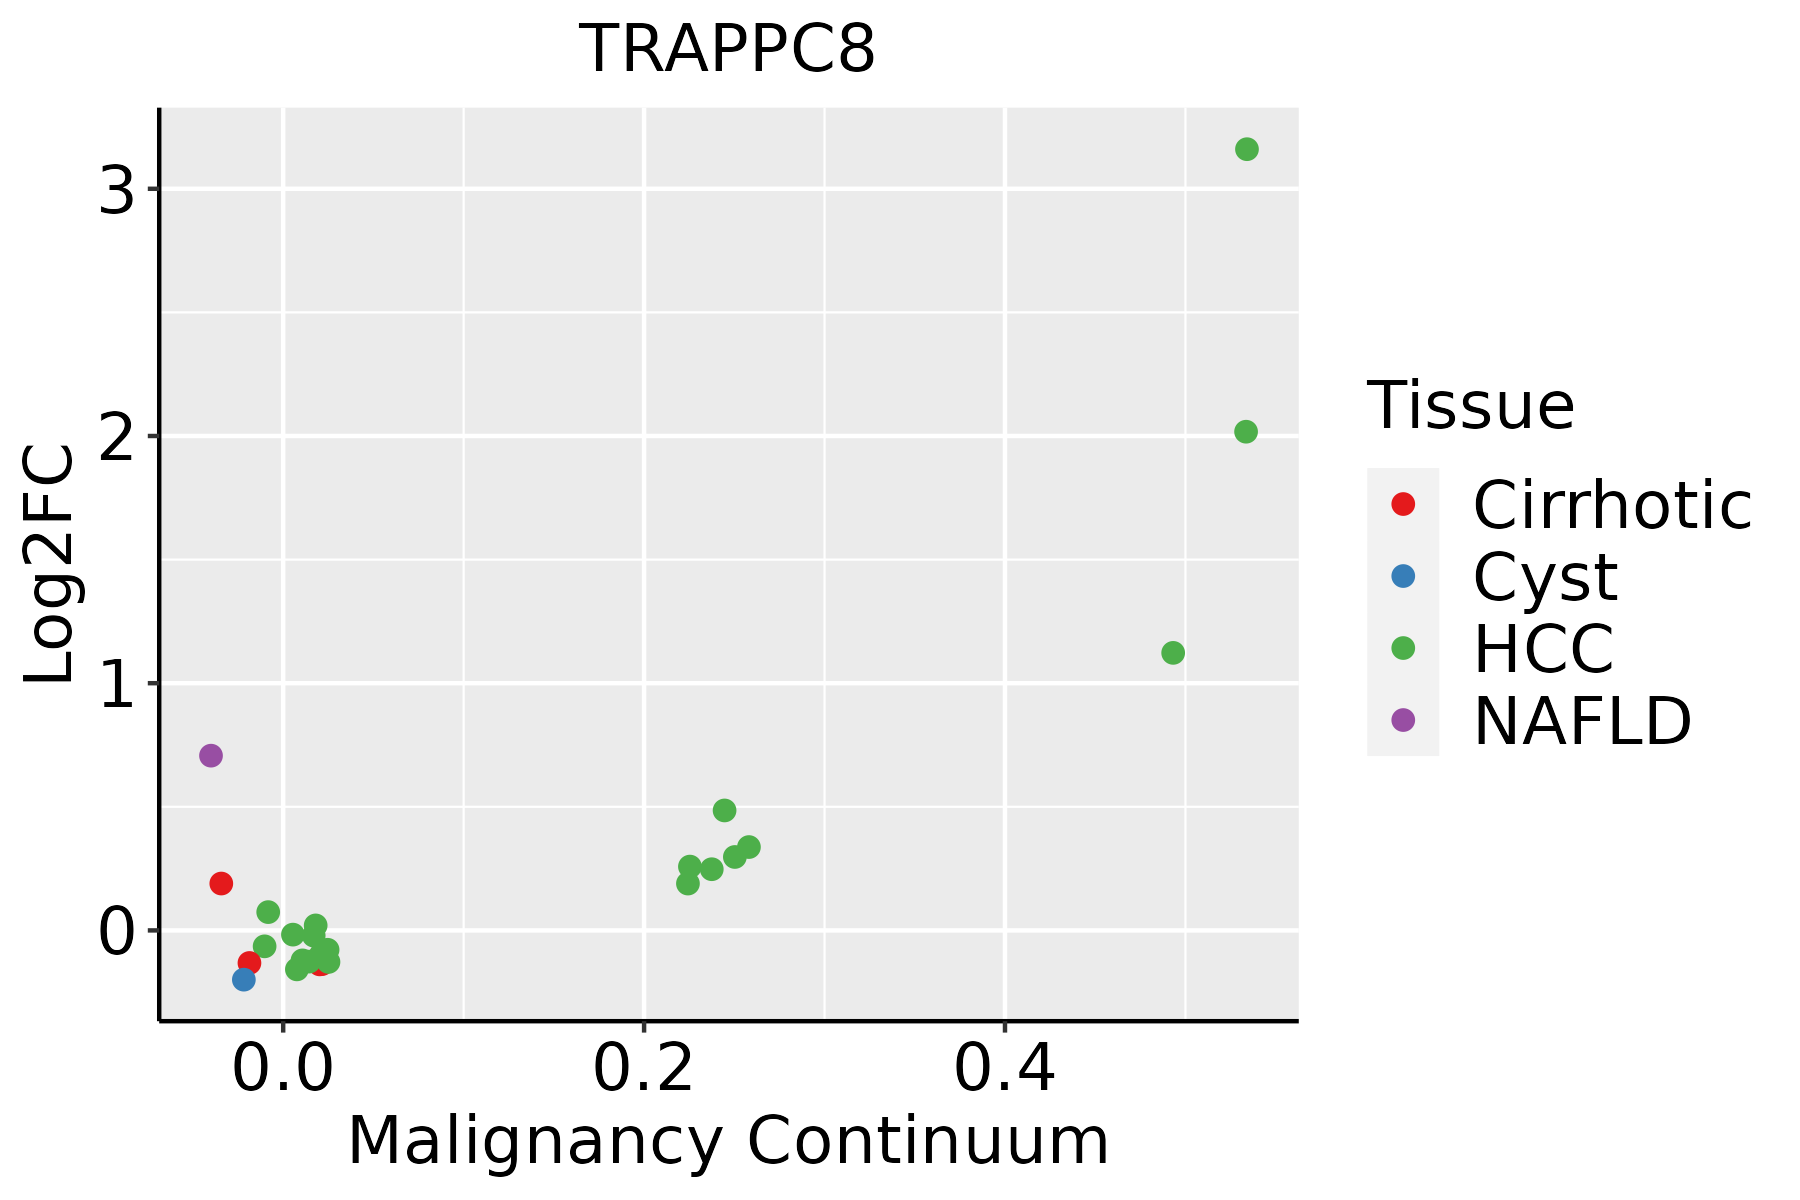 | HCC: Hepatocellular carcinoma |
| NAFLD: Non-alcoholic fatty liver disease |
| ∗log2FC in expression of this searched gene in stem-like cells from each diseased tissue sample relative to stem-like cells in normal samples in each tissue plotted against the malignancy continuum. Samples are colored based on if they are from different disease stage. |
Top |
Malignant transformation related pathway analysis |
| Find out the enriched GO biological processes and KEGG pathways involved in transition from healthy to precancer to cancer |
| Tissue | Disease Stage | Enriched GO biological Processes |
| Colorectum | AD |  |
| Colorectum | SER |  |
| Colorectum | MSS |  |
| Colorectum | MSI-H |  |
| Colorectum | FAP |  |
| ∗Top 15 enriched GO BP terms are showed in the bar plot of each disease state in each tissue. Each row represents a significant GO biological process which is colored according to the -log10(p.adjust). |
| Page: 1 2 3 4 5 6 7 8 9 |
| GO ID | Tissue | Disease Stage | Description | Gene Ratio | Bg Ratio | pvalue | p.adjust | Count |
| GO:00162367 | Cervix | CC | macroautophagy | 58/2311 | 291/18723 | 1.40e-04 | 1.70e-03 | 58 |
| GO:00481938 | Cervix | CC | Golgi vesicle transport | 58/2311 | 296/18723 | 2.24e-04 | 2.54e-03 | 58 |
| GO:00070304 | Cervix | CC | Golgi organization | 32/2311 | 157/18723 | 2.78e-03 | 1.87e-02 | 32 |
| GO:00000452 | Cervix | CC | autophagosome assembly | 21/2311 | 99/18723 | 8.67e-03 | 4.46e-02 | 21 |
| GO:0048193 | Colorectum | AD | Golgi vesicle transport | 109/3918 | 296/18723 | 1.80e-10 | 1.68e-08 | 109 |
| GO:0016236 | Colorectum | AD | macroautophagy | 103/3918 | 291/18723 | 6.76e-09 | 4.15e-07 | 103 |
| GO:0006888 | Colorectum | AD | endoplasmic reticulum to Golgi vesicle-mediated transport | 44/3918 | 130/18723 | 4.13e-04 | 4.68e-03 | 44 |
| GO:0007033 | Colorectum | AD | vacuole organization | 53/3918 | 180/18723 | 4.18e-03 | 2.89e-02 | 53 |
| GO:00481932 | Colorectum | MSS | Golgi vesicle transport | 101/3467 | 296/18723 | 9.09e-11 | 9.77e-09 | 101 |
| GO:00162362 | Colorectum | MSS | macroautophagy | 93/3467 | 291/18723 | 2.08e-08 | 1.17e-06 | 93 |
| GO:00068882 | Colorectum | MSS | endoplasmic reticulum to Golgi vesicle-mediated transport | 44/3467 | 130/18723 | 2.17e-05 | 4.60e-04 | 44 |
| GO:00070331 | Colorectum | MSS | vacuole organization | 48/3467 | 180/18723 | 4.32e-03 | 3.07e-02 | 48 |
| GO:00481934 | Colorectum | FAP | Golgi vesicle transport | 77/2622 | 296/18723 | 2.86e-08 | 2.62e-06 | 77 |
| GO:00162363 | Colorectum | FAP | macroautophagy | 70/2622 | 291/18723 | 2.73e-06 | 1.02e-04 | 70 |
| GO:00068884 | Colorectum | FAP | endoplasmic reticulum to Golgi vesicle-mediated transport | 30/2622 | 130/18723 | 3.51e-03 | 2.53e-02 | 30 |
| GO:00481935 | Colorectum | CRC | Golgi vesicle transport | 59/2078 | 296/18723 | 5.47e-06 | 2.17e-04 | 59 |
| GO:00162364 | Colorectum | CRC | macroautophagy | 51/2078 | 291/18723 | 6.40e-04 | 8.48e-03 | 51 |
| GO:00481939 | Endometrium | AEH | Golgi vesicle transport | 60/2100 | 296/18723 | 3.65e-06 | 9.79e-05 | 60 |
| GO:00068886 | Endometrium | AEH | endoplasmic reticulum to Golgi vesicle-mediated transport | 29/2100 | 130/18723 | 2.11e-04 | 2.59e-03 | 29 |
| GO:00162368 | Endometrium | AEH | macroautophagy | 52/2100 | 291/18723 | 4.56e-04 | 4.80e-03 | 52 |
| Page: 1 2 |
| Pathway ID | Tissue | Disease Stage | Description | Gene Ratio | Bg Ratio | pvalue | p.adjust | qvalue | Count |
| Page: 1 |
Top |
Cell-cell communication analysis |
| Identification of potential cell-cell interactions between two cell types and their ligand-receptor pairs for different disease states |
| Ligand | Receptor | LRpair | Pathway | Tissue | Disease Stage |
| Page: 1 |
Top |
Single-cell gene regulatory network inference analysis |
| Find out the significant the regulons (TFs) and the target genes of each regulon across cell types for different disease states |
| TF | Cell Type | Tissue | Disease Stage | Target Gene | RSS | Regulon Activity |
| ∗The dot plots of a searched regulon are shown for all cell subpopulations in each disease state of each tissue based on the regulon specific score inferred using pySCENIC and by calculating the average expression. |
| Page: 1 |
Top |
Somatic mutation of malignant transformation related genes |
| Annotation of somatic variants for genes involved in malignant transformation |
| Hugo Symbol | Variant Class | Variant Classification | dbSNP RS | HGVSc | HGVSp | HGVSp Short | SWISSPROT | BIOTYPE | SIFT | PolyPhen | Tumor Sample Barcode | Tissue | Histology | Sex | Age | Stage | Therapy Types | Drugs | Outcome |
| TRAPPC8 | SNV | Missense_Mutation | c.2374G>A | p.Glu792Lys | p.E792K | Q9Y2L5 | protein_coding | tolerated(0.42) | benign(0) | TCGA-AC-A23H-01 | Breast | breast invasive carcinoma | Female | >=65 | I/II | Unknown | Unknown | PD | |
| TRAPPC8 | SNV | Missense_Mutation | novel | c.3105G>C | p.Trp1035Cys | p.W1035C | Q9Y2L5 | protein_coding | deleterious(0) | probably_damaging(1) | TCGA-AC-A62Y-01 | Breast | breast invasive carcinoma | Female | >=65 | I/II | Unknown | Unknown | SD |
| TRAPPC8 | SNV | Missense_Mutation | novel | c.3826N>T | p.Pro1276Ser | p.P1276S | Q9Y2L5 | protein_coding | tolerated(0.13) | benign(0.001) | TCGA-AN-A046-01 | Breast | breast invasive carcinoma | Female | >=65 | I/II | Unknown | Unknown | SD |
| TRAPPC8 | SNV | Missense_Mutation | rs550493135 | c.856N>A | p.Glu286Lys | p.E286K | Q9Y2L5 | protein_coding | tolerated(0.72) | benign(0.207) | TCGA-AN-A046-01 | Breast | breast invasive carcinoma | Female | >=65 | I/II | Unknown | Unknown | SD |
| TRAPPC8 | SNV | Missense_Mutation | rs201741478 | c.515N>A | p.Arg172Gln | p.R172Q | Q9Y2L5 | protein_coding | tolerated(0.57) | benign(0.113) | TCGA-AN-A046-01 | Breast | breast invasive carcinoma | Female | >=65 | I/II | Unknown | Unknown | SD |
| TRAPPC8 | SNV | Missense_Mutation | c.1917N>T | p.Gln639His | p.Q639H | Q9Y2L5 | protein_coding | deleterious(0) | probably_damaging(1) | TCGA-AO-A128-01 | Breast | breast invasive carcinoma | Female | <65 | I/II | Chemotherapy | doxorubicin | SD | |
| TRAPPC8 | SNV | Missense_Mutation | novel | c.2813N>A | p.Val938Asp | p.V938D | Q9Y2L5 | protein_coding | tolerated(0.08) | benign(0.274) | TCGA-AR-A0U0-01 | Breast | breast invasive carcinoma | Female | >=65 | I/II | Unknown | Unknown | SD |
| TRAPPC8 | SNV | Missense_Mutation | c.1436C>G | p.Pro479Arg | p.P479R | Q9Y2L5 | protein_coding | deleterious(0.04) | possibly_damaging(0.625) | TCGA-AR-A251-01 | Breast | breast invasive carcinoma | Female | <65 | III/IV | Chemotherapy | doxorubicin | SD | |
| TRAPPC8 | SNV | Missense_Mutation | c.3809A>T | p.Lys1270Ile | p.K1270I | Q9Y2L5 | protein_coding | deleterious(0.03) | benign(0.243) | TCGA-D8-A1JD-01 | Breast | breast invasive carcinoma | Female | <65 | I/II | Chemotherapy | adriamycin | SD | |
| TRAPPC8 | SNV | Missense_Mutation | c.885N>G | p.Phe295Leu | p.F295L | Q9Y2L5 | protein_coding | tolerated(0.87) | benign(0) | TCGA-D8-A1X9-01 | Breast | breast invasive carcinoma | Female | >=65 | I/II | Chemotherapy | adriamycin+cyclophosphamide | SD |
| Page: 1 2 3 4 5 6 7 8 9 10 11 12 13 14 15 16 |
Top |
Related drugs of malignant transformation related genes |
| Identification of chemicals and drugs interact with genes involved in malignant transfromation |
| (DGIdb 4.0) |
| Entrez ID | Symbol | Category | Interaction Types | Drug Claim Name | Drug Name | PMIDs |
| Page: 1 |

Copyright 2023-Present -The University of Texas Health Science Center at Houston |