
|
|||||
|
 | |
| |
| |
| |
| |
| |
|
Gene: TRAPPC6A |
Gene summary for TRAPPC6A |
| Gene information | Species | Human | Gene symbol | TRAPPC6A | Gene ID | 79090 |
| Gene name | trafficking protein particle complex subunit 6A | |
| Gene Alias | TRS33 | |
| Cytomap | 19q13.32 | |
| Gene Type | protein-coding | GO ID | GO:0006810 | UniProtAcc | B7TZ90 |
Top |
Malignant transformation analysis |
| Identification of the aberrant gene expression in precancerous and cancerous lesions by comparing the gene expression of stem-like cells in diseased tissues with normal stem cells |
| Entrez ID | Symbol | Replicates | Species | Organ | Tissue | Adj P-value | Log2FC | Malignancy |
| 79090 | TRAPPC6A | HTA11_347_2000001011 | Human | Colorectum | AD | 2.13e-08 | 2.86e-01 | -0.1954 |
| 79090 | TRAPPC6A | HTA11_1391_2000001011 | Human | Colorectum | AD | 4.42e-03 | 2.41e-01 | -0.059 |
| 79090 | TRAPPC6A | HTA11_866_3004761011 | Human | Colorectum | AD | 1.55e-07 | 3.12e-01 | 0.096 |
| 79090 | TRAPPC6A | HTA11_4255_2000001011 | Human | Colorectum | SER | 7.34e-05 | 4.88e-01 | 0.0446 |
| 79090 | TRAPPC6A | HTA11_10623_2000001011 | Human | Colorectum | AD | 5.90e-04 | 3.79e-01 | -0.0177 |
| 79090 | TRAPPC6A | HTA11_7696_3000711011 | Human | Colorectum | AD | 9.09e-12 | 4.89e-01 | 0.0674 |
| 79090 | TRAPPC6A | HTA11_99999965104_69814 | Human | Colorectum | MSS | 1.62e-18 | 6.68e-01 | 0.281 |
| 79090 | TRAPPC6A | HTA11_99999971662_82457 | Human | Colorectum | MSS | 5.59e-06 | 3.34e-01 | 0.3859 |
| 79090 | TRAPPC6A | HTA11_99999974143_84620 | Human | Colorectum | MSS | 3.73e-11 | 4.08e-01 | 0.3005 |
| 79090 | TRAPPC6A | LZE4T | Human | Esophagus | ESCC | 4.10e-05 | 4.37e-01 | 0.0811 |
| 79090 | TRAPPC6A | LZE5T | Human | Esophagus | ESCC | 2.92e-02 | 4.81e-01 | 0.0514 |
| 79090 | TRAPPC6A | LZE8T | Human | Esophagus | ESCC | 7.14e-03 | 1.05e-01 | 0.067 |
| 79090 | TRAPPC6A | LZE24T | Human | Esophagus | ESCC | 1.63e-17 | 7.40e-01 | 0.0596 |
| 79090 | TRAPPC6A | P1T-E | Human | Esophagus | ESCC | 2.65e-05 | 4.43e-01 | 0.0875 |
| 79090 | TRAPPC6A | P2T-E | Human | Esophagus | ESCC | 2.20e-26 | 4.32e-01 | 0.1177 |
| 79090 | TRAPPC6A | P4T-E | Human | Esophagus | ESCC | 1.31e-17 | 7.16e-01 | 0.1323 |
| 79090 | TRAPPC6A | P5T-E | Human | Esophagus | ESCC | 9.39e-15 | 4.53e-01 | 0.1327 |
| 79090 | TRAPPC6A | P8T-E | Human | Esophagus | ESCC | 1.93e-53 | 1.04e+00 | 0.0889 |
| 79090 | TRAPPC6A | P9T-E | Human | Esophagus | ESCC | 1.49e-02 | 2.75e-01 | 0.1131 |
| 79090 | TRAPPC6A | P10T-E | Human | Esophagus | ESCC | 4.47e-95 | 1.66e+00 | 0.116 |
| Page: 1 2 3 4 5 6 |
| Tissue | Expression Dynamics | Abbreviation |
| Colorectum (GSE201348) |  | FAP: Familial adenomatous polyposis |
| CRC: Colorectal cancer | ||
| Colorectum (HTA11) |  | AD: Adenomas |
| SER: Sessile serrated lesions | ||
| MSI-H: Microsatellite-high colorectal cancer | ||
| MSS: Microsatellite stable colorectal cancer | ||
| Esophagus | 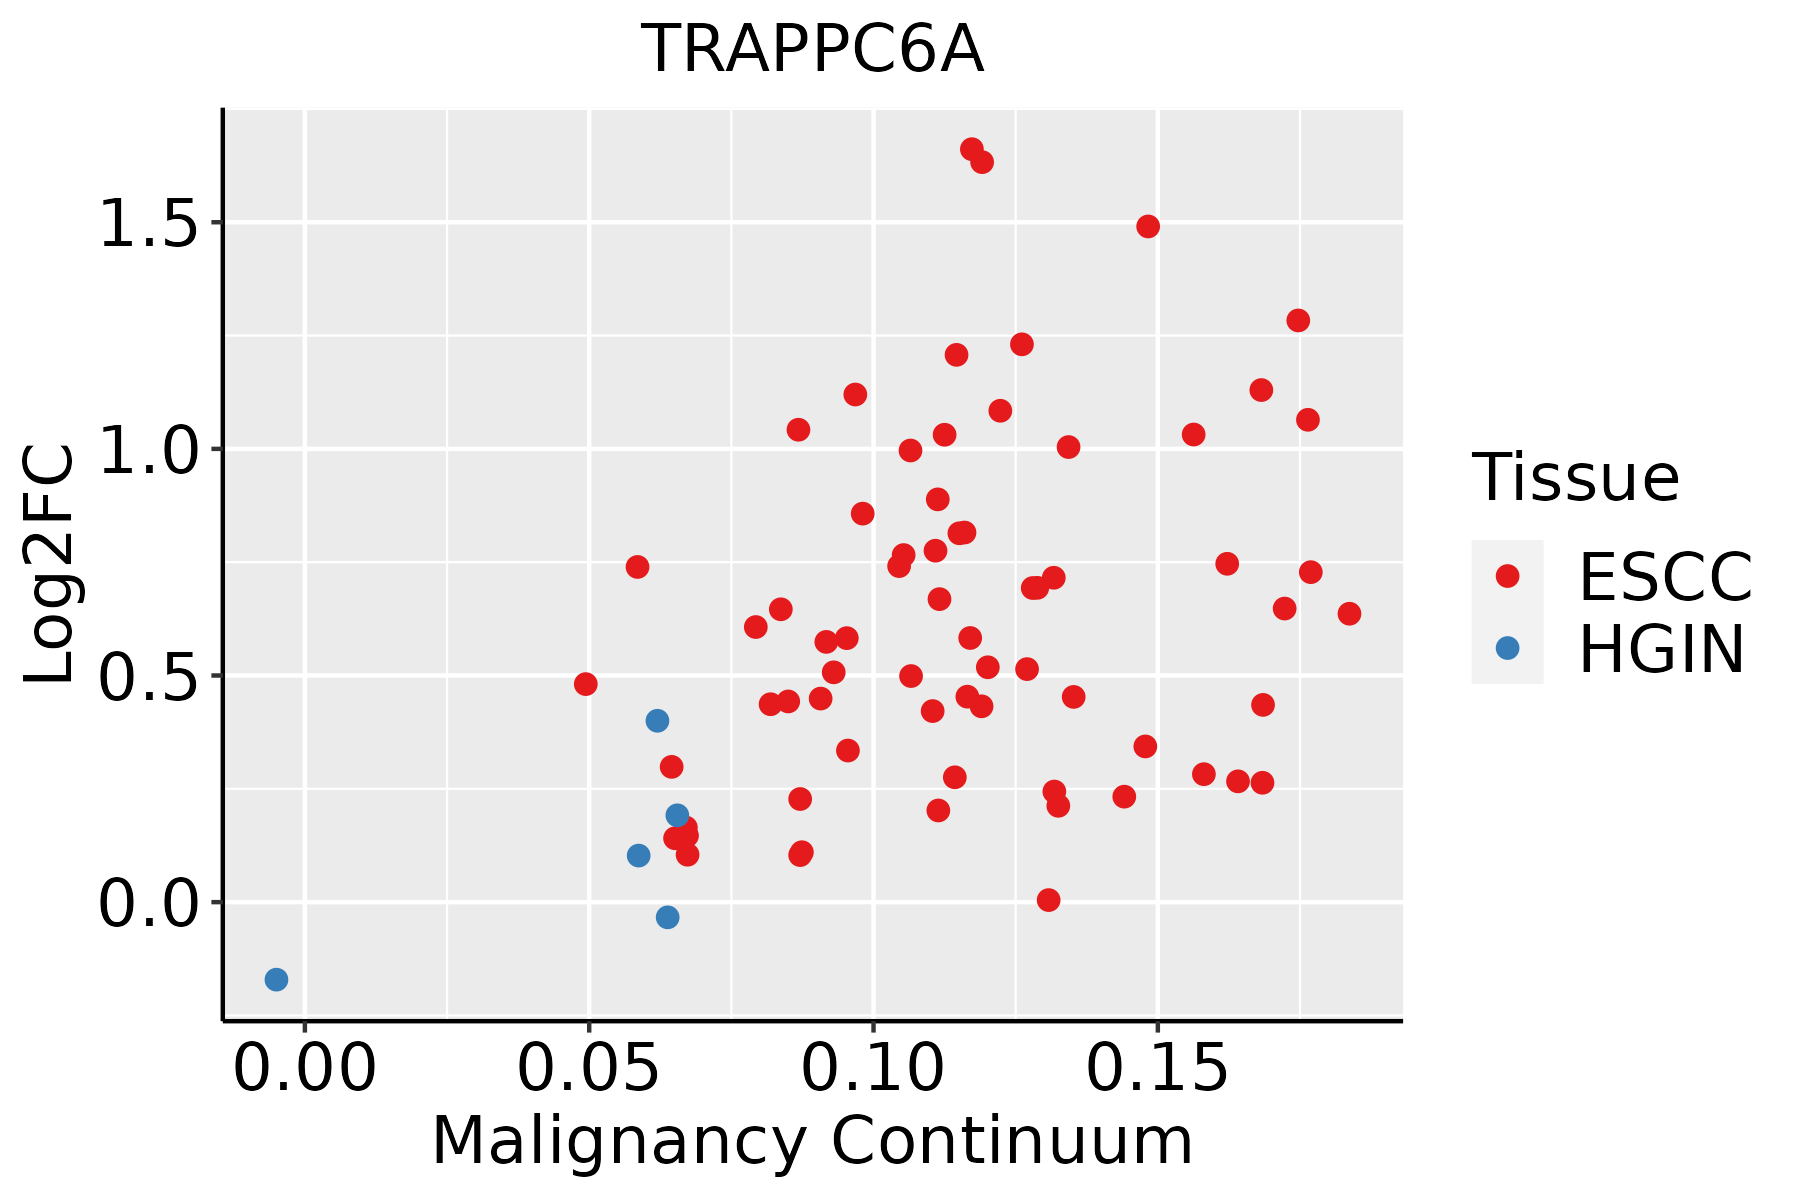 | ESCC: Esophageal squamous cell carcinoma |
| HGIN: High-grade intraepithelial neoplasias | ||
| LGIN: Low-grade intraepithelial neoplasias | ||
| Liver |  | HCC: Hepatocellular carcinoma |
| NAFLD: Non-alcoholic fatty liver disease | ||
| Oral Cavity | 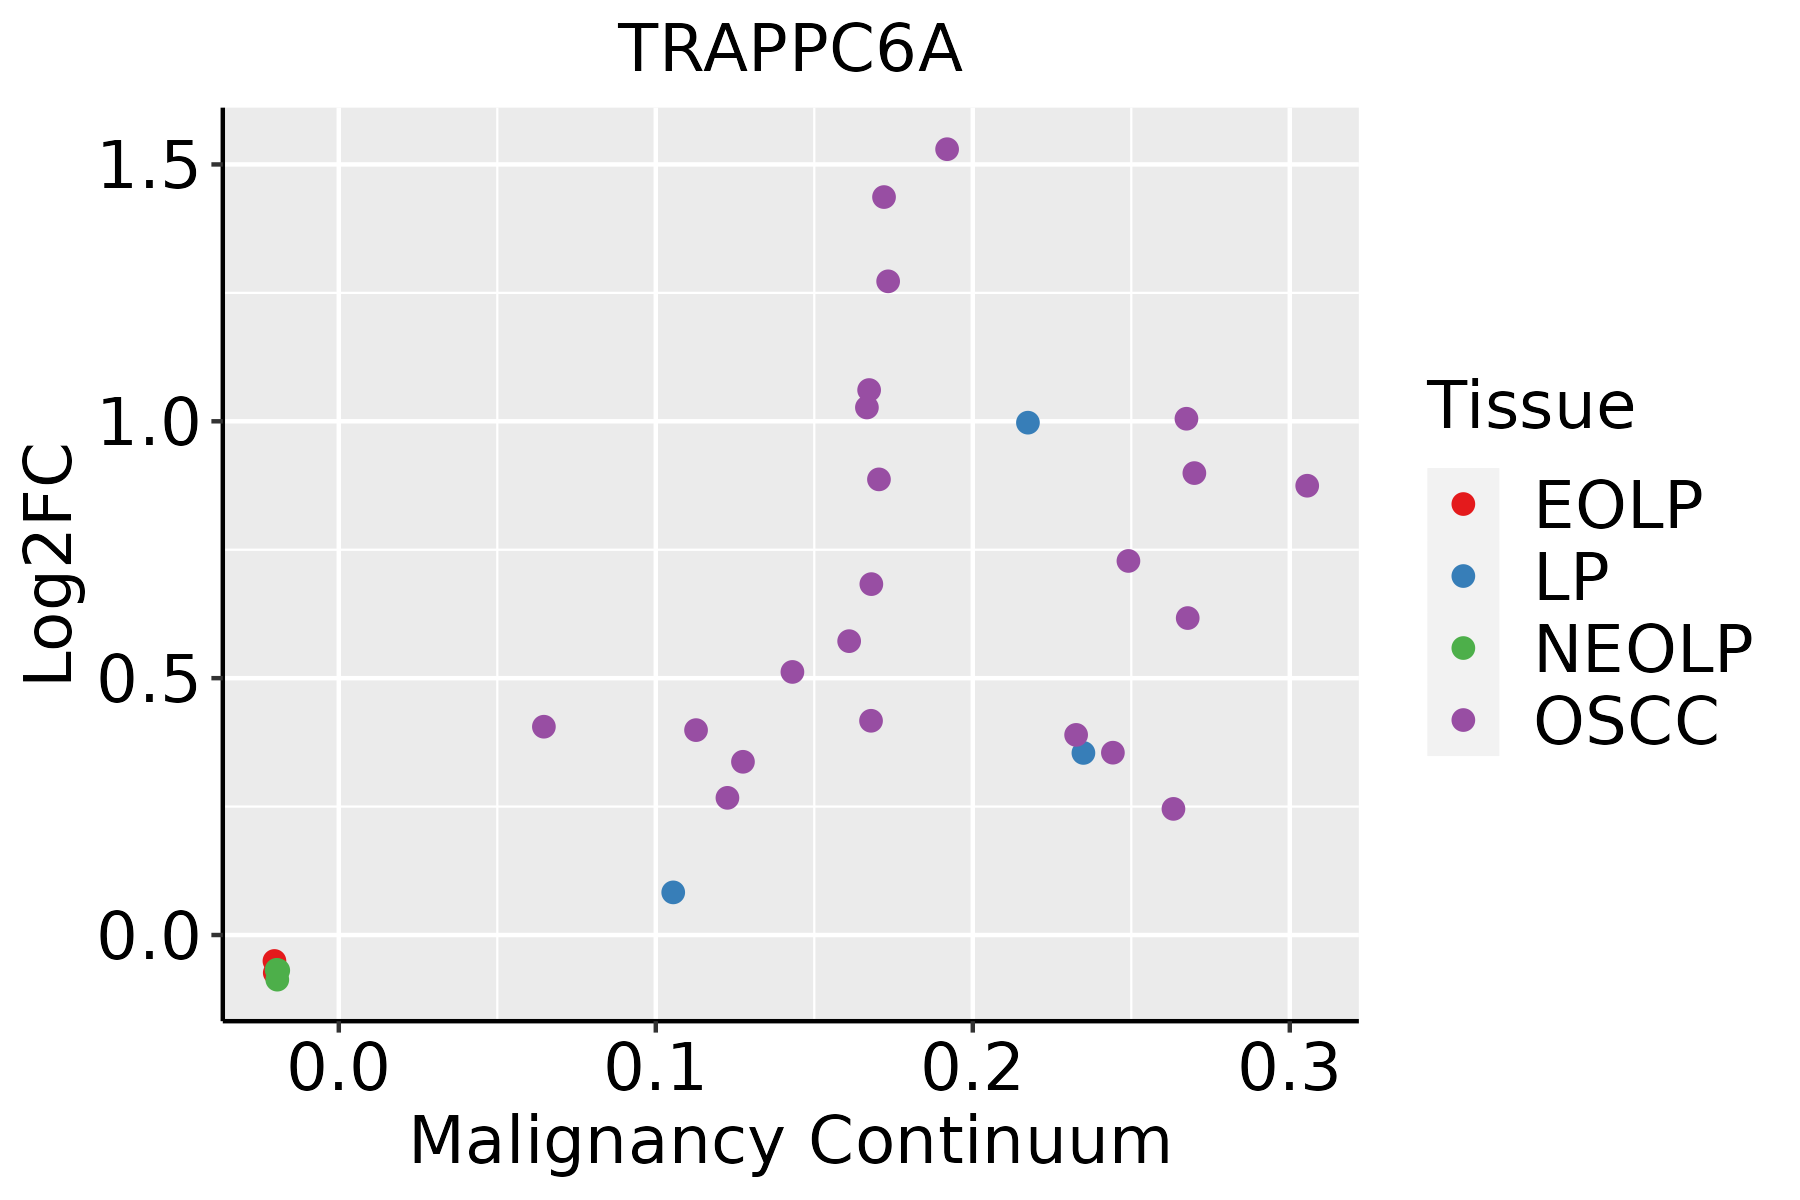 | EOLP: Erosive Oral lichen planus |
| LP: leukoplakia | ||
| NEOLP: Non-erosive oral lichen planus | ||
| OSCC: Oral squamous cell carcinoma | ||
| Prostate | 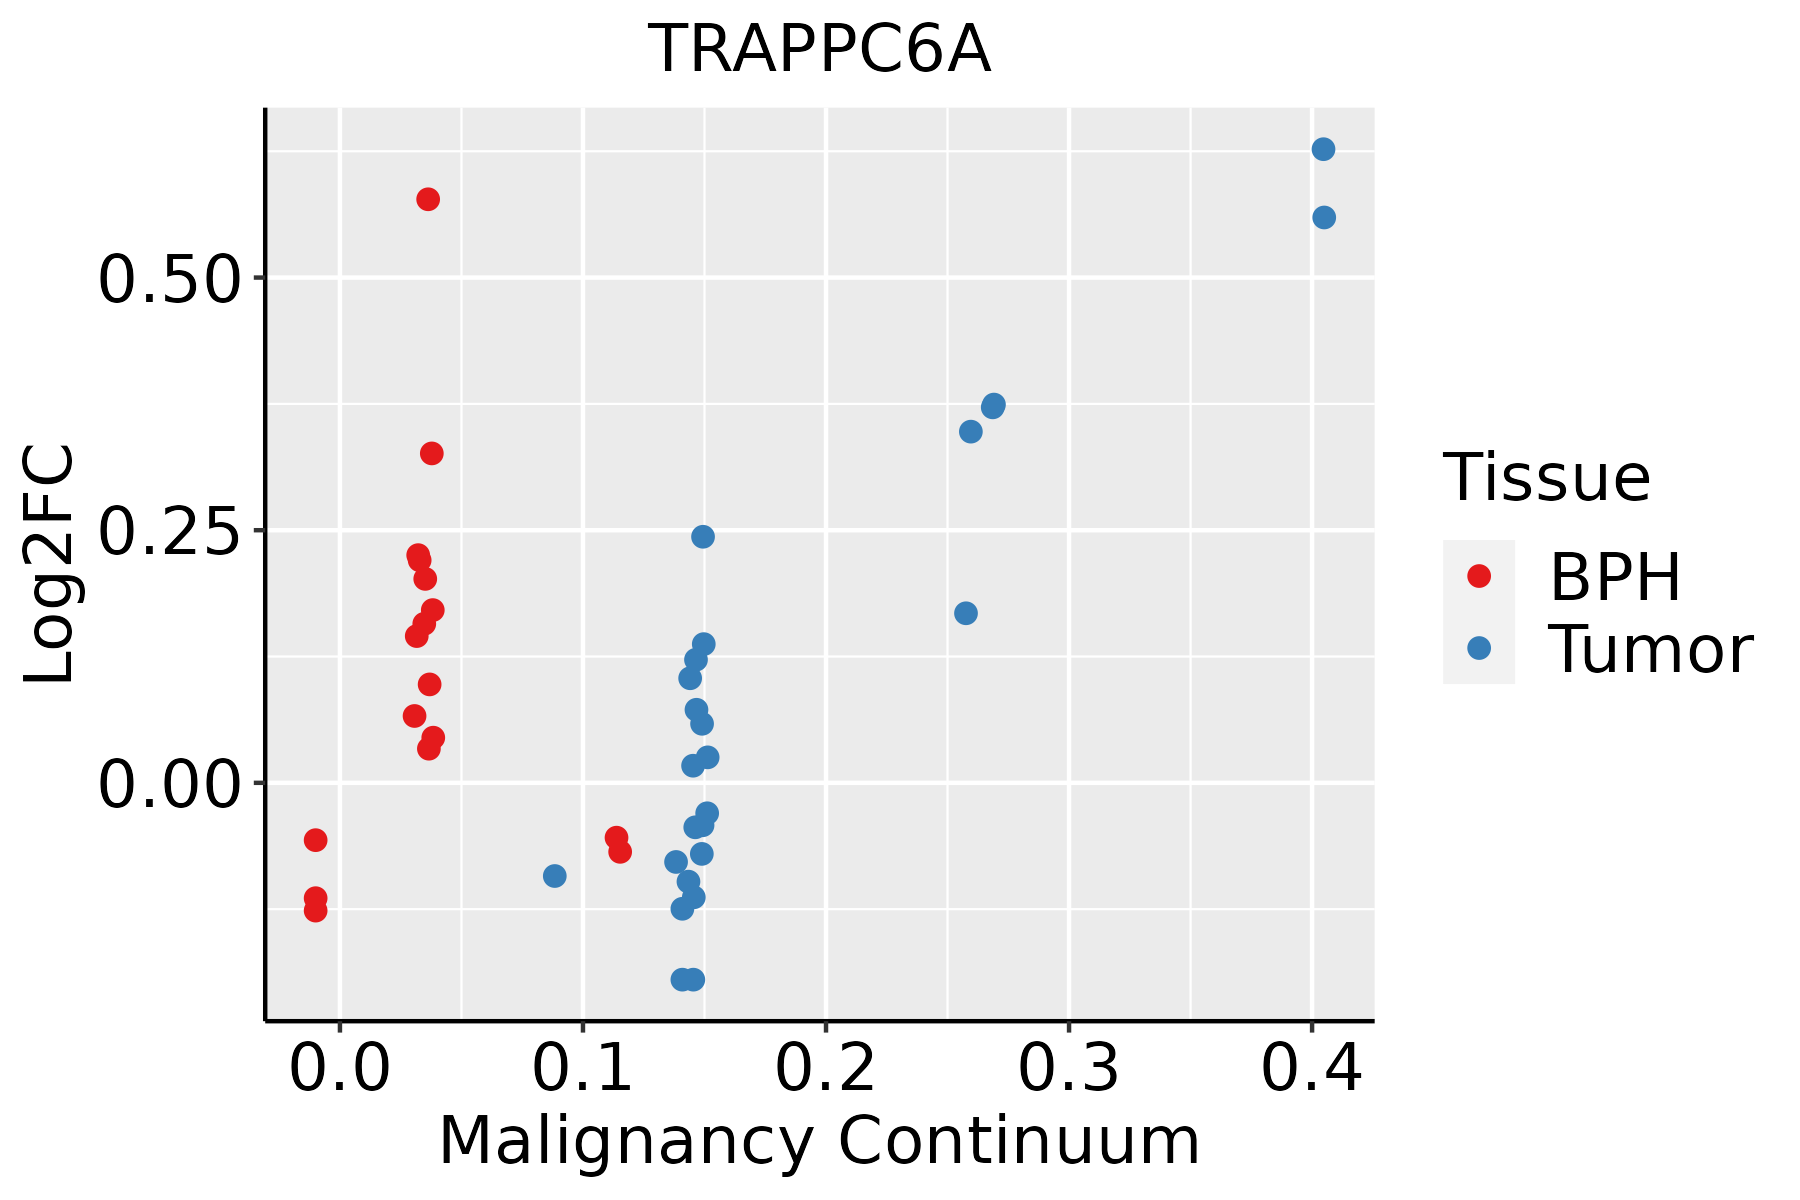 | BPH: Benign Prostatic Hyperplasia |
| Skin | 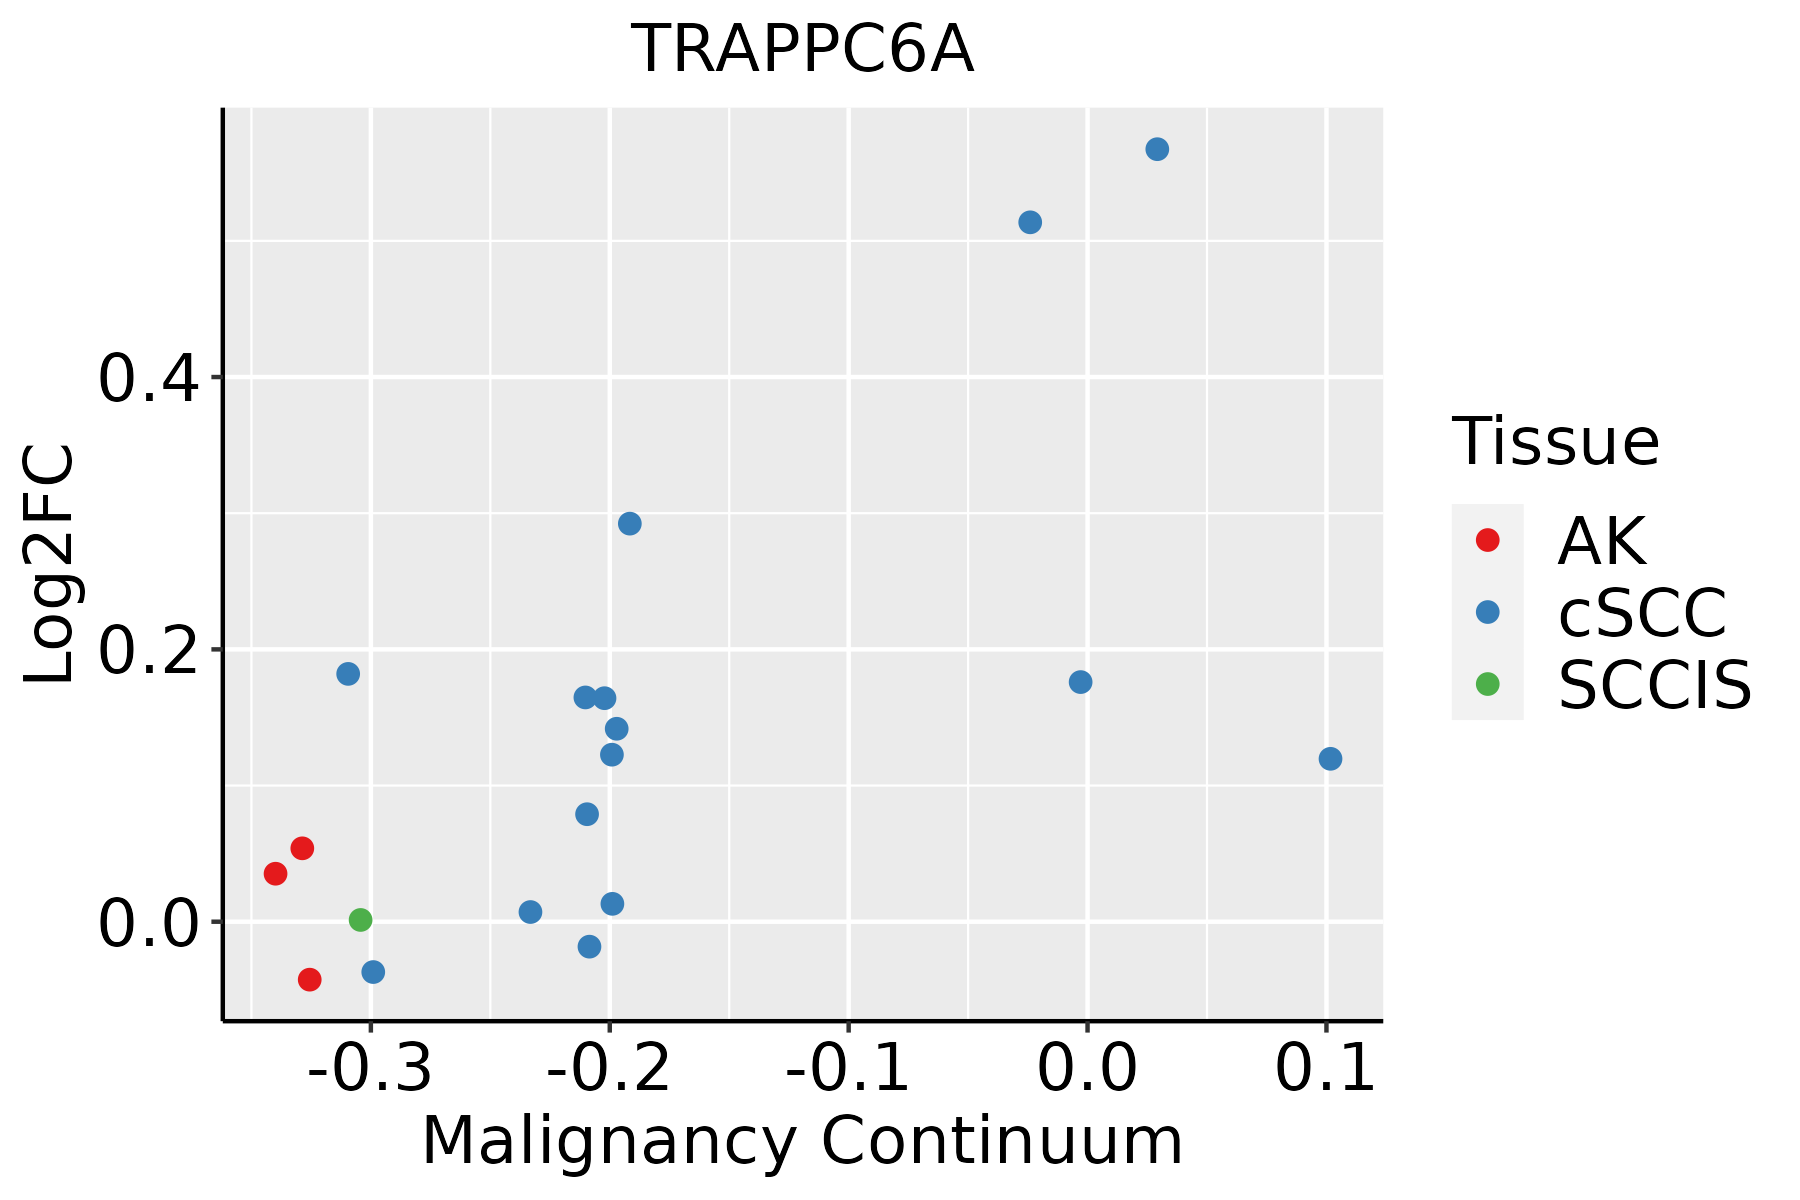 | AK: Actinic keratosis |
| cSCC: Cutaneous squamous cell carcinoma | ||
| SCCIS:squamous cell carcinoma in situ |
| ∗log2FC in expression of this searched gene in stem-like cells from each diseased tissue sample relative to stem-like cells in normal samples in each tissue plotted against the malignancy continuum. Samples are colored based on if they are from different disease stage. |
Top |
Malignant transformation related pathway analysis |
| Find out the enriched GO biological processes and KEGG pathways involved in transition from healthy to precancer to cancer |
| Tissue | Disease Stage | Enriched GO biological Processes |
| Colorectum | AD |  |
| Colorectum | SER |  |
| Colorectum | MSS |  |
| Colorectum | MSI-H |  |
| Colorectum | FAP |  |
| ∗Top 15 enriched GO BP terms are showed in the bar plot of each disease state in each tissue. Each row represents a significant GO biological process which is colored according to the -log10(p.adjust). |
| Page: 1 2 3 4 5 6 7 8 9 |
| GO ID | Tissue | Disease Stage | Description | Gene Ratio | Bg Ratio | pvalue | p.adjust | Count |
| GO:0048193 | Colorectum | AD | Golgi vesicle transport | 109/3918 | 296/18723 | 1.80e-10 | 1.68e-08 | 109 |
| GO:0016050 | Colorectum | AD | vesicle organization | 101/3918 | 300/18723 | 1.65e-07 | 7.17e-06 | 101 |
| GO:0043087 | Colorectum | AD | regulation of GTPase activity | 110/3918 | 348/18723 | 1.64e-06 | 5.03e-05 | 110 |
| GO:0006888 | Colorectum | AD | endoplasmic reticulum to Golgi vesicle-mediated transport | 44/3918 | 130/18723 | 4.13e-04 | 4.68e-03 | 44 |
| GO:00481931 | Colorectum | SER | Golgi vesicle transport | 79/2897 | 296/18723 | 4.20e-07 | 2.15e-05 | 79 |
| GO:00160501 | Colorectum | SER | vesicle organization | 69/2897 | 300/18723 | 3.59e-04 | 5.61e-03 | 69 |
| GO:00430871 | Colorectum | SER | regulation of GTPase activity | 77/2897 | 348/18723 | 5.90e-04 | 8.07e-03 | 77 |
| GO:00068881 | Colorectum | SER | endoplasmic reticulum to Golgi vesicle-mediated transport | 34/2897 | 130/18723 | 1.13e-03 | 1.29e-02 | 34 |
| GO:00481932 | Colorectum | MSS | Golgi vesicle transport | 101/3467 | 296/18723 | 9.09e-11 | 9.77e-09 | 101 |
| GO:00160502 | Colorectum | MSS | vesicle organization | 93/3467 | 300/18723 | 1.04e-07 | 4.97e-06 | 93 |
| GO:00430872 | Colorectum | MSS | regulation of GTPase activity | 101/3467 | 348/18723 | 1.00e-06 | 3.46e-05 | 101 |
| GO:00068882 | Colorectum | MSS | endoplasmic reticulum to Golgi vesicle-mediated transport | 44/3467 | 130/18723 | 2.17e-05 | 4.60e-04 | 44 |
| GO:004819318 | Esophagus | ESCC | Golgi vesicle transport | 231/8552 | 296/18723 | 1.82e-30 | 9.63e-28 | 231 |
| GO:001605014 | Esophagus | ESCC | vesicle organization | 211/8552 | 300/18723 | 2.85e-18 | 2.87e-16 | 211 |
| GO:000688815 | Esophagus | ESCC | endoplasmic reticulum to Golgi vesicle-mediated transport | 102/8552 | 130/18723 | 1.73e-14 | 9.22e-13 | 102 |
| GO:00330593 | Esophagus | ESCC | cellular pigmentation | 40/8552 | 53/18723 | 9.67e-06 | 9.21e-05 | 40 |
| GO:00487531 | Esophagus | ESCC | pigment granule organization | 23/8552 | 29/18723 | 2.25e-04 | 1.40e-03 | 23 |
| GO:00324381 | Esophagus | ESCC | melanosome organization | 22/8552 | 28/18723 | 3.95e-04 | 2.26e-03 | 22 |
| GO:00434731 | Esophagus | ESCC | pigmentation | 59/8552 | 98/18723 | 2.64e-03 | 1.12e-02 | 59 |
| GO:004308715 | Esophagus | ESCC | regulation of GTPase activity | 183/8552 | 348/18723 | 5.34e-03 | 2.00e-02 | 183 |
| Page: 1 2 3 |
| Pathway ID | Tissue | Disease Stage | Description | Gene Ratio | Bg Ratio | pvalue | p.adjust | qvalue | Count |
| Page: 1 |
Top |
Cell-cell communication analysis |
| Identification of potential cell-cell interactions between two cell types and their ligand-receptor pairs for different disease states |
| Ligand | Receptor | LRpair | Pathway | Tissue | Disease Stage |
| Page: 1 |
Top |
Single-cell gene regulatory network inference analysis |
| Find out the significant the regulons (TFs) and the target genes of each regulon across cell types for different disease states |
| TF | Cell Type | Tissue | Disease Stage | Target Gene | RSS | Regulon Activity |
| ∗The dot plots of a searched regulon are shown for all cell subpopulations in each disease state of each tissue based on the regulon specific score inferred using pySCENIC and by calculating the average expression. |
| Page: 1 |
Top |
Somatic mutation of malignant transformation related genes |
| Annotation of somatic variants for genes involved in malignant transformation |
| Hugo Symbol | Variant Class | Variant Classification | dbSNP RS | HGVSc | HGVSp | HGVSp Short | SWISSPROT | BIOTYPE | SIFT | PolyPhen | Tumor Sample Barcode | Tissue | Histology | Sex | Age | Stage | Therapy Types | Drugs | Outcome |
| TRAPPC6A | SNV | Missense_Mutation | c.64N>T | p.Asp22Tyr | p.D22Y | O75865 | protein_coding | deleterious(0.01) | possibly_damaging(0.596) | TCGA-A6-5665-01 | Colorectum | colon adenocarcinoma | Female | >=65 | I/II | Unknown | Unknown | PD | |
| TRAPPC6A | SNV | Missense_Mutation | c.431C>T | p.Ala144Val | p.A144V | O75865 | protein_coding | tolerated(0.06) | benign(0.005) | TCGA-AA-3489-01 | Colorectum | colon adenocarcinoma | Male | >=65 | I/II | Unknown | Unknown | PD | |
| TRAPPC6A | SNV | Missense_Mutation | rs369161508 | c.430N>A | p.Ala144Thr | p.A144T | O75865 | protein_coding | tolerated(0.37) | benign(0.001) | TCGA-CK-4951-01 | Colorectum | colon adenocarcinoma | Female | >=65 | I/II | Unknown | Unknown | PD |
| TRAPPC6A | SNV | Missense_Mutation | novel | c.331G>T | p.Asp111Tyr | p.D111Y | O75865 | protein_coding | deleterious(0) | probably_damaging(0.999) | TCGA-F5-6814-01 | Colorectum | rectum adenocarcinoma | Male | <65 | I/II | Unknown | Unknown | SD |
| TRAPPC6A | SNV | Missense_Mutation | c.361G>A | p.Ala121Thr | p.A121T | O75865 | protein_coding | tolerated(0.08) | benign(0.328) | TCGA-AP-A0LM-01 | Endometrium | uterine corpus endometrioid carcinoma | Female | <65 | III/IV | Chemotherapy | cisplatin | SD | |
| TRAPPC6A | SNV | Missense_Mutation | rs779559993 | c.169C>T | p.Arg57Cys | p.R57C | O75865 | protein_coding | deleterious(0.02) | probably_damaging(0.986) | TCGA-AP-A0LM-01 | Endometrium | uterine corpus endometrioid carcinoma | Female | <65 | III/IV | Chemotherapy | cisplatin | SD |
| TRAPPC6A | SNV | Missense_Mutation | c.221N>T | p.Arg74Met | p.R74M | O75865 | protein_coding | deleterious(0) | possibly_damaging(0.861) | TCGA-AX-A06H-01 | Endometrium | uterine corpus endometrioid carcinoma | Female | <65 | III/IV | Chemotherapy | paclitaxel | SD | |
| TRAPPC6A | SNV | Missense_Mutation | rs201133555 | c.466N>A | p.Ala156Thr | p.A156T | O75865 | protein_coding | tolerated(0.09) | benign(0.013) | TCGA-AX-A0IZ-01 | Endometrium | uterine corpus endometrioid carcinoma | Female | <65 | I/II | Unknown | Unknown | SD |
| TRAPPC6A | SNV | Missense_Mutation | novel | c.39N>T | p.Glu13Asp | p.E13D | O75865 | protein_coding | deleterious(0.02) | benign(0.015) | TCGA-AX-A2HC-01 | Endometrium | uterine corpus endometrioid carcinoma | Female | <65 | III/IV | Chemotherapy | paclitaxel | PD |
| TRAPPC6A | SNV | Missense_Mutation | rs780966582 | c.269N>T | p.Ala90Val | p.A90V | O75865 | protein_coding | tolerated(0.12) | probably_damaging(0.99) | TCGA-EY-A1GU-01 | Endometrium | uterine corpus endometrioid carcinoma | Female | >=65 | I/II | Unknown | Unknown | SD |
| Page: 1 2 |
Top |
Related drugs of malignant transformation related genes |
| Identification of chemicals and drugs interact with genes involved in malignant transfromation |
| (DGIdb 4.0) |
| Entrez ID | Symbol | Category | Interaction Types | Drug Claim Name | Drug Name | PMIDs |
| Page: 1 |

Copyright 2023-Present -The University of Texas Health Science Center at Houston |