
|
|||||
|
 | |
| |
| |
| |
| |
| |
|
Gene: TRAPPC5 |
Gene summary for TRAPPC5 |
| Gene information | Species | Human | Gene symbol | TRAPPC5 | Gene ID | 126003 |
| Gene name | trafficking protein particle complex subunit 5 | |
| Gene Alias | TRS31 | |
| Cytomap | 19p13.2 | |
| Gene Type | protein-coding | GO ID | GO:0006810 | UniProtAcc | Q8IUR0 |
Top |
Malignant transformation analysis |
| Identification of the aberrant gene expression in precancerous and cancerous lesions by comparing the gene expression of stem-like cells in diseased tissues with normal stem cells |
| Entrez ID | Symbol | Replicates | Species | Organ | Tissue | Adj P-value | Log2FC | Malignancy |
| 126003 | TRAPPC5 | sample1 | Human | Cervix | CC | 7.28e-22 | 6.83e-01 | 0.0959 |
| 126003 | TRAPPC5 | sample3 | Human | Cervix | CC | 4.29e-63 | 7.83e-01 | 0.1387 |
| 126003 | TRAPPC5 | H2 | Human | Cervix | HSIL_HPV | 4.72e-25 | 5.46e-01 | 0.0632 |
| 126003 | TRAPPC5 | L1 | Human | Cervix | CC | 1.82e-08 | 4.72e-01 | 0.0802 |
| 126003 | TRAPPC5 | T1 | Human | Cervix | CC | 7.51e-31 | 6.20e-01 | 0.0918 |
| 126003 | TRAPPC5 | T2 | Human | Cervix | CC | 5.02e-16 | 5.37e-01 | 0.0709 |
| 126003 | TRAPPC5 | T3 | Human | Cervix | CC | 3.68e-56 | 8.15e-01 | 0.1389 |
| 126003 | TRAPPC5 | AEH-subject1 | Human | Endometrium | AEH | 1.55e-34 | 7.11e-01 | -0.3059 |
| 126003 | TRAPPC5 | AEH-subject2 | Human | Endometrium | AEH | 2.88e-33 | 7.41e-01 | -0.2525 |
| 126003 | TRAPPC5 | AEH-subject3 | Human | Endometrium | AEH | 1.18e-39 | 8.25e-01 | -0.2576 |
| 126003 | TRAPPC5 | AEH-subject4 | Human | Endometrium | AEH | 3.55e-10 | 3.73e-01 | -0.2657 |
| 126003 | TRAPPC5 | AEH-subject5 | Human | Endometrium | AEH | 4.00e-11 | 3.14e-01 | -0.2953 |
| 126003 | TRAPPC5 | EEC-subject1 | Human | Endometrium | EEC | 6.16e-08 | 3.88e-01 | -0.2682 |
| 126003 | TRAPPC5 | EEC-subject2 | Human | Endometrium | EEC | 4.00e-42 | 8.26e-01 | -0.2607 |
| 126003 | TRAPPC5 | EEC-subject4 | Human | Endometrium | EEC | 1.59e-24 | 5.55e-01 | -0.2571 |
| 126003 | TRAPPC5 | EEC-subject5 | Human | Endometrium | EEC | 2.81e-20 | 5.19e-01 | -0.249 |
| 126003 | TRAPPC5 | LZE2D | Human | Esophagus | HGIN | 8.51e-13 | 1.05e+00 | 0.0642 |
| 126003 | TRAPPC5 | LZE2T | Human | Esophagus | ESCC | 5.18e-16 | 9.83e-01 | 0.082 |
| 126003 | TRAPPC5 | LZE3D | Human | Esophagus | HGIN | 3.03e-03 | 9.83e-01 | 0.0668 |
| 126003 | TRAPPC5 | LZE4T | Human | Esophagus | ESCC | 5.76e-40 | 1.16e+00 | 0.0811 |
| Page: 1 2 3 4 5 6 7 |
| Tissue | Expression Dynamics | Abbreviation |
| Cervix | 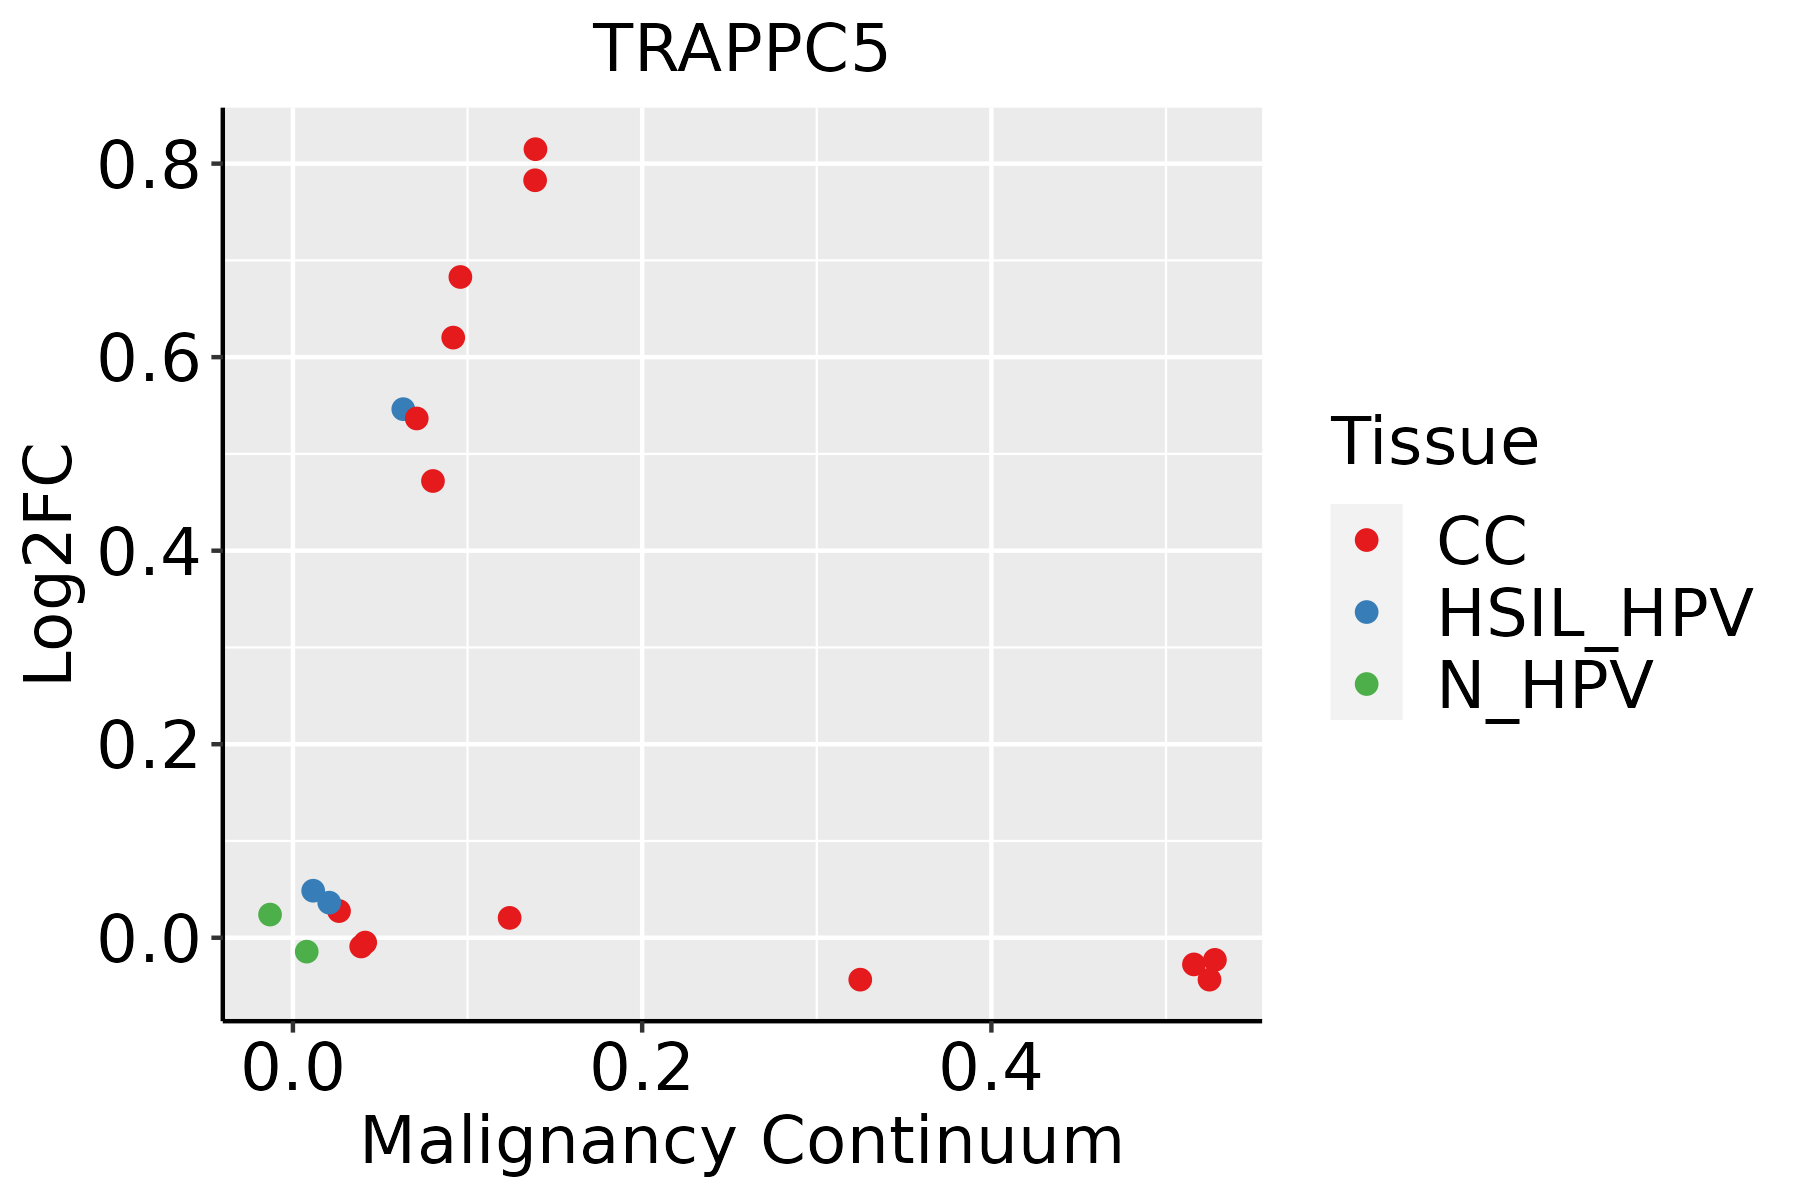 | CC: Cervix cancer |
| HSIL_HPV: HPV-infected high-grade squamous intraepithelial lesions | ||
| N_HPV: HPV-infected normal cervix | ||
| Endometrium |  | AEH: Atypical endometrial hyperplasia |
| EEC: Endometrioid Cancer | ||
| Esophagus | 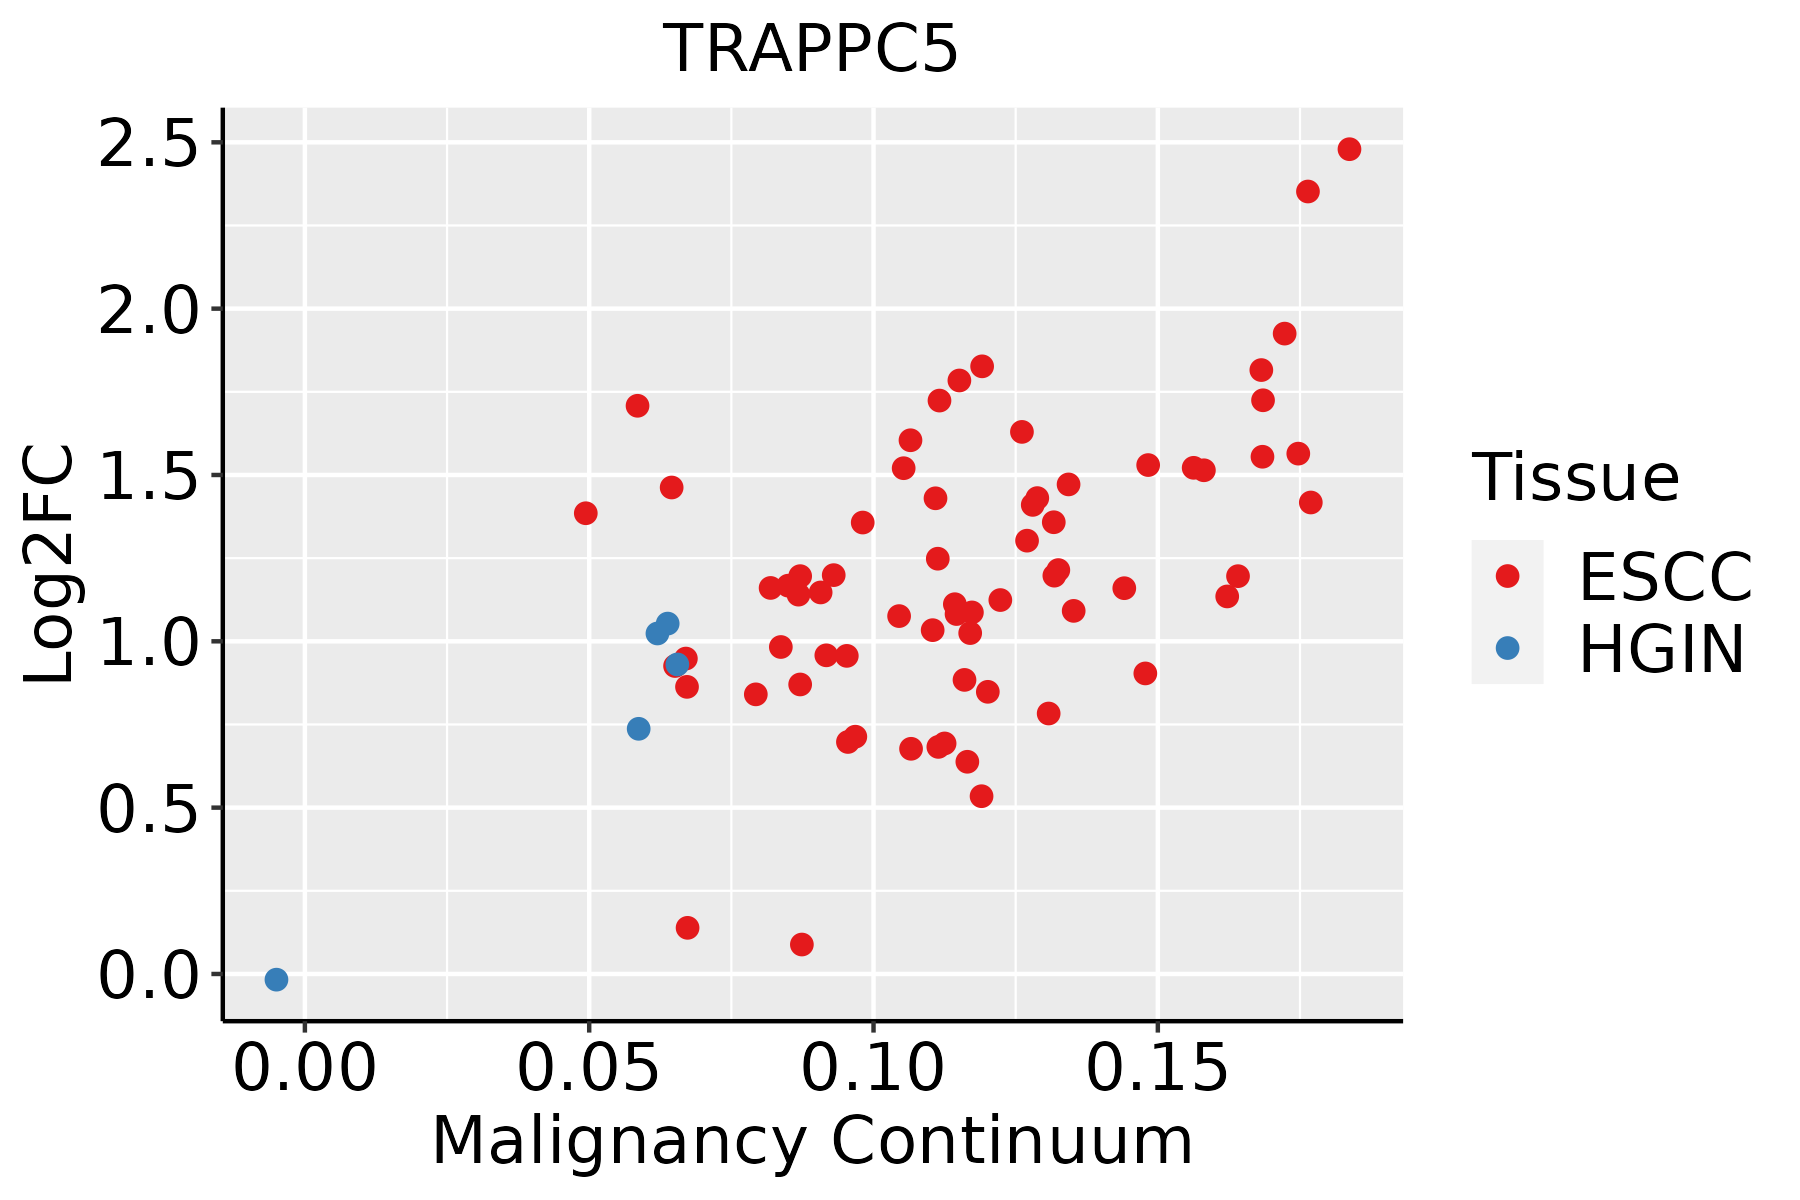 | ESCC: Esophageal squamous cell carcinoma |
| HGIN: High-grade intraepithelial neoplasias | ||
| LGIN: Low-grade intraepithelial neoplasias | ||
| GC |  | CAG: Chronic atrophic gastritis |
| CAG with IM: Chronic atrophic gastritis with intestinal metaplasia | ||
| CSG: Chronic superficial gastritis | ||
| GC: Gastric cancer | ||
| SIM: Severe intestinal metaplasia | ||
| WIM: Wild intestinal metaplasia | ||
| Liver | 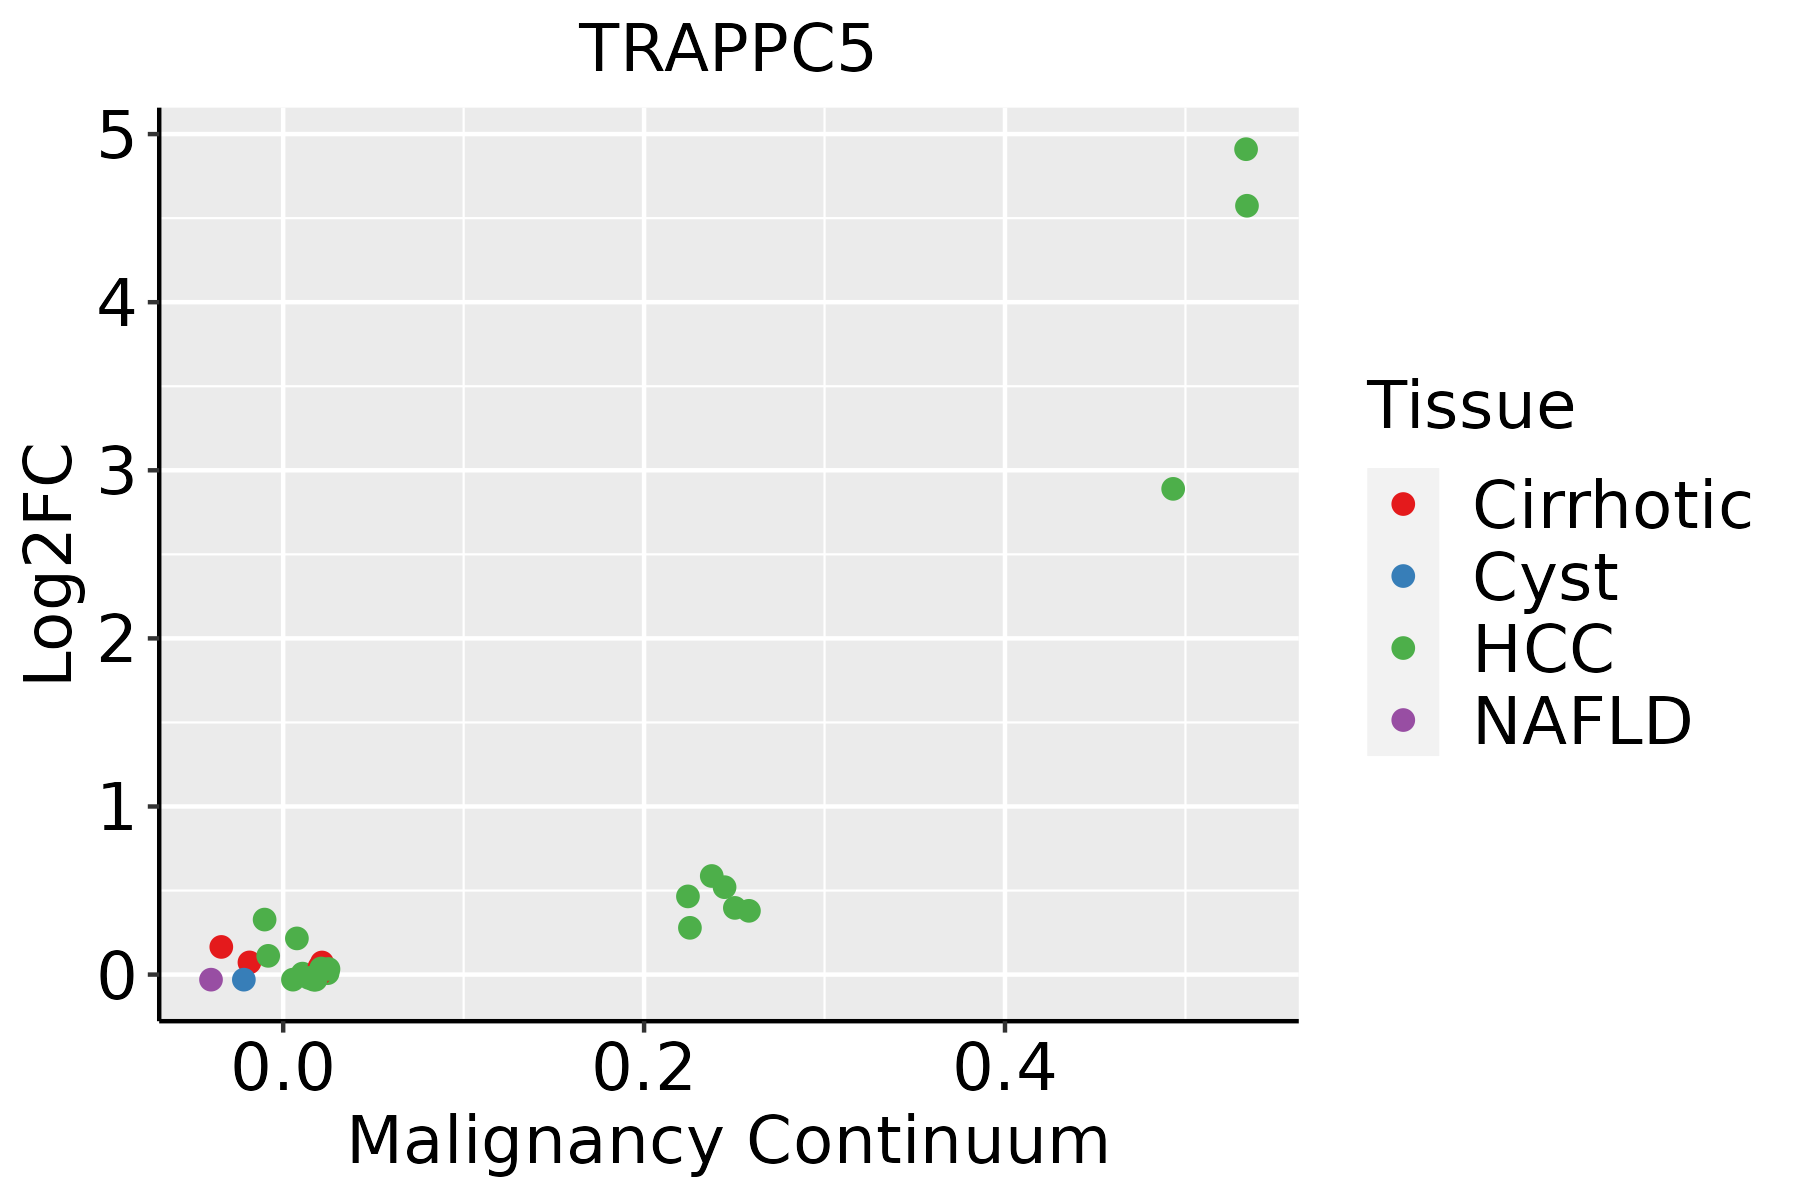 | HCC: Hepatocellular carcinoma |
| NAFLD: Non-alcoholic fatty liver disease | ||
| Skin | 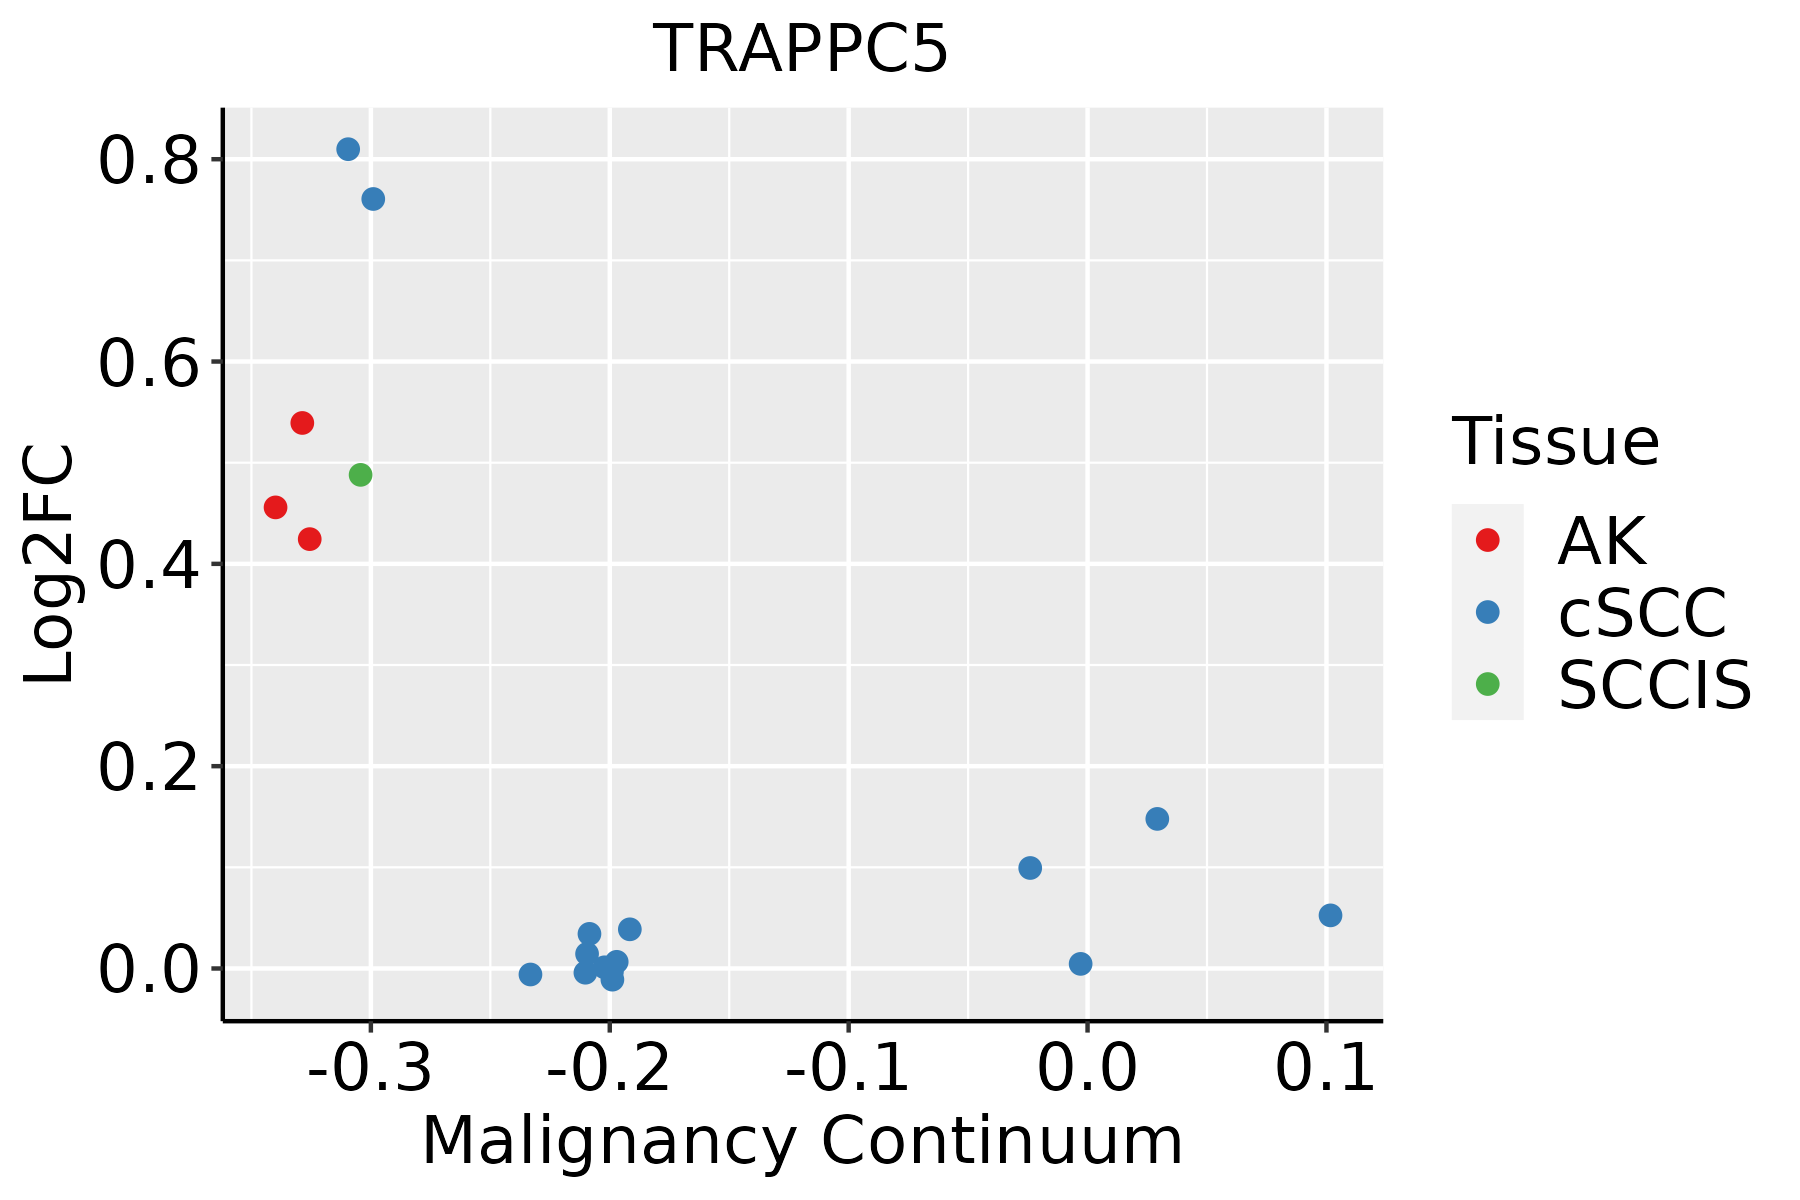 | AK: Actinic keratosis |
| cSCC: Cutaneous squamous cell carcinoma | ||
| SCCIS:squamous cell carcinoma in situ |
| ∗log2FC in expression of this searched gene in stem-like cells from each diseased tissue sample relative to stem-like cells in normal samples in each tissue plotted against the malignancy continuum. Samples are colored based on if they are from different disease stage. |
Top |
Malignant transformation related pathway analysis |
| Find out the enriched GO biological processes and KEGG pathways involved in transition from healthy to precancer to cancer |
| Tissue | Disease Stage | Enriched GO biological Processes |
| Colorectum | AD |  |
| Colorectum | SER |  |
| Colorectum | MSS |  |
| Colorectum | MSI-H |  |
| Colorectum | FAP |  |
| ∗Top 15 enriched GO BP terms are showed in the bar plot of each disease state in each tissue. Each row represents a significant GO biological process which is colored according to the -log10(p.adjust). |
| Page: 1 2 3 4 5 6 7 8 9 |
| GO ID | Tissue | Disease Stage | Description | Gene Ratio | Bg Ratio | pvalue | p.adjust | Count |
| GO:00481938 | Cervix | CC | Golgi vesicle transport | 58/2311 | 296/18723 | 2.24e-04 | 2.54e-03 | 58 |
| GO:00481939 | Endometrium | AEH | Golgi vesicle transport | 60/2100 | 296/18723 | 3.65e-06 | 9.79e-05 | 60 |
| GO:00068886 | Endometrium | AEH | endoplasmic reticulum to Golgi vesicle-mediated transport | 29/2100 | 130/18723 | 2.11e-04 | 2.59e-03 | 29 |
| GO:004819313 | Endometrium | EEC | Golgi vesicle transport | 60/2168 | 296/18723 | 9.91e-06 | 2.17e-04 | 60 |
| GO:000688812 | Endometrium | EEC | endoplasmic reticulum to Golgi vesicle-mediated transport | 29/2168 | 130/18723 | 3.63e-04 | 3.95e-03 | 29 |
| GO:004819317 | Esophagus | HGIN | Golgi vesicle transport | 83/2587 | 296/18723 | 8.59e-11 | 8.89e-09 | 83 |
| GO:00068889 | Esophagus | HGIN | endoplasmic reticulum to Golgi vesicle-mediated transport | 40/2587 | 130/18723 | 4.67e-07 | 2.07e-05 | 40 |
| GO:004819318 | Esophagus | ESCC | Golgi vesicle transport | 231/8552 | 296/18723 | 1.82e-30 | 9.63e-28 | 231 |
| GO:000688815 | Esophagus | ESCC | endoplasmic reticulum to Golgi vesicle-mediated transport | 102/8552 | 130/18723 | 1.73e-14 | 9.22e-13 | 102 |
| GO:004819321 | Liver | HCC | Golgi vesicle transport | 217/7958 | 296/18723 | 2.58e-27 | 1.02e-24 | 217 |
| GO:000688821 | Liver | HCC | endoplasmic reticulum to Golgi vesicle-mediated transport | 100/7958 | 130/18723 | 1.15e-15 | 8.67e-14 | 100 |
| GO:004819319 | Skin | AK | Golgi vesicle transport | 47/1910 | 296/18723 | 1.46e-03 | 1.06e-02 | 47 |
| GO:0048193110 | Skin | cSCC | Golgi vesicle transport | 153/4864 | 296/18723 | 1.85e-21 | 3.41e-19 | 153 |
| GO:000688810 | Skin | cSCC | endoplasmic reticulum to Golgi vesicle-mediated transport | 73/4864 | 130/18723 | 2.60e-13 | 1.57e-11 | 73 |
| Page: 1 |
| Pathway ID | Tissue | Disease Stage | Description | Gene Ratio | Bg Ratio | pvalue | p.adjust | qvalue | Count |
| Page: 1 |
Top |
Cell-cell communication analysis |
| Identification of potential cell-cell interactions between two cell types and their ligand-receptor pairs for different disease states |
| Ligand | Receptor | LRpair | Pathway | Tissue | Disease Stage |
| Page: 1 |
Top |
Single-cell gene regulatory network inference analysis |
| Find out the significant the regulons (TFs) and the target genes of each regulon across cell types for different disease states |
| TF | Cell Type | Tissue | Disease Stage | Target Gene | RSS | Regulon Activity |
| ∗The dot plots of a searched regulon are shown for all cell subpopulations in each disease state of each tissue based on the regulon specific score inferred using pySCENIC and by calculating the average expression. |
| Page: 1 |
Top |
Somatic mutation of malignant transformation related genes |
| Annotation of somatic variants for genes involved in malignant transformation |
| Hugo Symbol | Variant Class | Variant Classification | dbSNP RS | HGVSc | HGVSp | HGVSp Short | SWISSPROT | BIOTYPE | SIFT | PolyPhen | Tumor Sample Barcode | Tissue | Histology | Sex | Age | Stage | Therapy Types | Drugs | Outcome |
| TRAPPC5 | SNV | Missense_Mutation | novel | c.40N>A | p.Glu14Lys | p.E14K | Q8IUR0 | protein_coding | deleterious(0) | possibly_damaging(0.585) | TCGA-C8-A8HQ-01 | Breast | breast invasive carcinoma | Female | <65 | I/II | Unknown | Unknown | SD |
| TRAPPC5 | SNV | Missense_Mutation | rs751508950 | c.149N>C | p.Leu50Pro | p.L50P | Q8IUR0 | protein_coding | deleterious(0) | probably_damaging(0.999) | TCGA-OL-A66O-01 | Breast | breast invasive carcinoma | Female | <65 | I/II | Chemotherapy | cytoxan | CR |
| TRAPPC5 | SNV | Missense_Mutation | c.328N>A | p.Asp110Asn | p.D110N | Q8IUR0 | protein_coding | tolerated(0.06) | probably_damaging(0.964) | TCGA-IR-A3LK-01 | Cervix | cervical & endocervical cancer | Female | >=65 | I/II | Chemotherapy | cisplatin | PD | |
| TRAPPC5 | insertion | In_Frame_Ins | novel | c.463_464insCATCCA | p.Gly155delinsAlaSerSer | p.G155delinsASS | Q8IUR0 | protein_coding | TCGA-DS-A1OB-01 | Cervix | cervical & endocervical cancer | Female | <65 | I/II | Chemotherapy | carboplatin | PD | ||
| TRAPPC5 | SNV | Missense_Mutation | c.482C>T | p.Thr161Met | p.T161M | Q8IUR0 | protein_coding | deleterious(0) | probably_damaging(0.985) | TCGA-AD-6895-01 | Colorectum | colon adenocarcinoma | Male | >=65 | III/IV | Unknown | Unknown | SD | |
| TRAPPC5 | SNV | Missense_Mutation | rs767417495 | c.358C>T | p.Arg120Cys | p.R120C | Q8IUR0 | protein_coding | deleterious(0.01) | possibly_damaging(0.809) | TCGA-G4-6588-01 | Colorectum | colon adenocarcinoma | Female | <65 | I/II | Unknown | Unknown | SD |
| TRAPPC5 | SNV | Missense_Mutation | rs752705420 | c.203N>T | p.Ala68Val | p.A68V | Q8IUR0 | protein_coding | tolerated(0.15) | benign(0) | TCGA-NH-A5IV-01 | Colorectum | colon adenocarcinoma | Female | >=65 | I/II | Unknown | Unknown | SD |
| TRAPPC5 | SNV | Missense_Mutation | rs201747018 | c.562N>T | p.Arg188Cys | p.R188C | Q8IUR0 | protein_coding | deleterious(0) | probably_damaging(0.964) | TCGA-5B-A90C-01 | Endometrium | uterine corpus endometrioid carcinoma | Female | >=65 | I/II | Chemotherapy | carboplatin | SD |
| TRAPPC5 | SNV | Missense_Mutation | rs767417495 | c.358N>T | p.Arg120Cys | p.R120C | Q8IUR0 | protein_coding | deleterious(0.01) | possibly_damaging(0.809) | TCGA-D1-A103-01 | Endometrium | uterine corpus endometrioid carcinoma | Female | >=65 | I/II | Unknown | Unknown | SD |
| TRAPPC5 | SNV | Missense_Mutation | c.328N>A | p.Asp110Asn | p.D110N | Q8IUR0 | protein_coding | tolerated(0.06) | probably_damaging(0.964) | TCGA-EO-A22R-01 | Endometrium | uterine corpus endometrioid carcinoma | Female | <65 | I/II | Unknown | Unknown | SD |
| Page: 1 2 |
Top |
Related drugs of malignant transformation related genes |
| Identification of chemicals and drugs interact with genes involved in malignant transfromation |
| (DGIdb 4.0) |
| Entrez ID | Symbol | Category | Interaction Types | Drug Claim Name | Drug Name | PMIDs |
| Page: 1 |

Copyright 2023-Present -The University of Texas Health Science Center at Houston |