
|
|||||
|
 | |
| |
| |
| |
| |
| |
|
Gene: TRAPPC2L |
Gene summary for TRAPPC2L |
| Gene information | Species | Human | Gene symbol | TRAPPC2L | Gene ID | 51693 |
| Gene name | trafficking protein particle complex subunit 2L | |
| Gene Alias | HSPC176 | |
| Cytomap | 16q24.3 | |
| Gene Type | protein-coding | GO ID | GO:0006810 | UniProtAcc | A0A0B4J294 |
Top |
Malignant transformation analysis |
| Identification of the aberrant gene expression in precancerous and cancerous lesions by comparing the gene expression of stem-like cells in diseased tissues with normal stem cells |
| Entrez ID | Symbol | Replicates | Species | Organ | Tissue | Adj P-value | Log2FC | Malignancy |
| 51693 | TRAPPC2L | GSM4909291 | Human | Breast | IDC | 3.23e-02 | 2.67e-01 | 0.1753 |
| 51693 | TRAPPC2L | GSM4909294 | Human | Breast | IDC | 1.35e-05 | 2.45e-01 | 0.2022 |
| 51693 | TRAPPC2L | GSM4909296 | Human | Breast | IDC | 2.75e-05 | 1.43e-01 | 0.1524 |
| 51693 | TRAPPC2L | GSM4909297 | Human | Breast | IDC | 1.19e-03 | -1.18e-01 | 0.1517 |
| 51693 | TRAPPC2L | GSM4909304 | Human | Breast | IDC | 3.33e-18 | 5.02e-01 | 0.1636 |
| 51693 | TRAPPC2L | GSM4909311 | Human | Breast | IDC | 2.69e-17 | -5.40e-02 | 0.1534 |
| 51693 | TRAPPC2L | GSM4909312 | Human | Breast | IDC | 9.40e-05 | -2.39e-02 | 0.1552 |
| 51693 | TRAPPC2L | GSM4909316 | Human | Breast | IDC | 3.42e-02 | 1.55e-01 | 0.21 |
| 51693 | TRAPPC2L | GSM4909319 | Human | Breast | IDC | 6.30e-22 | -1.28e-01 | 0.1563 |
| 51693 | TRAPPC2L | GSM4909320 | Human | Breast | IDC | 3.84e-04 | 2.06e-01 | 0.1575 |
| 51693 | TRAPPC2L | GSM4909321 | Human | Breast | IDC | 3.15e-11 | 1.25e-01 | 0.1559 |
| 51693 | TRAPPC2L | brca2 | Human | Breast | Precancer | 1.77e-03 | 2.30e-01 | -0.024 |
| 51693 | TRAPPC2L | NCCBC3 | Human | Breast | DCIS | 1.55e-02 | 7.18e-02 | 0.1198 |
| 51693 | TRAPPC2L | P1 | Human | Breast | IDC | 1.37e-02 | -1.60e-01 | 0.1527 |
| 51693 | TRAPPC2L | DCIS2 | Human | Breast | DCIS | 1.46e-58 | 7.75e-02 | 0.0085 |
| 51693 | TRAPPC2L | LZE4T | Human | Esophagus | ESCC | 9.25e-11 | 4.52e-01 | 0.0811 |
| 51693 | TRAPPC2L | LZE5T | Human | Esophagus | ESCC | 9.85e-05 | 6.96e-01 | 0.0514 |
| 51693 | TRAPPC2L | LZE7T | Human | Esophagus | ESCC | 5.48e-04 | 2.98e-01 | 0.0667 |
| 51693 | TRAPPC2L | LZE8T | Human | Esophagus | ESCC | 4.02e-11 | 5.05e-01 | 0.067 |
| 51693 | TRAPPC2L | LZE20T | Human | Esophagus | ESCC | 2.33e-08 | 4.80e-01 | 0.0662 |
| Page: 1 2 3 4 5 6 7 8 |
| Tissue | Expression Dynamics | Abbreviation |
| Breast |  | IDC: Invasive ductal carcinoma |
| DCIS: Ductal carcinoma in situ | ||
| Precancer(BRCA1-mut): Precancerous lesion from BRCA1 mutation carriers | ||
| Esophagus |  | ESCC: Esophageal squamous cell carcinoma |
| HGIN: High-grade intraepithelial neoplasias | ||
| LGIN: Low-grade intraepithelial neoplasias | ||
| Liver | 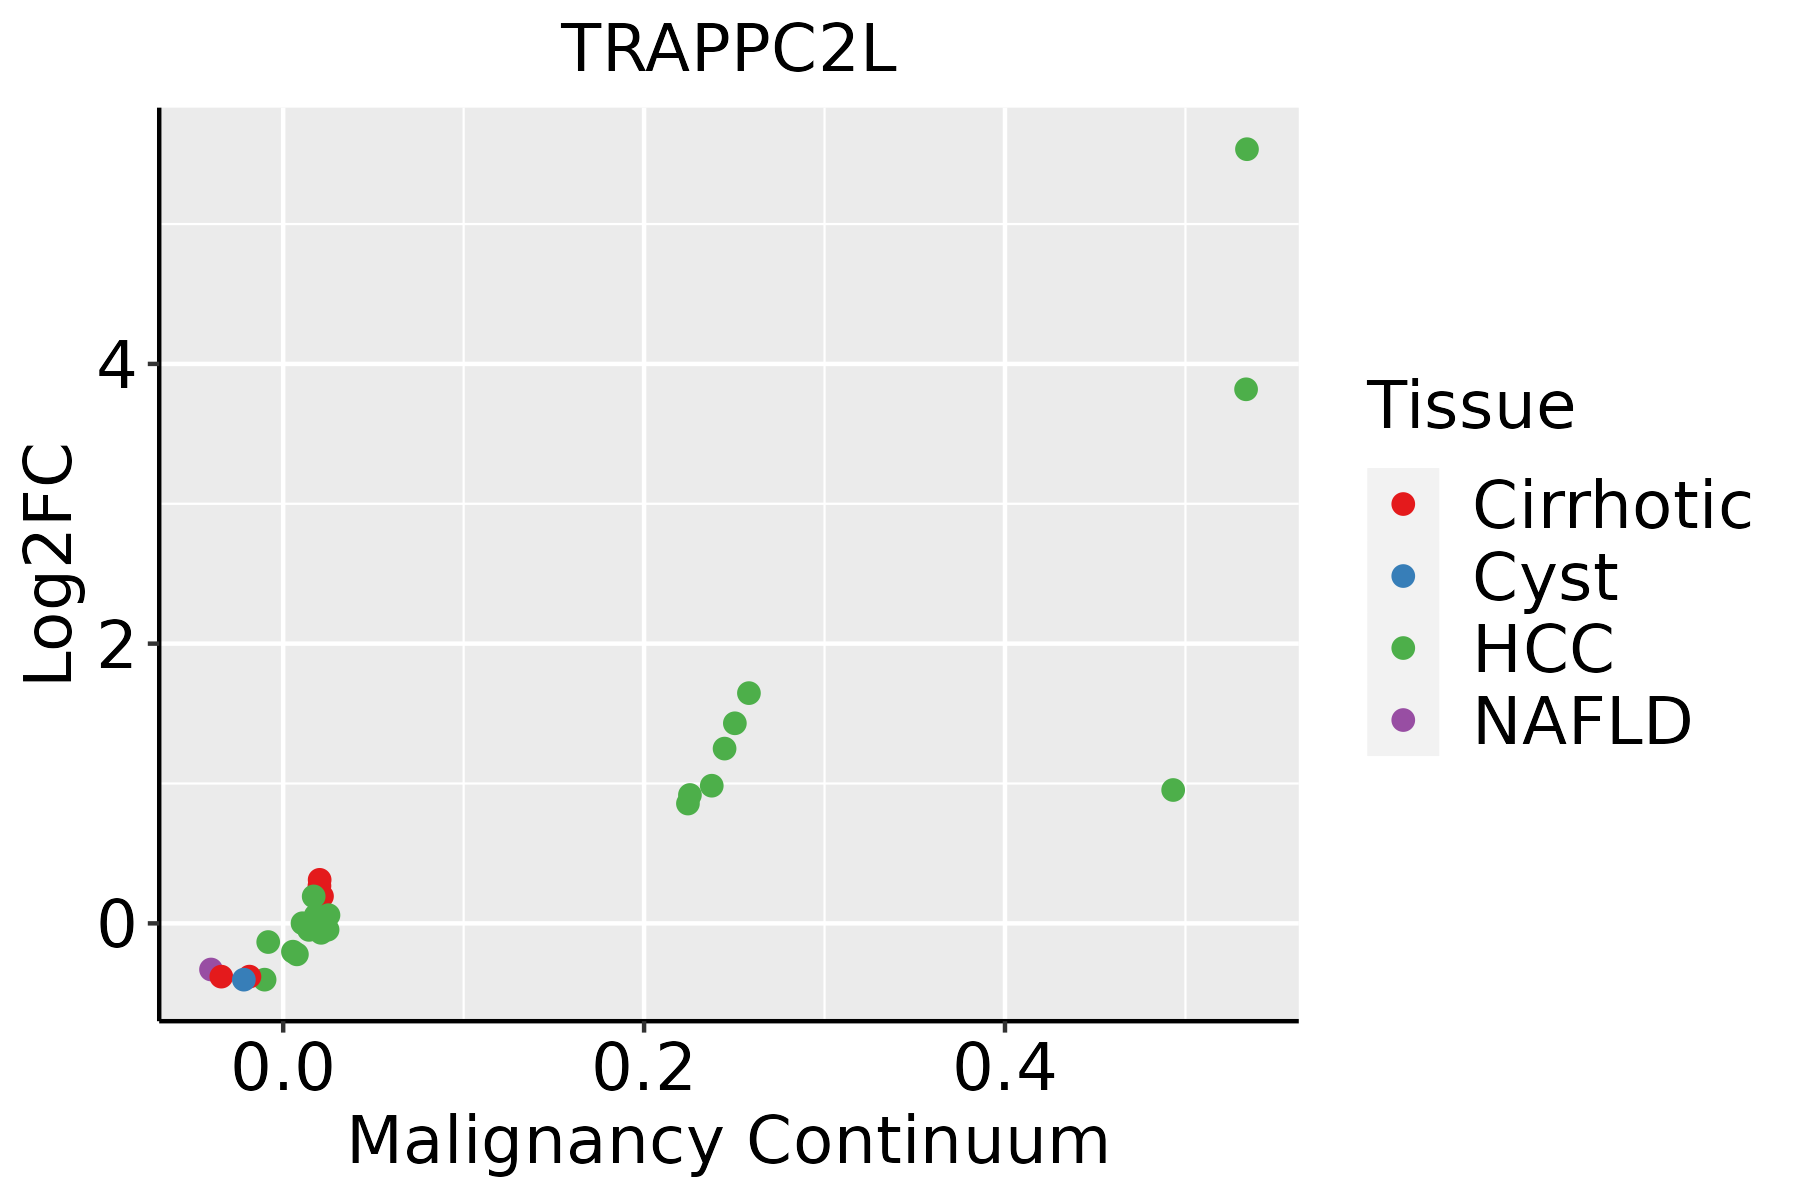 | HCC: Hepatocellular carcinoma |
| NAFLD: Non-alcoholic fatty liver disease | ||
| Oral Cavity |  | EOLP: Erosive Oral lichen planus |
| LP: leukoplakia | ||
| NEOLP: Non-erosive oral lichen planus | ||
| OSCC: Oral squamous cell carcinoma | ||
| Prostate | 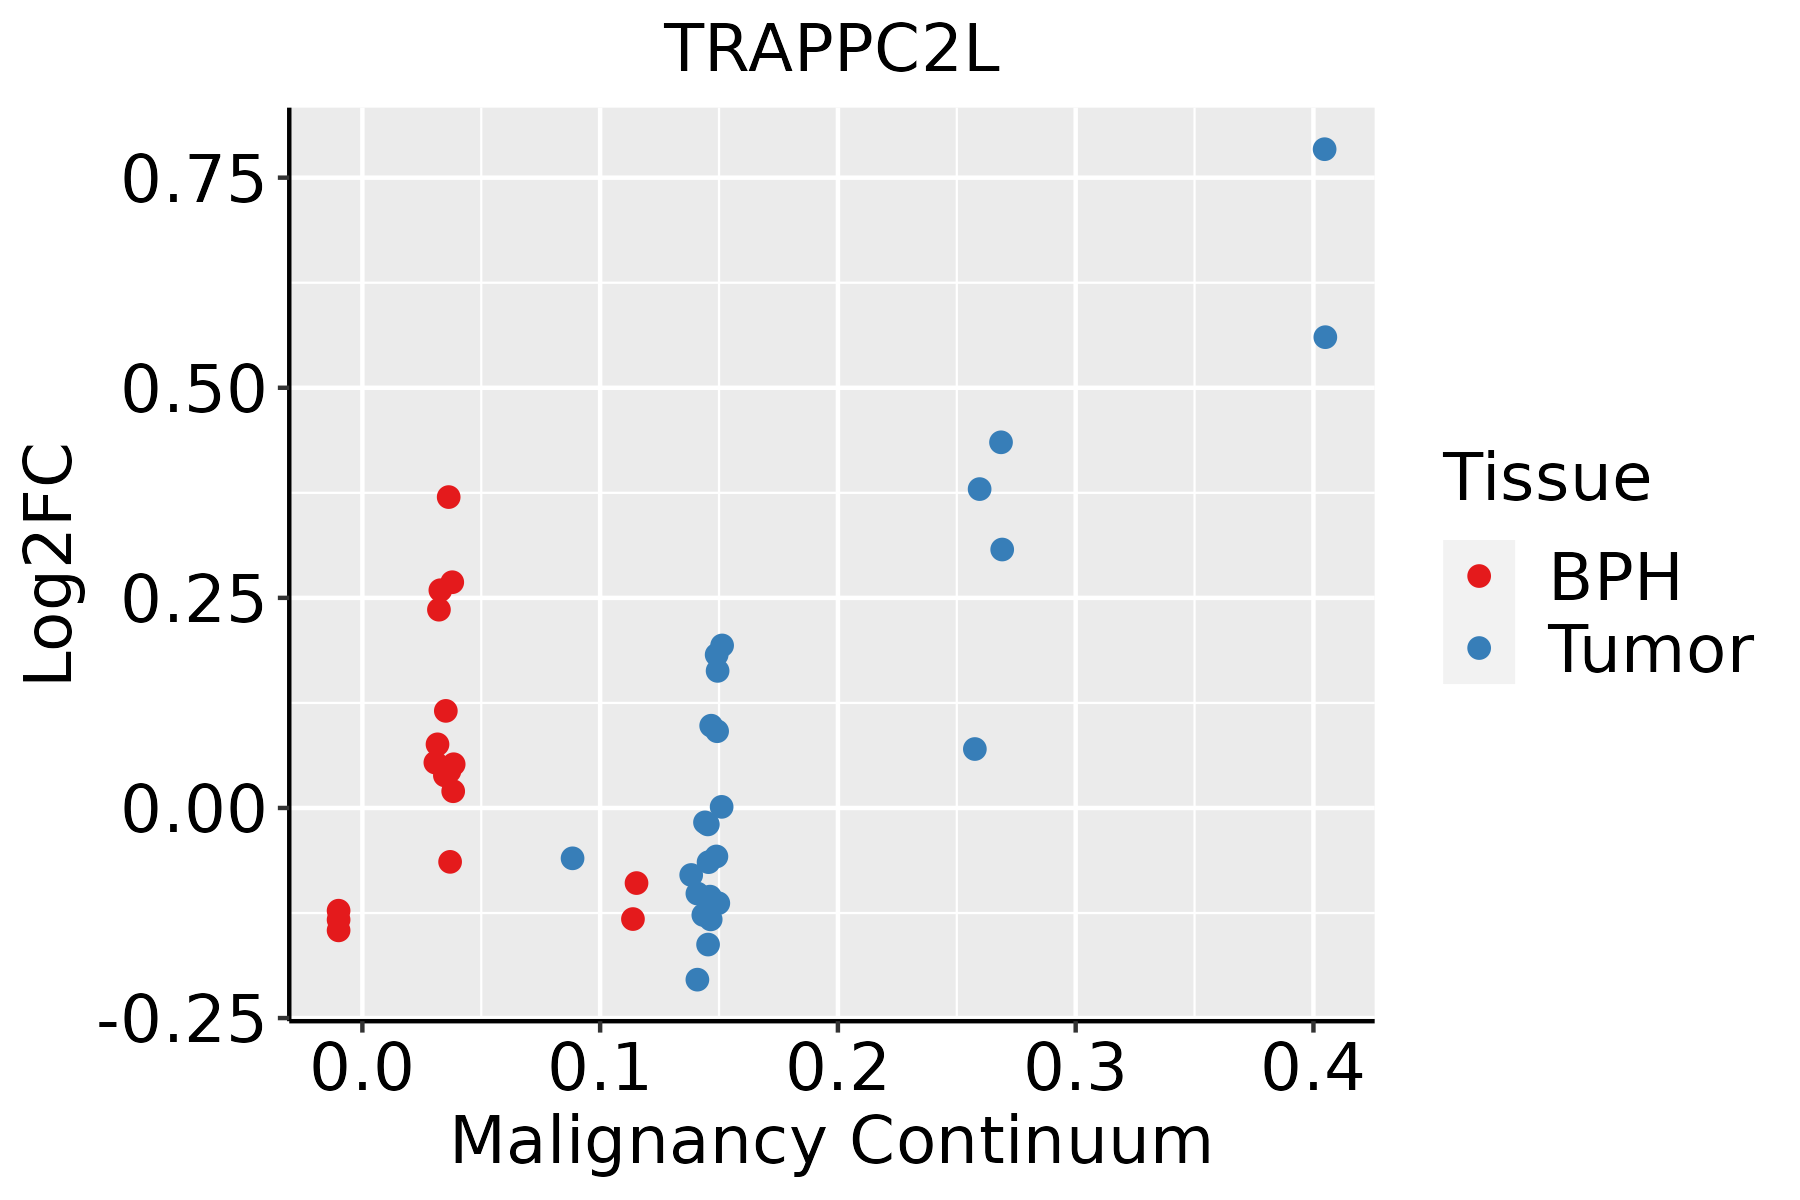 | BPH: Benign Prostatic Hyperplasia |
| Skin |  | AK: Actinic keratosis |
| cSCC: Cutaneous squamous cell carcinoma | ||
| SCCIS:squamous cell carcinoma in situ | ||
| Thyroid | 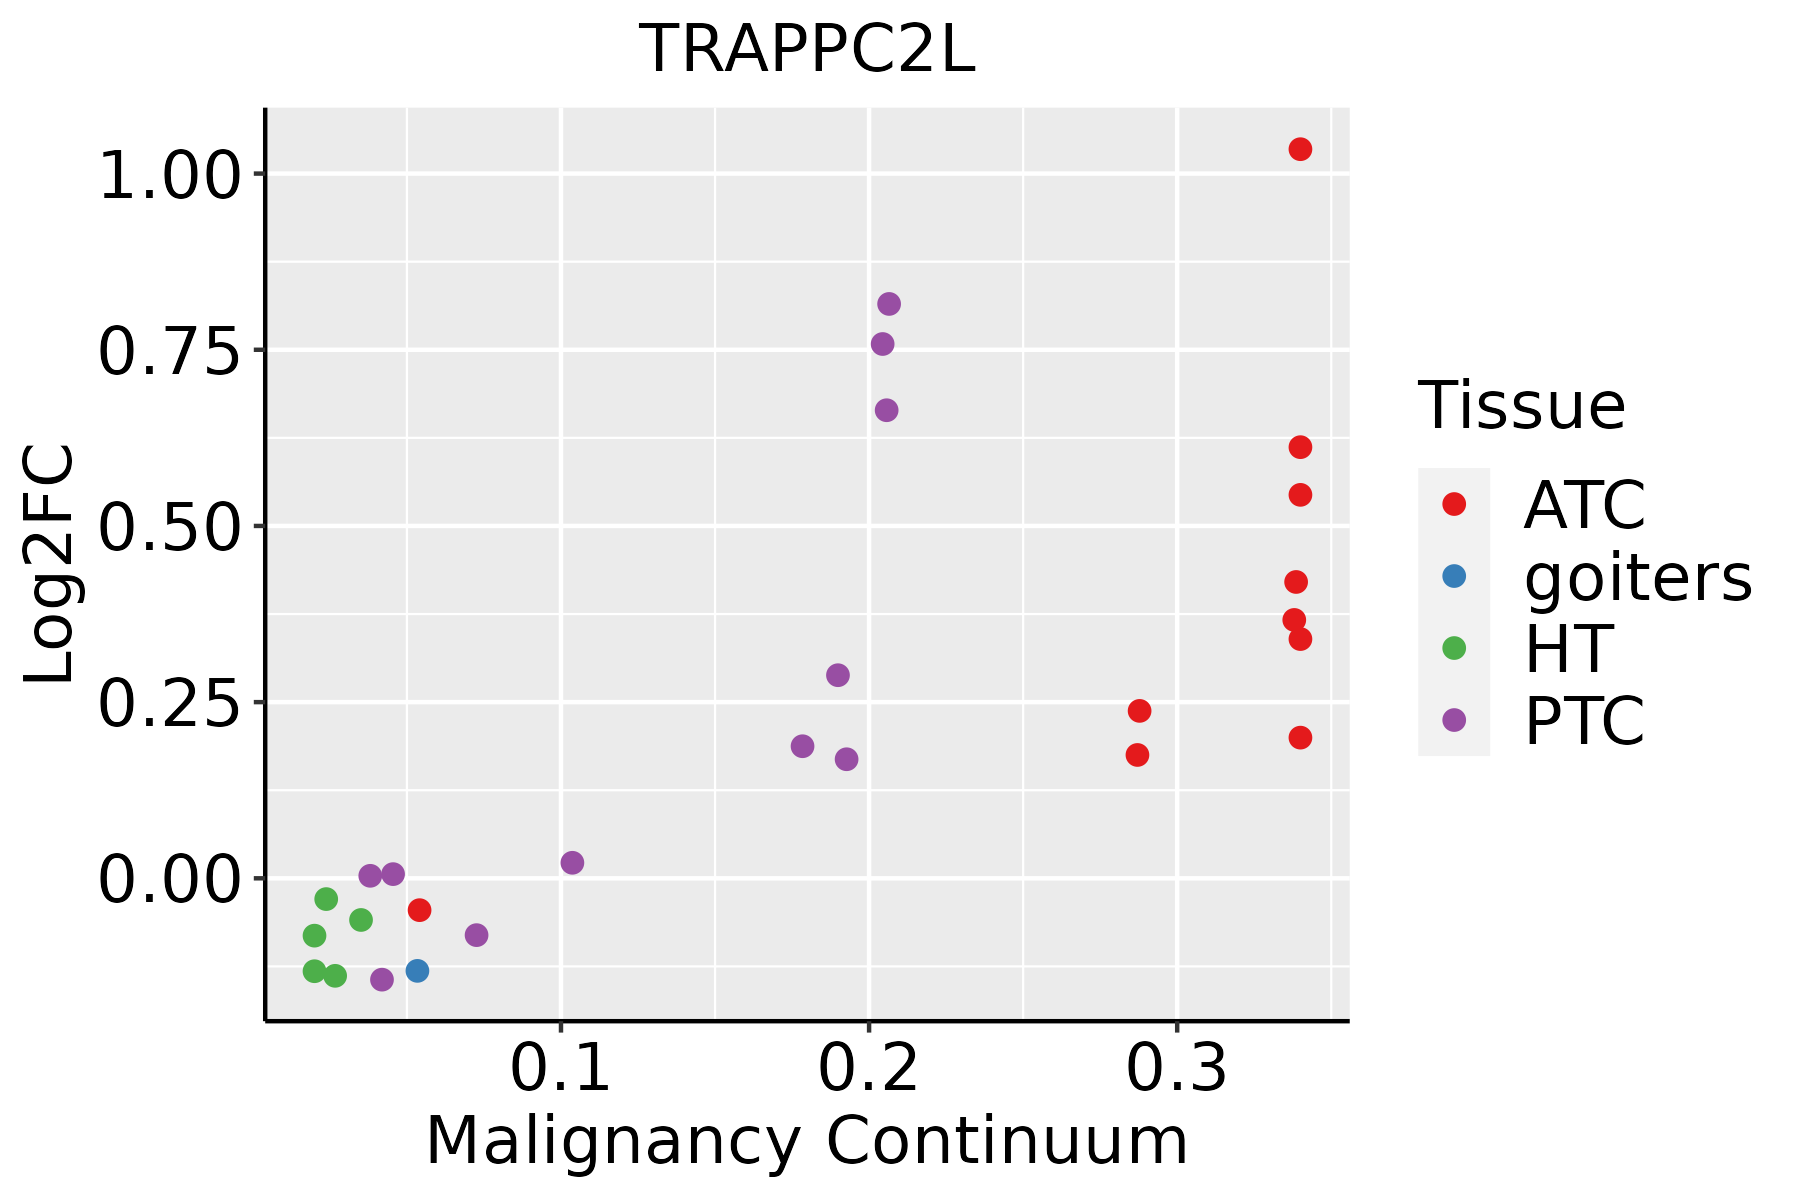 | ATC: Anaplastic thyroid cancer |
| HT: Hashimoto's thyroiditis | ||
| PTC: Papillary thyroid cancer |
| ∗log2FC in expression of this searched gene in stem-like cells from each diseased tissue sample relative to stem-like cells in normal samples in each tissue plotted against the malignancy continuum. Samples are colored based on if they are from different disease stage. |
Top |
Malignant transformation related pathway analysis |
| Find out the enriched GO biological processes and KEGG pathways involved in transition from healthy to precancer to cancer |
| Tissue | Disease Stage | Enriched GO biological Processes |
| Colorectum | AD |  |
| Colorectum | SER |  |
| Colorectum | MSS |  |
| Colorectum | MSI-H |  |
| Colorectum | FAP |  |
| ∗Top 15 enriched GO BP terms are showed in the bar plot of each disease state in each tissue. Each row represents a significant GO biological process which is colored according to the -log10(p.adjust). |
| Page: 1 2 3 4 5 6 7 8 9 |
| GO ID | Tissue | Disease Stage | Description | Gene Ratio | Bg Ratio | pvalue | p.adjust | Count |
| GO:004819317 | Esophagus | HGIN | Golgi vesicle transport | 83/2587 | 296/18723 | 8.59e-11 | 8.89e-09 | 83 |
| GO:00068889 | Esophagus | HGIN | endoplasmic reticulum to Golgi vesicle-mediated transport | 40/2587 | 130/18723 | 4.67e-07 | 2.07e-05 | 40 |
| GO:004819318 | Esophagus | ESCC | Golgi vesicle transport | 231/8552 | 296/18723 | 1.82e-30 | 9.63e-28 | 231 |
| GO:000688815 | Esophagus | ESCC | endoplasmic reticulum to Golgi vesicle-mediated transport | 102/8552 | 130/18723 | 1.73e-14 | 9.22e-13 | 102 |
| GO:004819311 | Liver | Cirrhotic | Golgi vesicle transport | 153/4634 | 296/18723 | 1.02e-23 | 6.43e-21 | 153 |
| GO:000688811 | Liver | Cirrhotic | endoplasmic reticulum to Golgi vesicle-mediated transport | 77/4634 | 130/18723 | 5.78e-17 | 7.56e-15 | 77 |
| GO:004819321 | Liver | HCC | Golgi vesicle transport | 217/7958 | 296/18723 | 2.58e-27 | 1.02e-24 | 217 |
| GO:000688821 | Liver | HCC | endoplasmic reticulum to Golgi vesicle-mediated transport | 100/7958 | 130/18723 | 1.15e-15 | 8.67e-14 | 100 |
| GO:004819315 | Oral cavity | OSCC | Golgi vesicle transport | 209/7305 | 296/18723 | 1.39e-28 | 6.30e-26 | 209 |
| GO:00068888 | Oral cavity | OSCC | endoplasmic reticulum to Golgi vesicle-mediated transport | 97/7305 | 130/18723 | 1.42e-16 | 1.15e-14 | 97 |
| GO:004819316 | Oral cavity | LP | Golgi vesicle transport | 141/4623 | 296/18723 | 6.11e-18 | 1.06e-15 | 141 |
| GO:000688814 | Oral cavity | LP | endoplasmic reticulum to Golgi vesicle-mediated transport | 67/4623 | 130/18723 | 3.74e-11 | 2.39e-09 | 67 |
| GO:004819310 | Prostate | BPH | Golgi vesicle transport | 102/3107 | 296/18723 | 3.90e-14 | 4.56e-12 | 102 |
| GO:00068887 | Prostate | BPH | endoplasmic reticulum to Golgi vesicle-mediated transport | 46/3107 | 130/18723 | 1.53e-07 | 3.53e-06 | 46 |
| GO:004819314 | Prostate | Tumor | Golgi vesicle transport | 105/3246 | 296/18723 | 3.55e-14 | 4.33e-12 | 105 |
| GO:000688813 | Prostate | Tumor | endoplasmic reticulum to Golgi vesicle-mediated transport | 49/3246 | 130/18723 | 2.49e-08 | 8.33e-07 | 49 |
| GO:0048193110 | Skin | cSCC | Golgi vesicle transport | 153/4864 | 296/18723 | 1.85e-21 | 3.41e-19 | 153 |
| GO:000688810 | Skin | cSCC | endoplasmic reticulum to Golgi vesicle-mediated transport | 73/4864 | 130/18723 | 2.60e-13 | 1.57e-11 | 73 |
| GO:004819320 | Thyroid | PTC | Golgi vesicle transport | 186/5968 | 296/18723 | 3.09e-28 | 1.22e-25 | 186 |
| GO:000688817 | Thyroid | PTC | endoplasmic reticulum to Golgi vesicle-mediated transport | 83/5968 | 130/18723 | 6.19e-14 | 3.52e-12 | 83 |
| Page: 1 2 |
| Pathway ID | Tissue | Disease Stage | Description | Gene Ratio | Bg Ratio | pvalue | p.adjust | qvalue | Count |
| Page: 1 |
Top |
Cell-cell communication analysis |
| Identification of potential cell-cell interactions between two cell types and their ligand-receptor pairs for different disease states |
| Ligand | Receptor | LRpair | Pathway | Tissue | Disease Stage |
| Page: 1 |
Top |
Single-cell gene regulatory network inference analysis |
| Find out the significant the regulons (TFs) and the target genes of each regulon across cell types for different disease states |
| TF | Cell Type | Tissue | Disease Stage | Target Gene | RSS | Regulon Activity |
| ∗The dot plots of a searched regulon are shown for all cell subpopulations in each disease state of each tissue based on the regulon specific score inferred using pySCENIC and by calculating the average expression. |
| Page: 1 |
Top |
Somatic mutation of malignant transformation related genes |
| Annotation of somatic variants for genes involved in malignant transformation |
| Hugo Symbol | Variant Class | Variant Classification | dbSNP RS | HGVSc | HGVSp | HGVSp Short | SWISSPROT | BIOTYPE | SIFT | PolyPhen | Tumor Sample Barcode | Tissue | Histology | Sex | Age | Stage | Therapy Types | Drugs | Outcome |
| TRAPPC2L | SNV | Missense_Mutation | c.205N>C | p.Val69Leu | p.V69L | protein_coding | tolerated(0.1) | benign(0.041) | TCGA-PL-A8LX-01 | Breast | breast invasive carcinoma | Female | <65 | III/IV | Unknown | Unknown | SD | ||
| TRAPPC2L | SNV | Missense_Mutation | rs748351026 | c.15N>G | p.Ile5Met | p.I5M | protein_coding | deleterious(0) | benign(0.095) | TCGA-JW-A852-01 | Cervix | cervical & endocervical cancer | Female | <65 | I/II | Unknown | Unknown | PD | |
| TRAPPC2L | SNV | Missense_Mutation | c.133G>A | p.Ala45Thr | p.A45T | protein_coding | tolerated(0.54) | benign(0.007) | TCGA-CA-5254-01 | Colorectum | colon adenocarcinoma | Female | <65 | I/II | Chemotherapy | oxaliplatin | CR | ||
| TRAPPC2L | SNV | Missense_Mutation | rs745360396 | c.377G>T | p.Gly126Val | p.G126V | protein_coding | tolerated_low_confidence(0.16) | unknown(0) | TCGA-D5-6930-01 | Colorectum | colon adenocarcinoma | Male | >=65 | I/II | Unknown | Unknown | SD | |
| TRAPPC2L | SNV | Missense_Mutation | c.133G>A | p.Ala45Thr | p.A45T | protein_coding | tolerated(0.54) | benign(0.007) | TCGA-AG-A016-01 | Colorectum | rectum adenocarcinoma | Male | <65 | III/IV | Chemotherapy | 5-fluorouracil | SD | ||
| TRAPPC2L | SNV | Missense_Mutation | c.133N>A | p.Ala45Thr | p.A45T | protein_coding | tolerated(0.54) | benign(0.007) | TCGA-F5-6814-01 | Colorectum | rectum adenocarcinoma | Male | <65 | I/II | Unknown | Unknown | SD | ||
| TRAPPC2L | SNV | Missense_Mutation | rs774450235 | c.211N>A | p.Gly71Ser | p.G71S | protein_coding | deleterious(0) | probably_damaging(0.971) | TCGA-A5-A1OF-01 | Endometrium | uterine corpus endometrioid carcinoma | Female | <65 | I/II | Unknown | Unknown | SD | |
| TRAPPC2L | SNV | Missense_Mutation | rs755976894 | c.362N>A | p.Arg121His | p.R121H | protein_coding | tolerated(0.15) | benign(0.005) | TCGA-AP-A0LM-01 | Endometrium | uterine corpus endometrioid carcinoma | Female | <65 | III/IV | Chemotherapy | cisplatin | SD | |
| TRAPPC2L | SNV | Missense_Mutation | rs755976894 | c.362N>A | p.Arg121His | p.R121H | protein_coding | tolerated(0.15) | benign(0.005) | TCGA-AX-A0J1-01 | Endometrium | uterine corpus endometrioid carcinoma | Female | >=65 | I/II | Unknown | Unknown | SD | |
| TRAPPC2L | SNV | Missense_Mutation | rs747075962 | c.298N>C | p.Phe100Leu | p.F100L | protein_coding | deleterious(0.03) | possibly_damaging(0.775) | TCGA-B5-A1MX-01 | Endometrium | uterine corpus endometrioid carcinoma | Female | <65 | I/II | Hormone Therapy | megace | SD |
| Page: 1 2 |
Top |
Related drugs of malignant transformation related genes |
| Identification of chemicals and drugs interact with genes involved in malignant transfromation |
| (DGIdb 4.0) |
| Entrez ID | Symbol | Category | Interaction Types | Drug Claim Name | Drug Name | PMIDs |
| Page: 1 |

Copyright 2023-Present -The University of Texas Health Science Center at Houston |