Schematic overview of the cellular and molecular mechanisms involved in the cancer progression, including the proposed cellular and molecular mechanisms in cancer cells trajectory. AT1: alveolar type 1 cells; AT2: alveolar type 2 cells; AAH: atypical adenomatous hyperplasia; AIS: adenocarcinoma in situ; MIA: minimally invasive adenocarcinoma; IA: invasive adenocarcinoma; EMT: epithelial-mesenchymal transition

Home

Download

Statistics

Help

Contact

Center for Computational Systems Medicine
leaf

Gene summary

leaf

Malignant transformation analysis

leaf

Malignant transformation related pathway analysis

leaf

Cell-cell communication analysis

leaf

Single-cell gene regulatory network inference analysis

leaf

Somatic mutation of malignant transformation related genes

leaf

Related drugs of malignant transformation related genes

Gene: TRAPPC12

Gene summary for TRAPPC12

check button Gene summary.

Gene informationSpeciesHuman
Gene symbol

TRAPPC12

Gene ID

51112

Gene nametrafficking protein particle complex subunit 12
Gene AliasCGI-87
Cytomap2p25.3
Gene Typeprotein-coding
GO ID

GO:0006810

UniProtAcc

Q8WVT3


Top

Malignant transformation analysis

check button Identification of the aberrant gene expression in precancerous and cancerous lesions by comparing the gene expression of stem-like cells in diseased tissues with normal stem cells
check button Malignant transformation involving gene list.
Entrez IDSymbolReplicatesSpeciesOrganTissueAdj P-valueLog2FCMalignancy
51112TRAPPC12CCI_1HumanCervixCC4.17e-086.42e-010.528
51112TRAPPC12CCI_3HumanCervixCC9.28e-065.44e-010.516
51112TRAPPC12LZE7THumanEsophagusESCC6.16e-041.38e-010.0667
51112TRAPPC12LZE8THumanEsophagusESCC4.87e-031.06e-010.067
51112TRAPPC12LZE24THumanEsophagusESCC8.36e-142.78e-010.0596
51112TRAPPC12LZE21THumanEsophagusESCC1.48e-053.27e-010.0655
51112TRAPPC12P1T-EHumanEsophagusESCC1.19e-104.71e-010.0875
51112TRAPPC12P2T-EHumanEsophagusESCC7.12e-436.72e-010.1177
51112TRAPPC12P4T-EHumanEsophagusESCC1.98e-153.71e-010.1323
51112TRAPPC12P5T-EHumanEsophagusESCC5.83e-121.89e-010.1327
51112TRAPPC12P8T-EHumanEsophagusESCC8.98e-112.10e-010.0889
51112TRAPPC12P9T-EHumanEsophagusESCC5.44e-122.02e-010.1131
51112TRAPPC12P10T-EHumanEsophagusESCC2.86e-233.93e-010.116
51112TRAPPC12P11T-EHumanEsophagusESCC2.77e-155.91e-010.1426
51112TRAPPC12P12T-EHumanEsophagusESCC4.08e-142.85e-010.1122
51112TRAPPC12P15T-EHumanEsophagusESCC2.66e-112.66e-010.1149
51112TRAPPC12P16T-EHumanEsophagusESCC1.69e-121.22e-010.1153
51112TRAPPC12P17T-EHumanEsophagusESCC1.92e-092.76e-010.1278
51112TRAPPC12P20T-EHumanEsophagusESCC2.08e-122.35e-010.1124
51112TRAPPC12P21T-EHumanEsophagusESCC1.21e-101.66e-010.1617
Page: 1 2 3 4 5 6 

check button Transcriptomic changes along malignancy continuum.
TissueExpression DynamicsAbbreviation
CervixThe image shows the transcriptomic changes along malignancy continuum.log2FC in expression of this searched gene in stem-like cells from each diseased tissue sample relative to stem-like cells in normal samples in each tissue plotted against the malignancy continuum. Samples are colored based on if they are from different disease stage.CC: Cervix cancer
HSIL_HPV: HPV-infected high-grade squamous intraepithelial lesions
N_HPV: HPV-infected normal cervix
EsophagusThe image shows the transcriptomic changes along malignancy continuum.log2FC in expression of this searched gene in stem-like cells from each diseased tissue sample relative to stem-like cells in normal samples in each tissue plotted against the malignancy continuum. Samples are colored based on if they are from different disease stage.
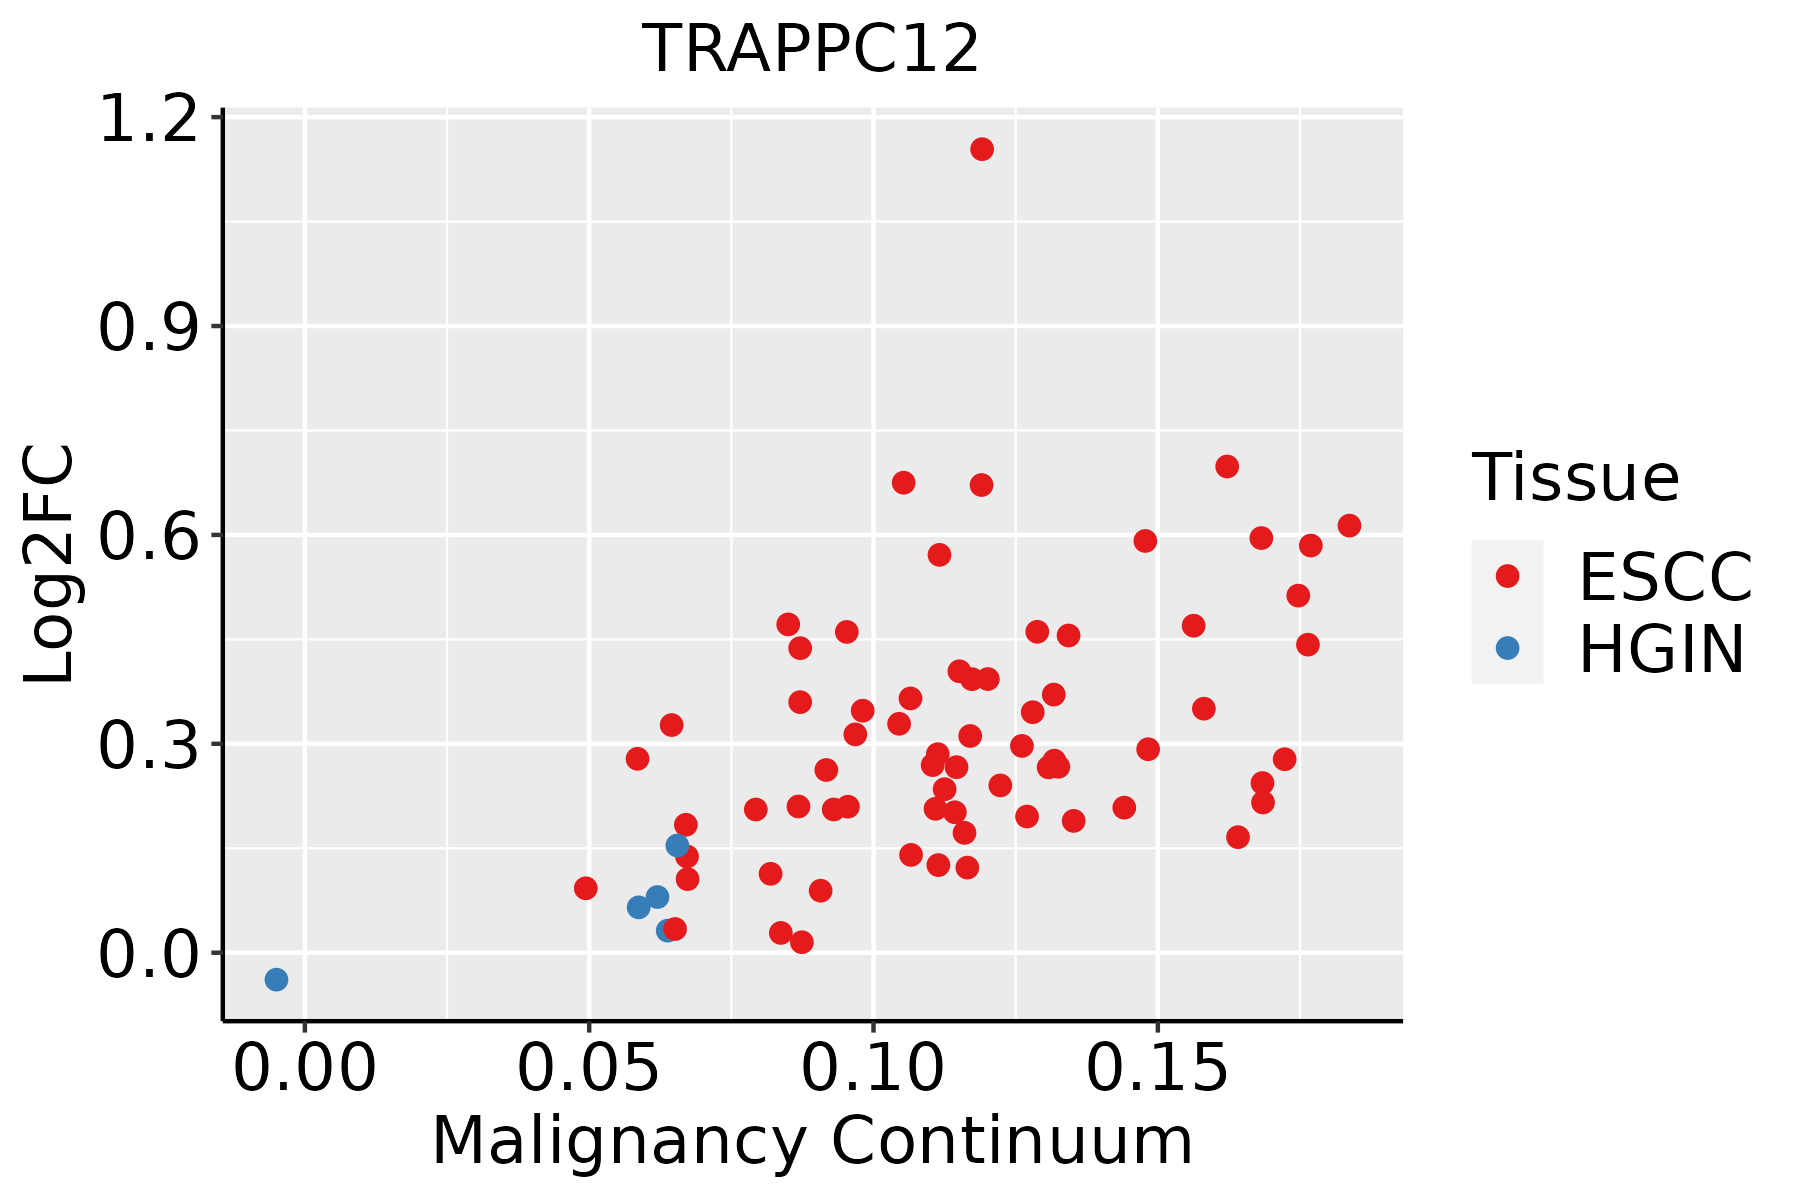
ESCC: Esophageal squamous cell carcinoma
HGIN: High-grade intraepithelial neoplasias
LGIN: Low-grade intraepithelial neoplasias
LiverThe image shows the transcriptomic changes along malignancy continuum.log2FC in expression of this searched gene in stem-like cells from each diseased tissue sample relative to stem-like cells in normal samples in each tissue plotted against the malignancy continuum. Samples are colored based on if they are from different disease stage.HCC: Hepatocellular carcinoma
NAFLD: Non-alcoholic fatty liver disease
Oral CavityThe image shows the transcriptomic changes along malignancy continuum.log2FC in expression of this searched gene in stem-like cells from each diseased tissue sample relative to stem-like cells in normal samples in each tissue plotted against the malignancy continuum. Samples are colored based on if they are from different disease stage.
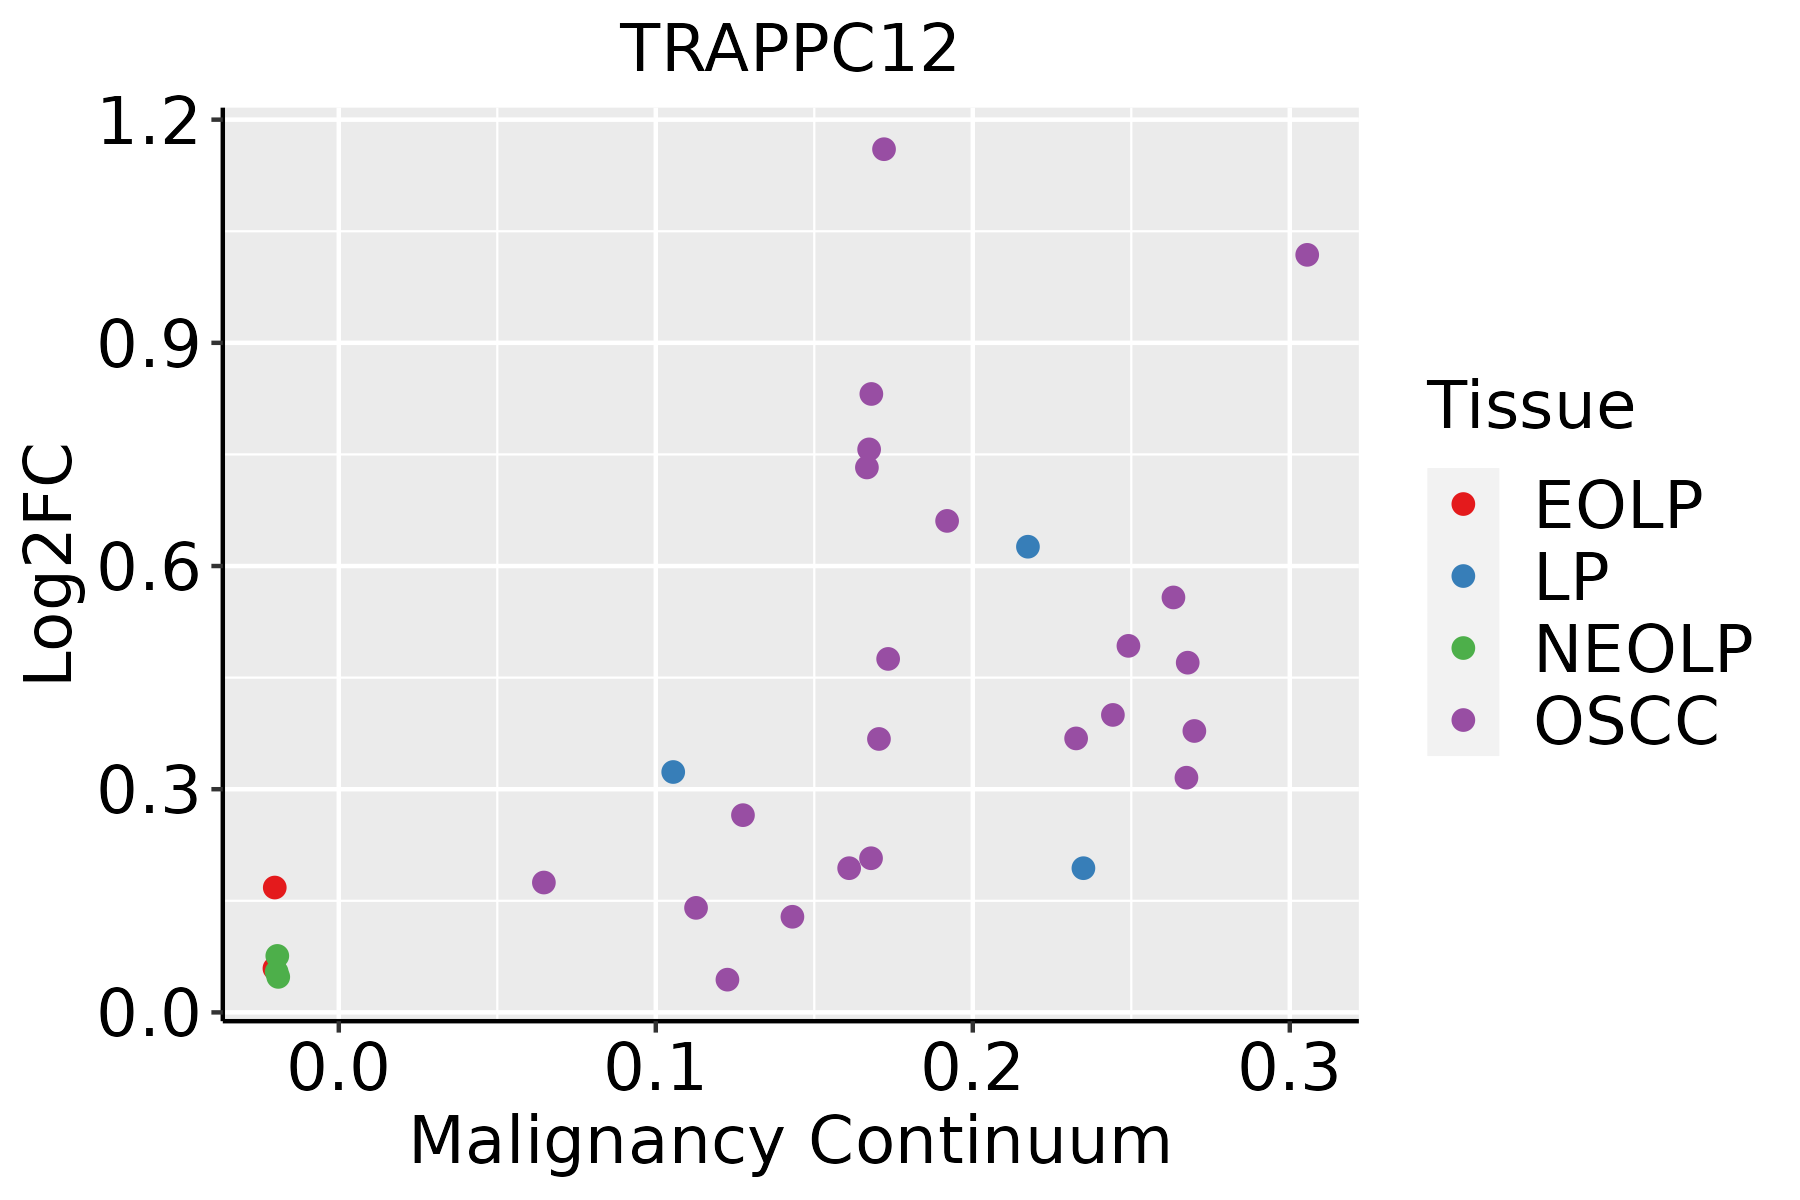
EOLP: Erosive Oral lichen planus
LP: leukoplakia
NEOLP: Non-erosive oral lichen planus
OSCC: Oral squamous cell carcinoma
SkinThe image shows the transcriptomic changes along malignancy continuum.log2FC in expression of this searched gene in stem-like cells from each diseased tissue sample relative to stem-like cells in normal samples in each tissue plotted against the malignancy continuum. Samples are colored based on if they are from different disease stage.
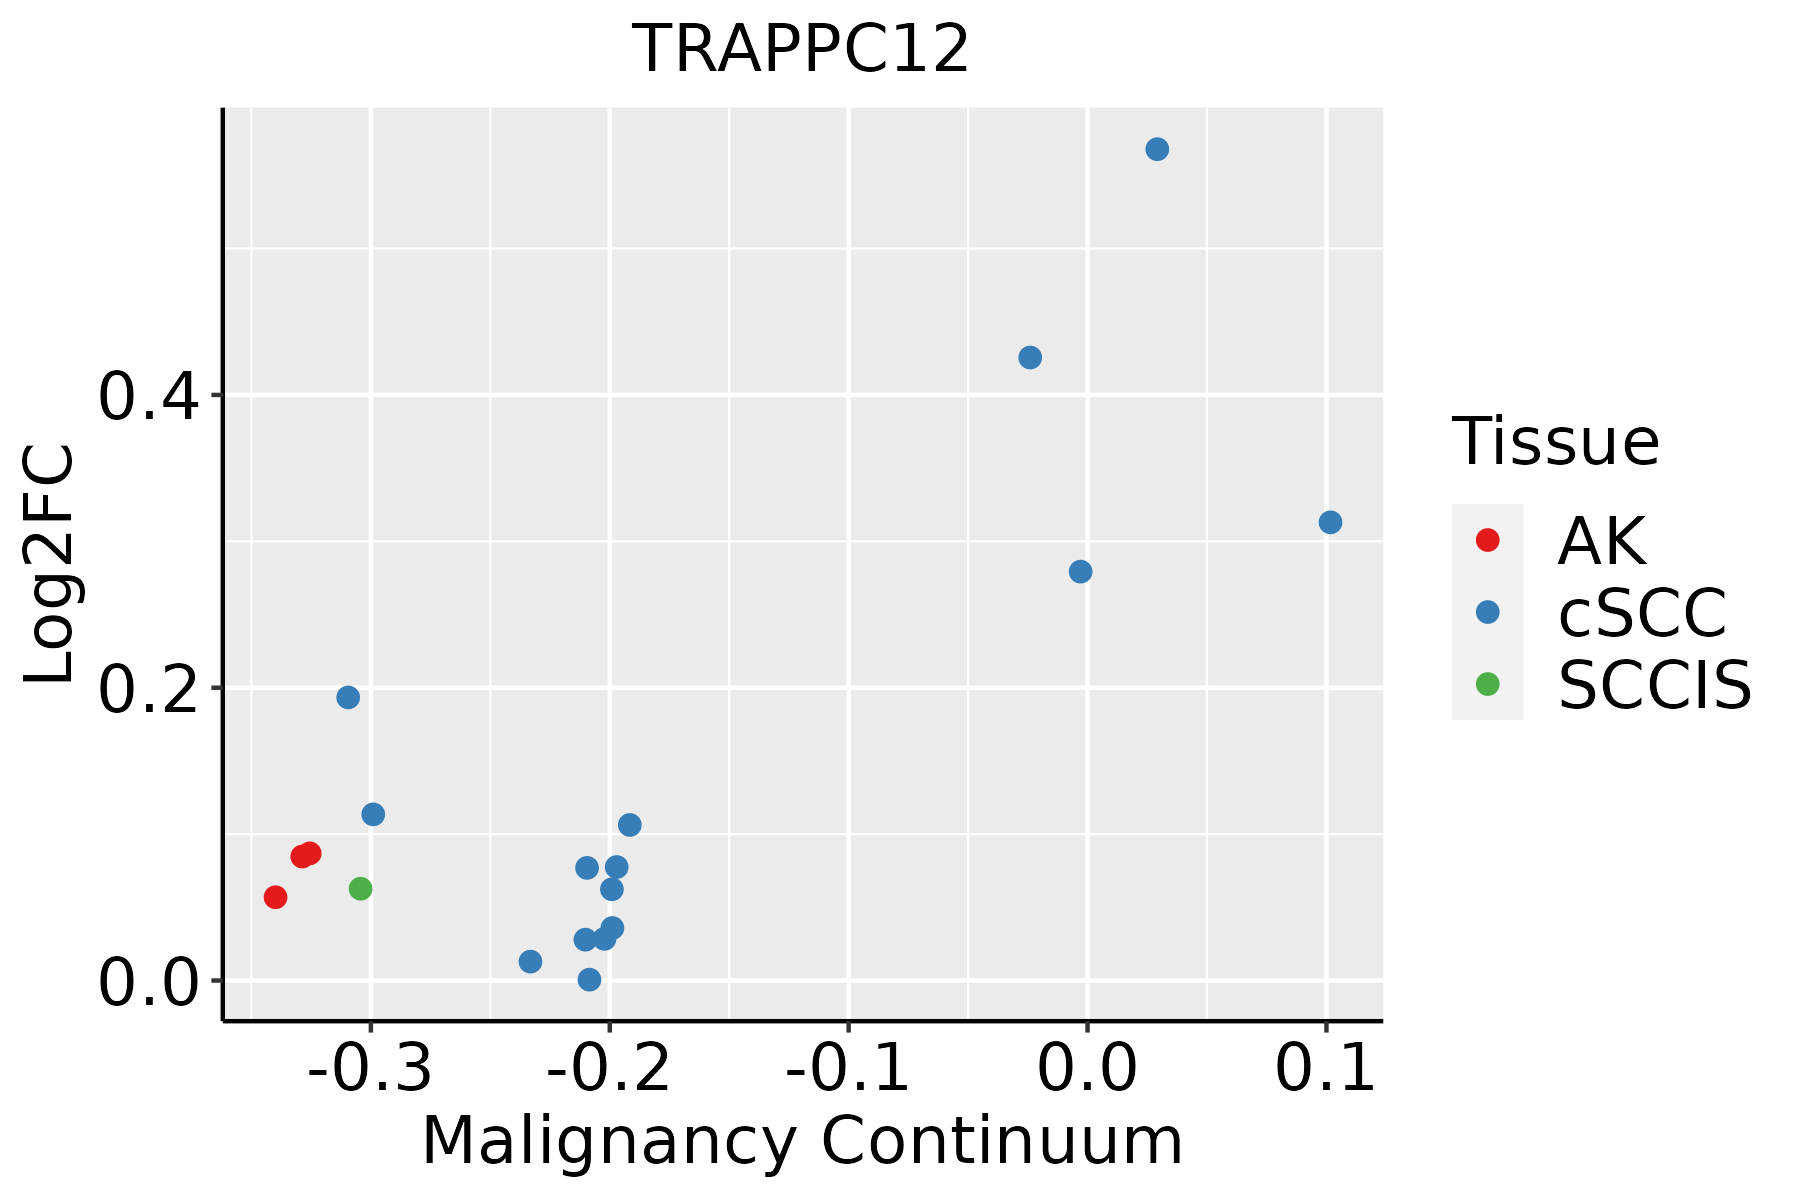
AK: Actinic keratosis
cSCC: Cutaneous squamous cell carcinoma
SCCIS:squamous cell carcinoma in situ
ThyroidThe image shows the transcriptomic changes along malignancy continuum.log2FC in expression of this searched gene in stem-like cells from each diseased tissue sample relative to stem-like cells in normal samples in each tissue plotted against the malignancy continuum. Samples are colored based on if they are from different disease stage.ATC: Anaplastic thyroid cancer
HT: Hashimoto's thyroiditis
PTC: Papillary thyroid cancer
∗log2FC in expression of this searched gene in stem-like cells from each diseased tissue sample relative to stem-like cells in normal samples in each tissue plotted against the malignancy continuum. Samples are colored based on if they are from different disease stage.

Top

Malignant transformation related pathway analysis

check buttonFind out the enriched GO biological processes and KEGG pathways involved in transition from healthy to precancer to cancer
check button Figure of enriched GO biological processes.
TissueDisease StageEnriched GO biological Processes
ColorectumADGO analysis - Figure of enriched GO biological processes: Top 15 enriched GO BP terms are showed in the bar plot of each disease state in each tissue. Each row represents a significant GO biological process which is colored according to the -log10(p.adjust).
ColorectumSERGO analysis - Figure of enriched GO biological processes: Top 15 enriched GO BP terms are showed in the bar plot of each disease state in each tissue. Each row represents a significant GO biological process which is colored according to the -log10(p.adjust).
ColorectumMSSGO analysis - Figure of enriched GO biological processes: Top 15 enriched GO BP terms are showed in the bar plot of each disease state in each tissue. Each row represents a significant GO biological process which is colored according to the -log10(p.adjust).
ColorectumMSI-HGO analysis - Figure of enriched GO biological processes: Top 15 enriched GO BP terms are showed in the bar plot of each disease state in each tissue. Each row represents a significant GO biological process which is colored according to the -log10(p.adjust).
ColorectumFAPGO analysis - Figure of enriched GO biological processes: Top 15 enriched GO BP terms are showed in the bar plot of each disease state in each tissue. Each row represents a significant GO biological process which is colored according to the -log10(p.adjust).
∗Top 15 enriched GO BP terms are showed in the bar plot of each disease state in each tissue. Each row represents a significant GO biological process which is colored according to the -log10(p.adjust).
Page: 1 2 3 4 5 6 7 8 9 

check button Enriched GO biological processes.
GO IDTissueDisease StageDescriptionGene RatioBg Ratiopvaluep.adjustCount
GO:190382910CervixCCpositive regulation of cellular protein localization72/2311276/187233.20e-104.46e-0872
GO:004325410CervixCCregulation of protein-containing complex assembly96/2311428/187232.91e-093.05e-0796
GO:00516567CervixCCestablishment of organelle localization76/2311390/187233.17e-055.21e-0476
GO:00481938CervixCCGolgi vesicle transport58/2311296/187232.24e-042.54e-0358
GO:19021153CervixCCregulation of organelle assembly40/2311186/187232.92e-043.15e-0340
GO:00070304CervixCCGolgi organization32/2311157/187232.78e-031.87e-0232
GO:004819318EsophagusESCCGolgi vesicle transport231/8552296/187231.82e-309.63e-28231
GO:005165617EsophagusESCCestablishment of organelle localization273/8552390/187239.13e-231.81e-20273
GO:1903829111EsophagusESCCpositive regulation of cellular protein localization199/8552276/187232.99e-193.45e-17199
GO:003304416EsophagusESCCregulation of chromosome organization145/8552187/187233.80e-194.31e-17145
GO:000705911EsophagusESCCchromosome segregation238/8552346/187231.72e-181.82e-16238
GO:0043254111EsophagusESCCregulation of protein-containing complex assembly278/8552428/187233.81e-162.77e-14278
GO:000688815EsophagusESCCendoplasmic reticulum to Golgi vesicle-mediated transport102/8552130/187231.73e-149.22e-13102
GO:005131011EsophagusESCCmetaphase plate congression58/855265/187231.81e-138.63e-1258
GO:00988133EsophagusESCCnuclear chromosome segregation187/8552281/187231.00e-124.36e-11187
GO:005130311EsophagusESCCestablishment of chromosome localization67/855280/187231.92e-128.09e-1167
GO:005000011EsophagusESCCchromosome localization68/855282/187233.37e-121.32e-1068
GO:003450211EsophagusESCCprotein localization to chromosome70/855292/187232.54e-095.64e-0870
GO:00070308EsophagusESCCGolgi organization101/8552157/187231.78e-062.10e-05101
GO:190211514EsophagusESCCregulation of organelle assembly116/8552186/187233.15e-063.53e-05116
Page: 1 2 3 4 5 6 7 

check button Enriched KEGG pathways.
Pathway IDTissueDisease StageDescriptionGene RatioBg Ratiopvaluep.adjustqvalueCount
Page: 1 

Top

Cell-cell communication analysis

check buttonIdentification of potential cell-cell interactions between two cell types and their ligand-receptor pairs for different disease states
LigandReceptorLRpairPathwayTissueDisease Stage
Page: 1 

Top

Single-cell gene regulatory network inference analysis

check buttonFind out the significant the regulons (TFs) and the target genes of each regulon across cell types for different disease states
TFCell TypeTissueDisease StageTarget GeneRSSRegulon Activity
∗The dot plots of a searched regulon are shown for all cell subpopulations in each disease state of each tissue based on the regulon specific score inferred using pySCENIC and by calculating the average expression.
Page: 1 

Top

Somatic mutation of malignant transformation related genes

check buttonAnnotation of somatic variants for genes involved in malignant transformation
Hugo SymbolVariant ClassVariant ClassificationdbSNP RSHGVScHGVSpHGVSp ShortSWISSPROTBIOTYPESIFTPolyPhenTumor Sample BarcodeTissueHistologySexAgeStageTherapy TypesDrugsOutcome
TRAPPC12SNVMissense_Mutationnovelc.997G>Ap.Val333Metp.V333MQ8WVT3protein_codingtolerated(0.06)possibly_damaging(0.584)TCGA-5L-AAT1-01Breastbreast invasive carcinomaFemale<65III/IVHormone TherapyletrozolSD
TRAPPC12SNVMissense_Mutationc.2104N>Ap.Glu702Lysp.E702KQ8WVT3protein_codingdeleterious(0)probably_damaging(0.996)TCGA-E2-A10C-01Breastbreast invasive carcinomaFemale<65I/IIChemotherapycytoxanSD
TRAPPC12insertionNonsense_Mutationnovelc.1936_1937insCTCCATCTAAAAAATAAAAATAAATAAAAACp.Ile646ThrfsTer6p.I646Tfs*6Q8WVT3protein_codingTCGA-A8-A0A1-01Breastbreast invasive carcinomaFemale>=65I/IIHormone TherapytamoxiphenSD
TRAPPC12deletionFrame_Shift_Delnovelc.1384_1387delNNNNp.Glu462ThrfsTer42p.E462Tfs*42Q8WVT3protein_codingTCGA-JL-A3YW-01Breastbreast invasive carcinomaFemale<65I/IIUnknownUnknownSD
TRAPPC12SNVMissense_Mutationnovelc.164C>Tp.Ser55Leup.S55LQ8WVT3protein_codingdeleterious_low_confidence(0)probably_damaging(0.994)TCGA-2W-A8YY-01Cervixcervical & endocervical cancerFemale<65I/IIChemotherapycisplatinCR
TRAPPC12SNVMissense_Mutationnovelc.628T>Cp.Phe210Leup.F210LQ8WVT3protein_codingdeleterious_low_confidence(0)probably_damaging(0.932)TCGA-DS-A1OA-01Cervixcervical & endocervical cancerFemale>=65I/IIChemotherapycarboplatinPD
TRAPPC12SNVMissense_Mutationc.1819G>Ap.Glu607Lysp.E607KQ8WVT3protein_codingdeleterious(0.04)possibly_damaging(0.882)TCGA-EK-A3GK-01Cervixcervical & endocervical cancerFemale<65I/IIUnknownUnknownSD
TRAPPC12SNVMissense_Mutationc.1331N>Tp.Ala444Valp.A444VQ8WVT3protein_codingtolerated(0.05)probably_damaging(0.917)TCGA-FU-A3HZ-01Cervixcervical & endocervical cancerFemale<65I/IIChemotherapycisplatinCR
TRAPPC12SNVMissense_Mutationnovelc.1872N>Ap.Met624Ilep.M624IQ8WVT3protein_codingtolerated(0.17)benign(0.376)TCGA-VS-A9UB-01Cervixcervical & endocervical cancerFemale<65I/IIChemotherapycisplatinCR
TRAPPC12SNVMissense_Mutationrs368315810c.1204N>Tp.Arg402Cysp.R402CQ8WVT3protein_codingdeleterious(0)probably_damaging(0.994)TCGA-A6-6781-01Colorectumcolon adenocarcinomaMale<65III/IVChemotherapyoxaliplatinSD
Page: 1 2 3 4 5 6 

Top

Related drugs of malignant transformation related genes

check buttonIdentification of chemicals and drugs interact with genes involved in malignant transfromation
(DGIdb 4.0)
Entrez IDSymbolCategoryInteraction TypesDrug Claim NameDrug NamePMIDs
Page: 1