
|
|||||
|
 | |
| |
| |
| |
| |
| |
|
Gene: TRAPPC11 |
Gene summary for TRAPPC11 |
| Gene information | Species | Human | Gene symbol | TRAPPC11 | Gene ID | 60684 |
| Gene name | trafficking protein particle complex subunit 11 | |
| Gene Alias | C4orf41 | |
| Cytomap | 4q35.1 | |
| Gene Type | protein-coding | GO ID | GO:0006810 | UniProtAcc | Q7Z392 |
Top |
Malignant transformation analysis |
| Identification of the aberrant gene expression in precancerous and cancerous lesions by comparing the gene expression of stem-like cells in diseased tissues with normal stem cells |
| Entrez ID | Symbol | Replicates | Species | Organ | Tissue | Adj P-value | Log2FC | Malignancy |
| 60684 | TRAPPC11 | LZE4T | Human | Esophagus | ESCC | 8.12e-07 | 1.52e-01 | 0.0811 |
| 60684 | TRAPPC11 | LZE7T | Human | Esophagus | ESCC | 9.50e-07 | 2.36e-01 | 0.0667 |
| 60684 | TRAPPC11 | LZE8T | Human | Esophagus | ESCC | 1.26e-03 | 7.91e-02 | 0.067 |
| 60684 | TRAPPC11 | LZE24T | Human | Esophagus | ESCC | 5.20e-07 | 1.40e-01 | 0.0596 |
| 60684 | TRAPPC11 | P2T-E | Human | Esophagus | ESCC | 7.65e-16 | 2.78e-01 | 0.1177 |
| 60684 | TRAPPC11 | P4T-E | Human | Esophagus | ESCC | 5.46e-09 | 1.79e-01 | 0.1323 |
| 60684 | TRAPPC11 | P5T-E | Human | Esophagus | ESCC | 3.21e-06 | 9.62e-02 | 0.1327 |
| 60684 | TRAPPC11 | P8T-E | Human | Esophagus | ESCC | 6.34e-17 | 1.91e-01 | 0.0889 |
| 60684 | TRAPPC11 | P9T-E | Human | Esophagus | ESCC | 1.80e-07 | 6.35e-02 | 0.1131 |
| 60684 | TRAPPC11 | P10T-E | Human | Esophagus | ESCC | 1.94e-10 | 1.06e-01 | 0.116 |
| 60684 | TRAPPC11 | P11T-E | Human | Esophagus | ESCC | 1.20e-09 | 1.77e-01 | 0.1426 |
| 60684 | TRAPPC11 | P12T-E | Human | Esophagus | ESCC | 1.85e-19 | 3.46e-01 | 0.1122 |
| 60684 | TRAPPC11 | P15T-E | Human | Esophagus | ESCC | 3.30e-09 | 1.39e-01 | 0.1149 |
| 60684 | TRAPPC11 | P16T-E | Human | Esophagus | ESCC | 2.83e-06 | 1.88e-01 | 0.1153 |
| 60684 | TRAPPC11 | P17T-E | Human | Esophagus | ESCC | 4.27e-04 | 1.10e-01 | 0.1278 |
| 60684 | TRAPPC11 | P20T-E | Human | Esophagus | ESCC | 8.23e-19 | 2.20e-01 | 0.1124 |
| 60684 | TRAPPC11 | P21T-E | Human | Esophagus | ESCC | 7.29e-13 | 2.00e-01 | 0.1617 |
| 60684 | TRAPPC11 | P22T-E | Human | Esophagus | ESCC | 2.85e-07 | 1.75e-01 | 0.1236 |
| 60684 | TRAPPC11 | P23T-E | Human | Esophagus | ESCC | 3.21e-37 | 7.42e-01 | 0.108 |
| 60684 | TRAPPC11 | P24T-E | Human | Esophagus | ESCC | 4.20e-09 | 1.09e-01 | 0.1287 |
| Page: 1 2 3 |
| Tissue | Expression Dynamics | Abbreviation |
| Esophagus | 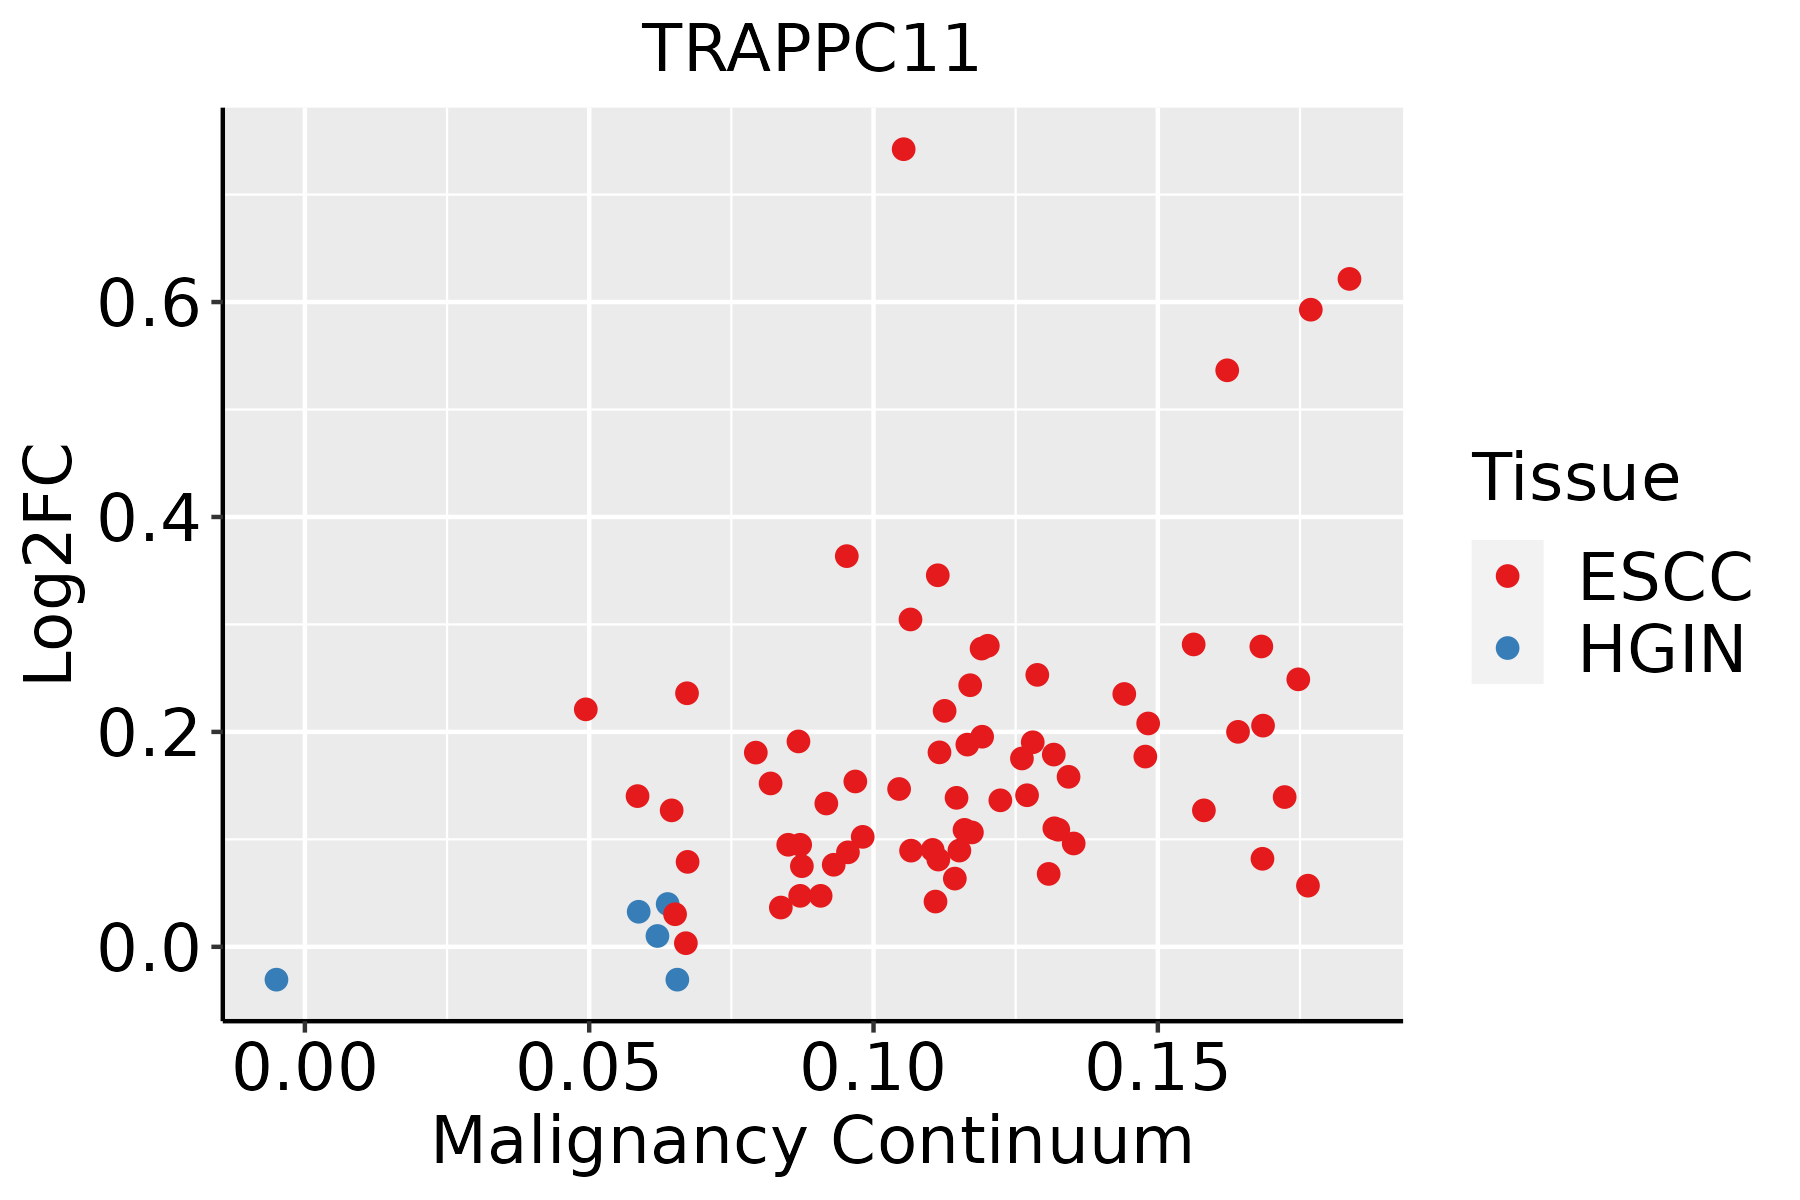 | ESCC: Esophageal squamous cell carcinoma |
| HGIN: High-grade intraepithelial neoplasias | ||
| LGIN: Low-grade intraepithelial neoplasias |
| ∗log2FC in expression of this searched gene in stem-like cells from each diseased tissue sample relative to stem-like cells in normal samples in each tissue plotted against the malignancy continuum. Samples are colored based on if they are from different disease stage. |
Top |
Malignant transformation related pathway analysis |
| Find out the enriched GO biological processes and KEGG pathways involved in transition from healthy to precancer to cancer |
| Tissue | Disease Stage | Enriched GO biological Processes |
| Colorectum | AD |  |
| Colorectum | SER |  |
| Colorectum | MSS |  |
| Colorectum | MSI-H |  |
| Colorectum | FAP |  |
| ∗Top 15 enriched GO BP terms are showed in the bar plot of each disease state in each tissue. Each row represents a significant GO biological process which is colored according to the -log10(p.adjust). |
| Page: 1 2 3 4 5 6 7 8 9 |
| GO ID | Tissue | Disease Stage | Description | Gene Ratio | Bg Ratio | pvalue | p.adjust | Count |
| GO:004819318 | Esophagus | ESCC | Golgi vesicle transport | 231/8552 | 296/18723 | 1.82e-30 | 9.63e-28 | 231 |
| GO:000688815 | Esophagus | ESCC | endoplasmic reticulum to Golgi vesicle-mediated transport | 102/8552 | 130/18723 | 1.73e-14 | 9.22e-13 | 102 |
| GO:00070308 | Esophagus | ESCC | Golgi organization | 101/8552 | 157/18723 | 1.78e-06 | 2.10e-05 | 101 |
| Page: 1 |
| Pathway ID | Tissue | Disease Stage | Description | Gene Ratio | Bg Ratio | pvalue | p.adjust | qvalue | Count |
| Page: 1 |
Top |
Cell-cell communication analysis |
| Identification of potential cell-cell interactions between two cell types and their ligand-receptor pairs for different disease states |
| Ligand | Receptor | LRpair | Pathway | Tissue | Disease Stage |
| Page: 1 |
Top |
Single-cell gene regulatory network inference analysis |
| Find out the significant the regulons (TFs) and the target genes of each regulon across cell types for different disease states |
| TF | Cell Type | Tissue | Disease Stage | Target Gene | RSS | Regulon Activity |
| ∗The dot plots of a searched regulon are shown for all cell subpopulations in each disease state of each tissue based on the regulon specific score inferred using pySCENIC and by calculating the average expression. |
| Page: 1 |
Top |
Somatic mutation of malignant transformation related genes |
| Annotation of somatic variants for genes involved in malignant transformation |
| Hugo Symbol | Variant Class | Variant Classification | dbSNP RS | HGVSc | HGVSp | HGVSp Short | SWISSPROT | BIOTYPE | SIFT | PolyPhen | Tumor Sample Barcode | Tissue | Histology | Sex | Age | Stage | Therapy Types | Drugs | Outcome |
| TRAPPC11 | SNV | Missense_Mutation | c.1286N>T | p.Ser429Phe | p.S429F | Q7Z392 | protein_coding | deleterious(0) | probably_damaging(0.996) | TCGA-AC-A23H-01 | Breast | breast invasive carcinoma | Female | >=65 | I/II | Unknown | Unknown | PD | |
| TRAPPC11 | SNV | Missense_Mutation | novel | c.3121G>A | p.Asp1041Asn | p.D1041N | Q7Z392 | protein_coding | tolerated(0.58) | benign(0) | TCGA-AN-A046-01 | Breast | breast invasive carcinoma | Female | >=65 | I/II | Unknown | Unknown | SD |
| TRAPPC11 | SNV | Missense_Mutation | novel | c.2594N>C | p.Val865Ala | p.V865A | Q7Z392 | protein_coding | tolerated(0.11) | benign(0.015) | TCGA-D8-A1JG-01 | Breast | breast invasive carcinoma | Female | <65 | I/II | Chemotherapy | doxorubicin | SD |
| TRAPPC11 | insertion | In_Frame_Ins | novel | c.3015_3016insACTATGTTTGTTGATAGTAAAATACTTTTAGTTCTT | p.Pro1005_His1006insThrMetPheValAspSerLysIleLeuLeuValLeu | p.P1005_H1006insTMFVDSKILLVL | Q7Z392 | protein_coding | TCGA-AN-A0FN-01 | Breast | breast invasive carcinoma | Female | <65 | I/II | Unknown | Unknown | SD | ||
| TRAPPC11 | deletion | Frame_Shift_Del | novel | c.806delN | p.Thr269IlefsTer6 | p.T269Ifs*6 | Q7Z392 | protein_coding | TCGA-EW-A2FV-01 | Breast | breast invasive carcinoma | Female | <65 | III/IV | Chemotherapy | docetaxel | SD | ||
| TRAPPC11 | SNV | Missense_Mutation | novel | c.3379G>A | p.Asp1127Asn | p.D1127N | Q7Z392 | protein_coding | tolerated(0.08) | benign(0.012) | TCGA-2W-A8YY-01 | Cervix | cervical & endocervical cancer | Female | <65 | I/II | Chemotherapy | cisplatin | CR |
| TRAPPC11 | SNV | Missense_Mutation | novel | c.1939N>A | p.Glu647Lys | p.E647K | Q7Z392 | protein_coding | tolerated(0.73) | benign(0.052) | TCGA-C5-A1MH-01 | Cervix | cervical & endocervical cancer | Female | >=65 | III/IV | Chemotherapy | cisplatin | PD |
| TRAPPC11 | SNV | Missense_Mutation | rs764158202 | c.3014N>T | p.Pro1005Leu | p.P1005L | Q7Z392 | protein_coding | deleterious(0.01) | probably_damaging(1) | TCGA-IR-A3LI-01 | Cervix | cervical & endocervical cancer | Female | <65 | I/II | Chemotherapy | cisplatin | CR |
| TRAPPC11 | SNV | Missense_Mutation | c.47C>A | p.Pro16His | p.P16H | Q7Z392 | protein_coding | deleterious(0) | probably_damaging(0.999) | TCGA-AA-3966-01 | Colorectum | colon adenocarcinoma | Female | >=65 | I/II | Unknown | Unknown | SD | |
| TRAPPC11 | SNV | Missense_Mutation | c.982N>T | p.Asp328Tyr | p.D328Y | Q7Z392 | protein_coding | deleterious(0) | probably_damaging(0.99) | TCGA-AA-3984-01 | Colorectum | colon adenocarcinoma | Female | <65 | I/II | Unknown | Unknown | SD |
| Page: 1 2 3 4 5 6 7 8 9 10 |
Top |
Related drugs of malignant transformation related genes |
| Identification of chemicals and drugs interact with genes involved in malignant transfromation |
| (DGIdb 4.0) |
| Entrez ID | Symbol | Category | Interaction Types | Drug Claim Name | Drug Name | PMIDs |
| Page: 1 |

Copyright 2023-Present -The University of Texas Health Science Center at Houston |