
|
|||||
|
 | |
| |
| |
| |
| |
| |
|
Gene: TRAPPC10 |
Gene summary for TRAPPC10 |
| Gene information | Species | Human | Gene symbol | TRAPPC10 | Gene ID | 7109 |
| Gene name | trafficking protein particle complex subunit 10 | |
| Gene Alias | EHOC-1 | |
| Cytomap | 21q22.3 | |
| Gene Type | protein-coding | GO ID | GO:0006810 | UniProtAcc | P48553 |
Top |
Malignant transformation analysis |
| Identification of the aberrant gene expression in precancerous and cancerous lesions by comparing the gene expression of stem-like cells in diseased tissues with normal stem cells |
| Entrez ID | Symbol | Replicates | Species | Organ | Tissue | Adj P-value | Log2FC | Malignancy |
| 7109 | TRAPPC10 | CCI_2 | Human | Cervix | CC | 2.49e-04 | 6.50e-01 | 0.5249 |
| 7109 | TRAPPC10 | CCI_3 | Human | Cervix | CC | 3.20e-03 | 5.80e-01 | 0.516 |
| 7109 | TRAPPC10 | PTC01 | Human | Thyroid | PTC | 2.74e-06 | 1.33e-01 | 0.1899 |
| 7109 | TRAPPC10 | PTC03 | Human | Thyroid | PTC | 1.79e-07 | 2.96e-01 | 0.1784 |
| 7109 | TRAPPC10 | PTC04 | Human | Thyroid | PTC | 5.37e-18 | 3.39e-01 | 0.1927 |
| 7109 | TRAPPC10 | PTC05 | Human | Thyroid | PTC | 5.53e-08 | 2.87e-01 | 0.2065 |
| 7109 | TRAPPC10 | PTC06 | Human | Thyroid | PTC | 8.49e-21 | 4.15e-01 | 0.2057 |
| 7109 | TRAPPC10 | PTC07 | Human | Thyroid | PTC | 6.99e-29 | 4.82e-01 | 0.2044 |
| 7109 | TRAPPC10 | ATC09 | Human | Thyroid | ATC | 1.29e-03 | 2.00e-01 | 0.2871 |
| 7109 | TRAPPC10 | ATC12 | Human | Thyroid | ATC | 1.04e-12 | 2.72e-01 | 0.34 |
| 7109 | TRAPPC10 | ATC13 | Human | Thyroid | ATC | 1.15e-38 | 7.00e-01 | 0.34 |
| 7109 | TRAPPC10 | ATC1 | Human | Thyroid | ATC | 4.95e-05 | 2.48e-01 | 0.2878 |
| 7109 | TRAPPC10 | ATC2 | Human | Thyroid | ATC | 3.34e-11 | 6.58e-01 | 0.34 |
| 7109 | TRAPPC10 | ATC4 | Human | Thyroid | ATC | 4.36e-15 | 3.32e-01 | 0.34 |
| 7109 | TRAPPC10 | ATC5 | Human | Thyroid | ATC | 1.64e-54 | 7.61e-01 | 0.34 |
| Page: 1 |
| Tissue | Expression Dynamics | Abbreviation |
| Cervix | 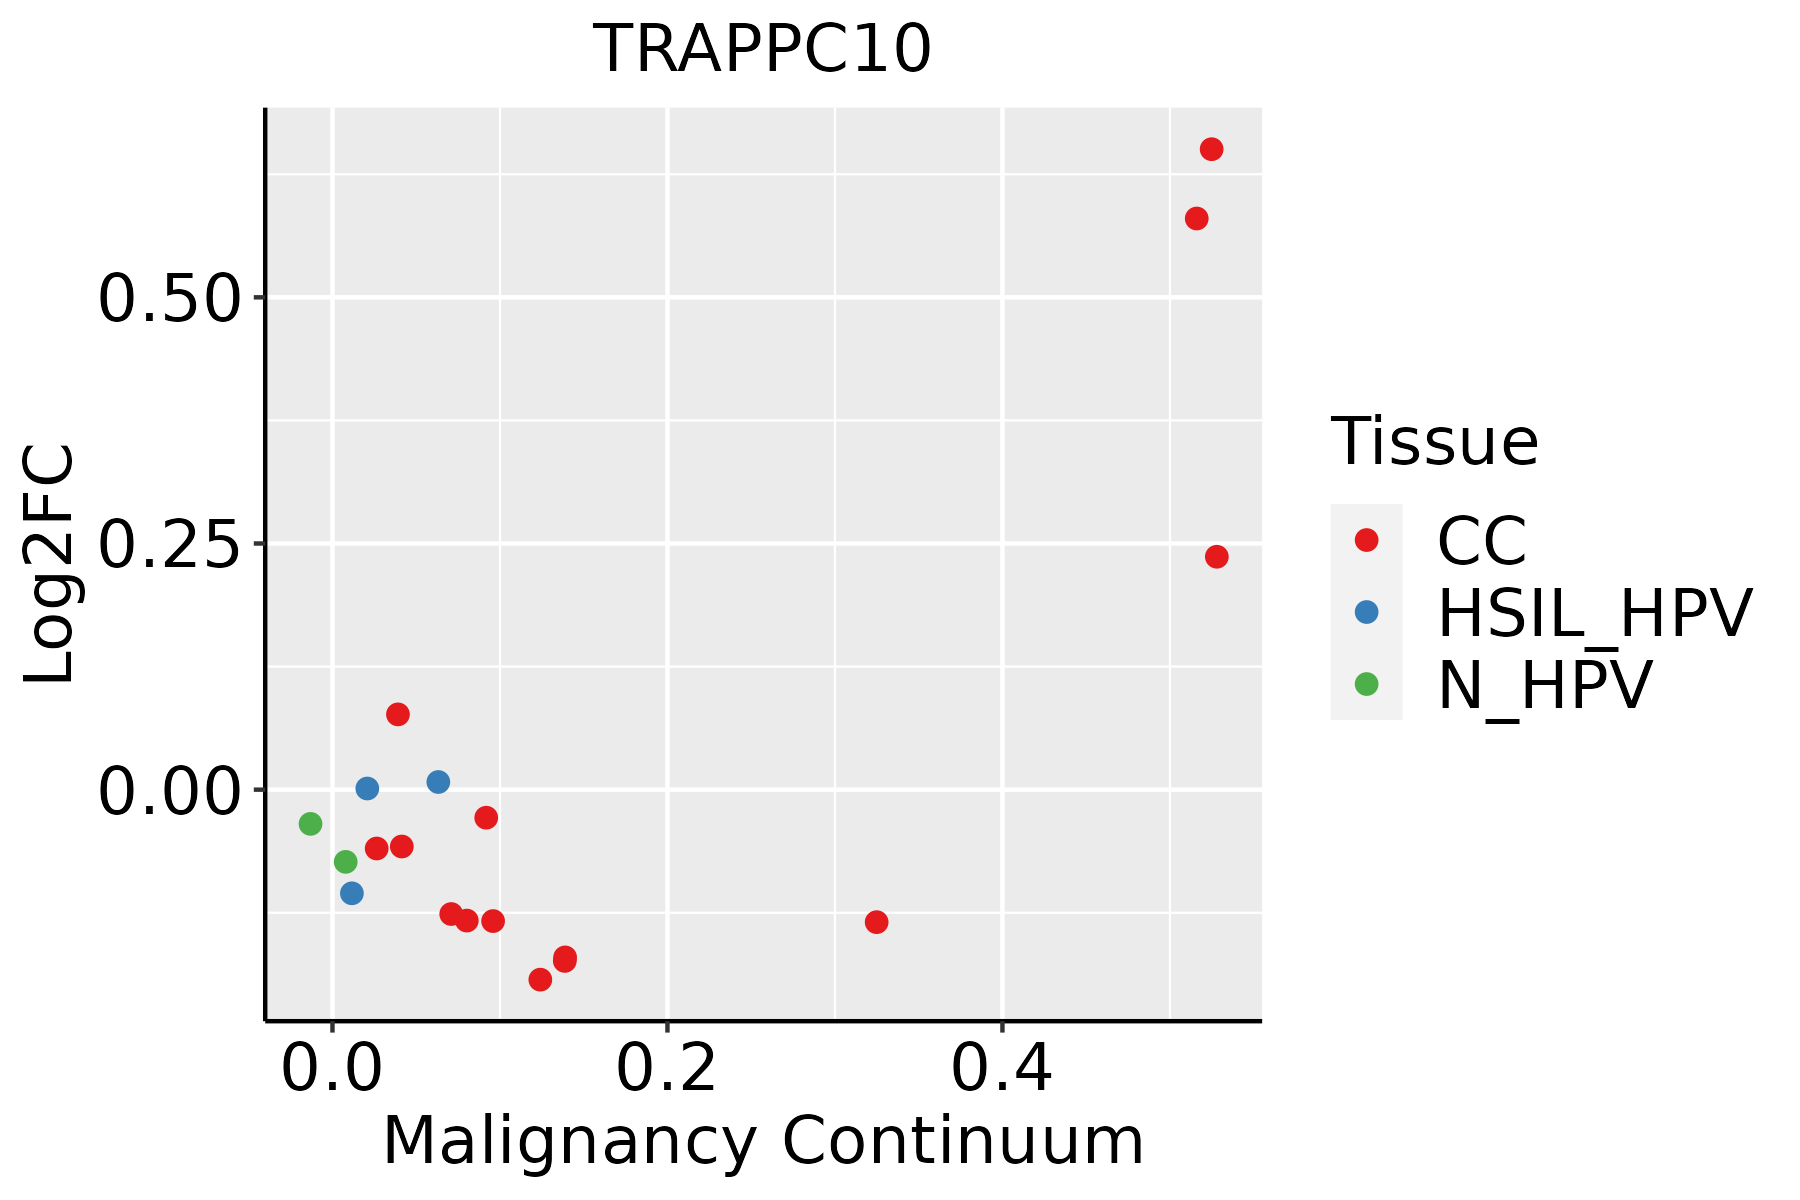 | CC: Cervix cancer |
| HSIL_HPV: HPV-infected high-grade squamous intraepithelial lesions | ||
| N_HPV: HPV-infected normal cervix | ||
| Thyroid |  | ATC: Anaplastic thyroid cancer |
| HT: Hashimoto's thyroiditis | ||
| PTC: Papillary thyroid cancer |
| ∗log2FC in expression of this searched gene in stem-like cells from each diseased tissue sample relative to stem-like cells in normal samples in each tissue plotted against the malignancy continuum. Samples are colored based on if they are from different disease stage. |
Top |
Malignant transformation related pathway analysis |
| Find out the enriched GO biological processes and KEGG pathways involved in transition from healthy to precancer to cancer |
| Tissue | Disease Stage | Enriched GO biological Processes |
| Colorectum | AD |  |
| Colorectum | SER |  |
| Colorectum | MSS |  |
| Colorectum | MSI-H |  |
| Colorectum | FAP |  |
| ∗Top 15 enriched GO BP terms are showed in the bar plot of each disease state in each tissue. Each row represents a significant GO biological process which is colored according to the -log10(p.adjust). |
| Page: 1 2 3 4 5 6 7 8 9 |
| GO ID | Tissue | Disease Stage | Description | Gene Ratio | Bg Ratio | pvalue | p.adjust | Count |
| GO:00161977 | Cervix | CC | endosomal transport | 48/2311 | 230/18723 | 1.65e-04 | 1.97e-03 | 48 |
| GO:00481938 | Cervix | CC | Golgi vesicle transport | 58/2311 | 296/18723 | 2.24e-04 | 2.54e-03 | 58 |
| GO:00164827 | Cervix | CC | cytosolic transport | 33/2311 | 168/18723 | 4.43e-03 | 2.70e-02 | 33 |
| GO:004819320 | Thyroid | PTC | Golgi vesicle transport | 186/5968 | 296/18723 | 3.09e-28 | 1.22e-25 | 186 |
| GO:001619718 | Thyroid | PTC | endosomal transport | 128/5968 | 230/18723 | 6.26e-14 | 3.52e-12 | 128 |
| GO:001648217 | Thyroid | PTC | cytosolic transport | 92/5968 | 168/18723 | 6.41e-10 | 1.97e-08 | 92 |
| GO:00421479 | Thyroid | PTC | retrograde transport, endosome to Golgi | 48/5968 | 91/18723 | 2.86e-05 | 2.78e-04 | 48 |
| GO:00068916 | Thyroid | PTC | intra-Golgi vesicle-mediated transport | 20/5968 | 33/18723 | 6.26e-04 | 3.96e-03 | 20 |
| GO:0048193111 | Thyroid | ATC | Golgi vesicle transport | 189/6293 | 296/18723 | 9.58e-27 | 5.05e-24 | 189 |
| GO:001619719 | Thyroid | ATC | endosomal transport | 128/6293 | 230/18723 | 4.44e-12 | 1.75e-10 | 128 |
| GO:001648218 | Thyroid | ATC | cytosolic transport | 93/6293 | 168/18723 | 5.19e-09 | 1.15e-07 | 93 |
| GO:004214715 | Thyroid | ATC | retrograde transport, endosome to Golgi | 49/6293 | 91/18723 | 5.48e-05 | 4.23e-04 | 49 |
| GO:000689113 | Thyroid | ATC | intra-Golgi vesicle-mediated transport | 20/6293 | 33/18723 | 1.33e-03 | 6.96e-03 | 20 |
| Page: 1 |
| Pathway ID | Tissue | Disease Stage | Description | Gene Ratio | Bg Ratio | pvalue | p.adjust | qvalue | Count |
| Page: 1 |
Top |
Cell-cell communication analysis |
| Identification of potential cell-cell interactions between two cell types and their ligand-receptor pairs for different disease states |
| Ligand | Receptor | LRpair | Pathway | Tissue | Disease Stage |
| Page: 1 |
Top |
Single-cell gene regulatory network inference analysis |
| Find out the significant the regulons (TFs) and the target genes of each regulon across cell types for different disease states |
| TF | Cell Type | Tissue | Disease Stage | Target Gene | RSS | Regulon Activity |
| ∗The dot plots of a searched regulon are shown for all cell subpopulations in each disease state of each tissue based on the regulon specific score inferred using pySCENIC and by calculating the average expression. |
| Page: 1 |
Top |
Somatic mutation of malignant transformation related genes |
| Annotation of somatic variants for genes involved in malignant transformation |
| Hugo Symbol | Variant Class | Variant Classification | dbSNP RS | HGVSc | HGVSp | HGVSp Short | SWISSPROT | BIOTYPE | SIFT | PolyPhen | Tumor Sample Barcode | Tissue | Histology | Sex | Age | Stage | Therapy Types | Drugs | Outcome |
| TRAPPC10 | SNV | Missense_Mutation | rs143166326 | c.3028G>A | p.Val1010Ile | p.V1010I | P48553 | protein_coding | tolerated(0.2) | benign(0.003) | TCGA-A2-A0YL-01 | Breast | breast invasive carcinoma | Female | <65 | III/IV | Chemotherapy | cytoxan | SD |
| TRAPPC10 | SNV | Missense_Mutation | c.1015G>A | p.Val339Met | p.V339M | P48553 | protein_coding | deleterious(0.02) | possibly_damaging(0.791) | TCGA-A8-A085-01 | Breast | breast invasive carcinoma | Male | <65 | I/II | Hormone Therapy | tamoxiphen | SD | |
| TRAPPC10 | SNV | Missense_Mutation | c.1427N>A | p.Arg476Gln | p.R476Q | P48553 | protein_coding | deleterious(0) | probably_damaging(0.994) | TCGA-AN-A046-01 | Breast | breast invasive carcinoma | Female | >=65 | I/II | Unknown | Unknown | SD | |
| TRAPPC10 | SNV | Missense_Mutation | c.1724G>A | p.Gly575Asp | p.G575D | P48553 | protein_coding | tolerated(0.4) | benign(0.113) | TCGA-AN-A04C-01 | Breast | breast invasive carcinoma | Female | <65 | I/II | Unknown | Unknown | SD | |
| TRAPPC10 | SNV | Missense_Mutation | novel | c.2051N>A | p.Pro684Gln | p.P684Q | P48553 | protein_coding | deleterious(0.01) | probably_damaging(0.987) | TCGA-BH-A0B8-01 | Breast | breast invasive carcinoma | Female | <65 | I/II | Hormone Therapy | arimidex | SD |
| TRAPPC10 | SNV | Missense_Mutation | c.1700N>T | p.Ala567Val | p.A567V | P48553 | protein_coding | tolerated(0.06) | benign(0.086) | TCGA-BH-A0C0-01 | Breast | breast invasive carcinoma | Female | <65 | I/II | Chemotherapy | carboplatin | SD | |
| TRAPPC10 | SNV | Missense_Mutation | c.2837G>A | p.Arg946Lys | p.R946K | P48553 | protein_coding | tolerated(1) | benign(0) | TCGA-BH-A0HF-01 | Breast | breast invasive carcinoma | Female | >=65 | I/II | Hormone Therapy | arimidex | SD | |
| TRAPPC10 | SNV | Missense_Mutation | c.3052N>A | p.Glu1018Lys | p.E1018K | P48553 | protein_coding | tolerated(0.19) | benign(0.082) | TCGA-BH-A0HY-01 | Breast | breast invasive carcinoma | Female | <65 | I/II | Hormone Therapy | taxotere | CR | |
| TRAPPC10 | SNV | Missense_Mutation | novel | c.3157N>A | p.Glu1053Lys | p.E1053K | P48553 | protein_coding | tolerated(0.06) | benign(0.342) | TCGA-C8-A26Y-01 | Breast | breast invasive carcinoma | Female | >=65 | I/II | Unknown | Unknown | SD |
| TRAPPC10 | SNV | Missense_Mutation | novel | c.386N>C | p.Glu129Ala | p.E129A | P48553 | protein_coding | tolerated(0.05) | benign(0.038) | TCGA-JL-A3YW-01 | Breast | breast invasive carcinoma | Female | <65 | I/II | Unknown | Unknown | SD |
| Page: 1 2 3 4 5 6 7 8 9 10 11 12 13 |
Top |
Related drugs of malignant transformation related genes |
| Identification of chemicals and drugs interact with genes involved in malignant transfromation |
| (DGIdb 4.0) |
| Entrez ID | Symbol | Category | Interaction Types | Drug Claim Name | Drug Name | PMIDs |
| Page: 1 |

Copyright 2023-Present -The University of Texas Health Science Center at Houston |