
|
|||||
|
 | |
| |
| |
| |
| |
| |
|
Gene: TRAP1 |
Gene summary for TRAP1 |
| Gene information | Species | Human | Gene symbol | TRAP1 | Gene ID | 10131 |
| Gene name | TNF receptor associated protein 1 | |
| Gene Alias | HSP 75 | |
| Cytomap | 16p13.3 | |
| Gene Type | protein-coding | GO ID | GO:0000302 | UniProtAcc | Q12931 |
Top |
Malignant transformation analysis |
| Identification of the aberrant gene expression in precancerous and cancerous lesions by comparing the gene expression of stem-like cells in diseased tissues with normal stem cells |
| Entrez ID | Symbol | Replicates | Species | Organ | Tissue | Adj P-value | Log2FC | Malignancy |
| 10131 | TRAP1 | LZE2T | Human | Esophagus | ESCC | 3.63e-04 | 1.06e+00 | 0.082 |
| 10131 | TRAP1 | LZE4T | Human | Esophagus | ESCC | 5.04e-12 | 3.39e-01 | 0.0811 |
| 10131 | TRAP1 | LZE7T | Human | Esophagus | ESCC | 9.47e-11 | 3.91e-01 | 0.0667 |
| 10131 | TRAP1 | LZE20T | Human | Esophagus | ESCC | 3.00e-06 | 2.68e-01 | 0.0662 |
| 10131 | TRAP1 | LZE22D1 | Human | Esophagus | HGIN | 8.44e-06 | 2.67e-01 | 0.0595 |
| 10131 | TRAP1 | LZE22T | Human | Esophagus | ESCC | 1.68e-08 | 7.52e-01 | 0.068 |
| 10131 | TRAP1 | LZE24T | Human | Esophagus | ESCC | 1.86e-26 | 7.64e-01 | 0.0596 |
| 10131 | TRAP1 | LZE21T | Human | Esophagus | ESCC | 2.78e-08 | 6.80e-01 | 0.0655 |
| 10131 | TRAP1 | P1T-E | Human | Esophagus | ESCC | 4.09e-15 | 8.30e-01 | 0.0875 |
| 10131 | TRAP1 | P2T-E | Human | Esophagus | ESCC | 1.88e-50 | 1.21e+00 | 0.1177 |
| 10131 | TRAP1 | P4T-E | Human | Esophagus | ESCC | 4.60e-29 | 7.99e-01 | 0.1323 |
| 10131 | TRAP1 | P5T-E | Human | Esophagus | ESCC | 2.57e-26 | 8.73e-01 | 0.1327 |
| 10131 | TRAP1 | P8T-E | Human | Esophagus | ESCC | 3.74e-19 | 5.16e-01 | 0.0889 |
| 10131 | TRAP1 | P9T-E | Human | Esophagus | ESCC | 3.05e-11 | 2.98e-01 | 0.1131 |
| 10131 | TRAP1 | P10T-E | Human | Esophagus | ESCC | 1.44e-25 | 3.95e-01 | 0.116 |
| 10131 | TRAP1 | P11T-E | Human | Esophagus | ESCC | 3.14e-17 | 7.34e-01 | 0.1426 |
| 10131 | TRAP1 | P12T-E | Human | Esophagus | ESCC | 3.14e-50 | 1.29e+00 | 0.1122 |
| 10131 | TRAP1 | P15T-E | Human | Esophagus | ESCC | 5.48e-60 | 1.28e+00 | 0.1149 |
| 10131 | TRAP1 | P16T-E | Human | Esophagus | ESCC | 2.02e-28 | 6.91e-01 | 0.1153 |
| 10131 | TRAP1 | P17T-E | Human | Esophagus | ESCC | 8.77e-24 | 1.14e+00 | 0.1278 |
| Page: 1 2 3 4 5 6 |
| Tissue | Expression Dynamics | Abbreviation |
| Esophagus | 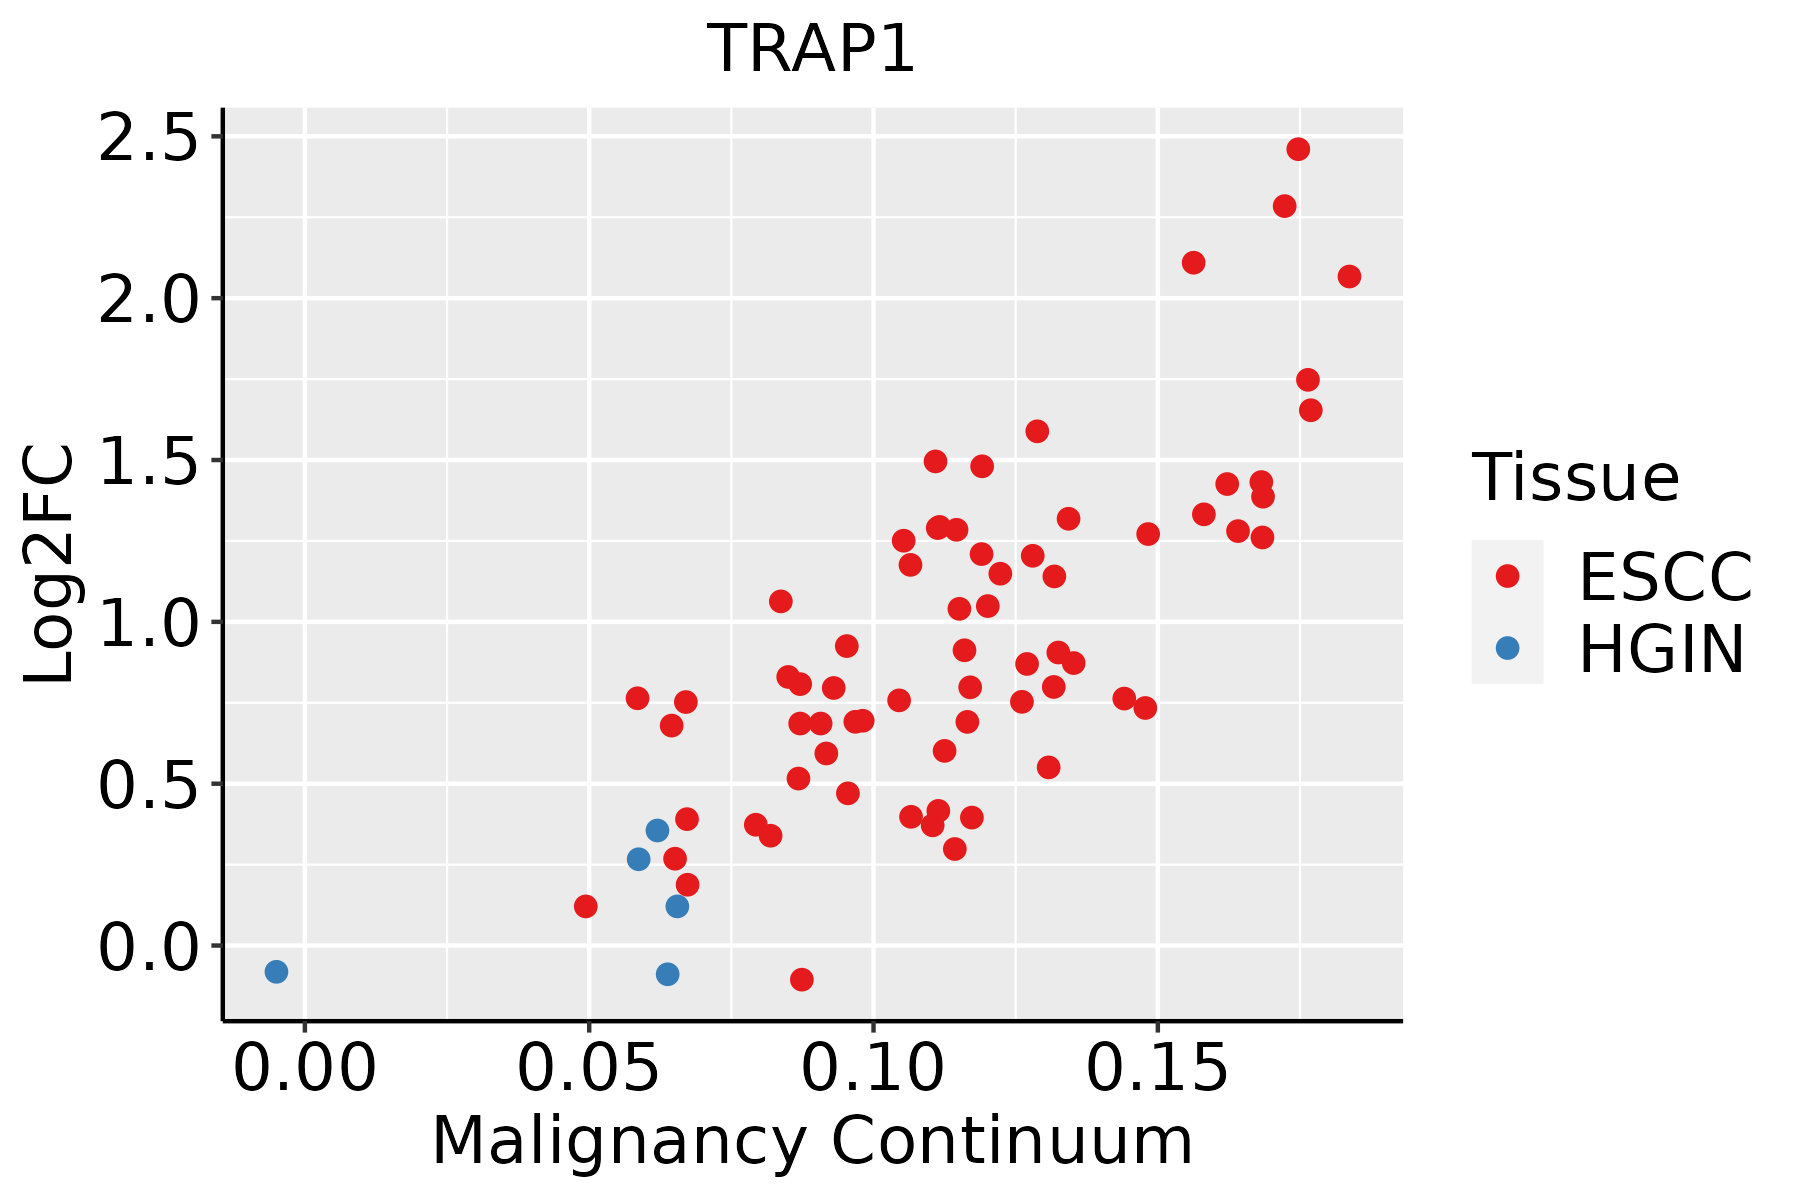 | ESCC: Esophageal squamous cell carcinoma |
| HGIN: High-grade intraepithelial neoplasias | ||
| LGIN: Low-grade intraepithelial neoplasias | ||
| Liver | 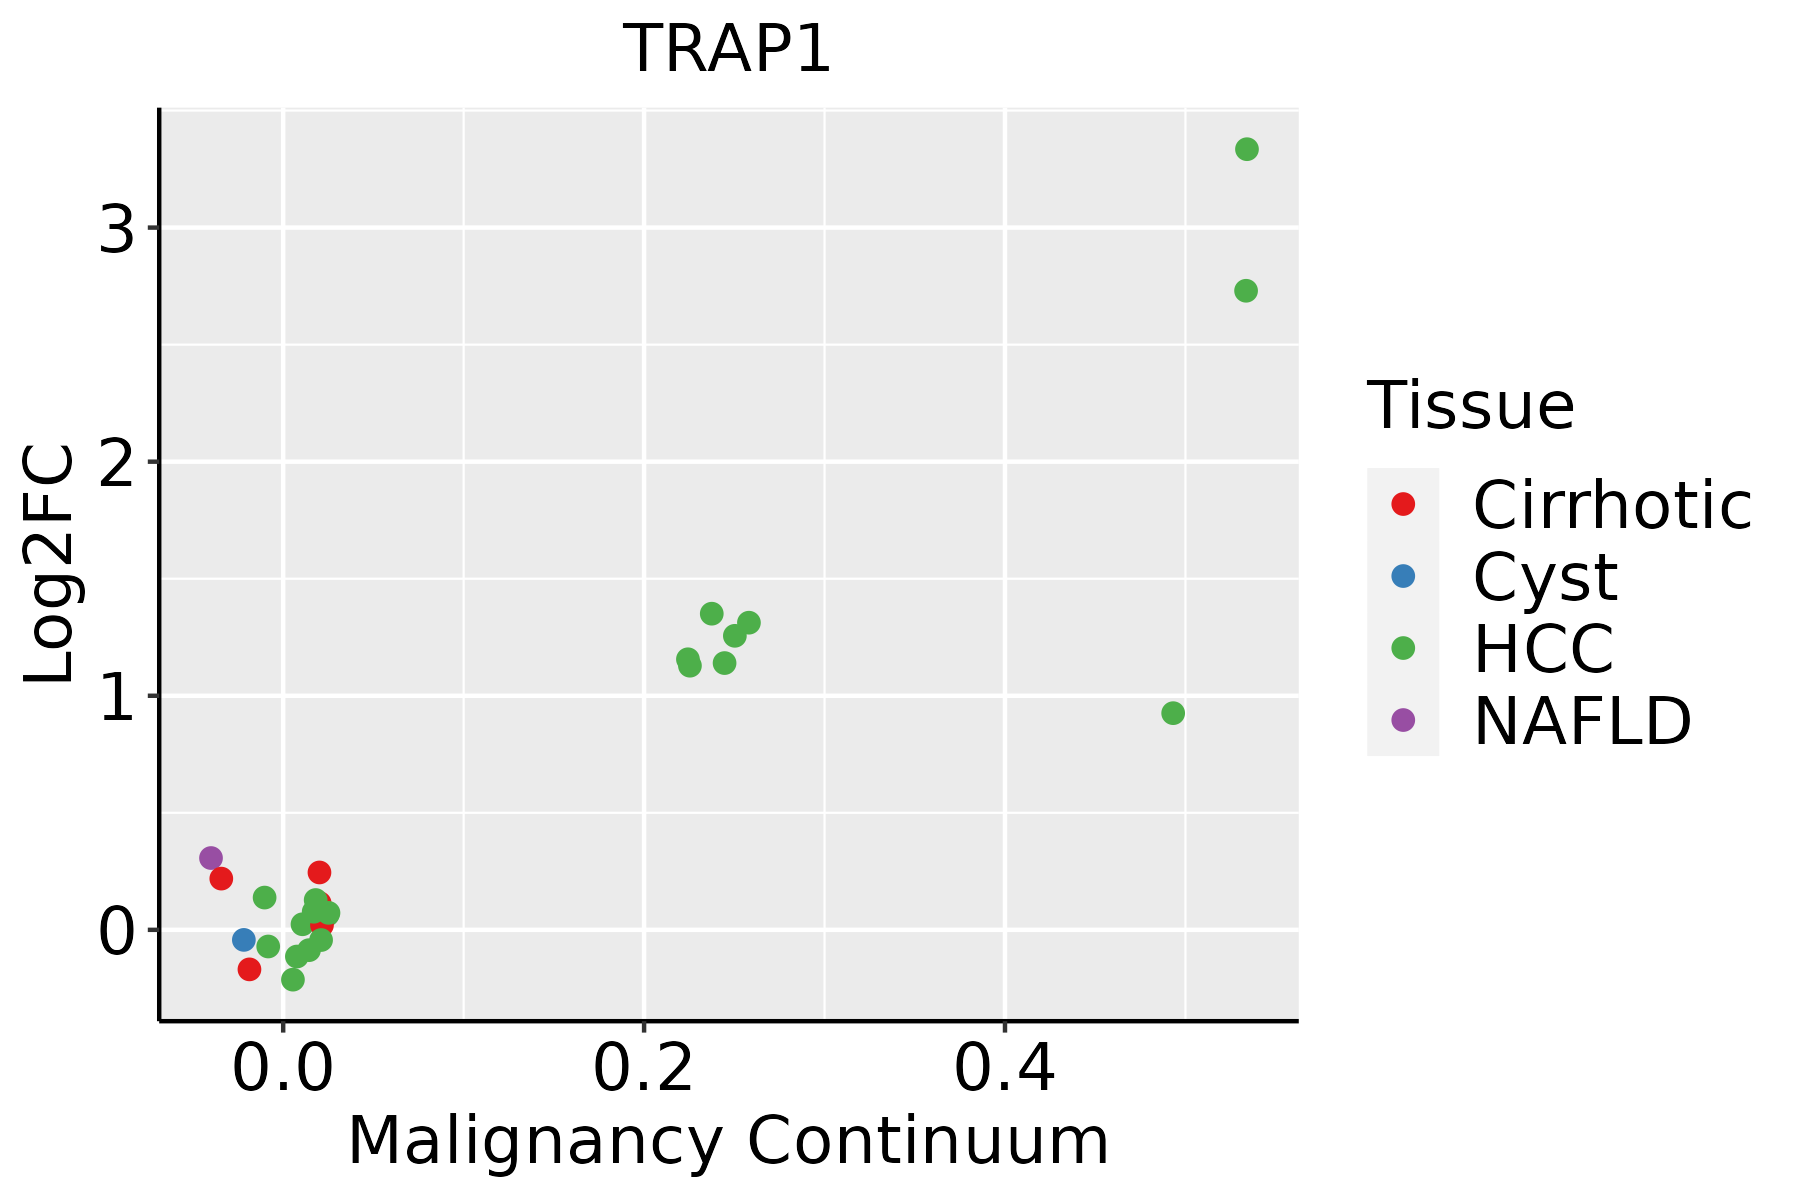 | HCC: Hepatocellular carcinoma |
| NAFLD: Non-alcoholic fatty liver disease | ||
| Oral Cavity | 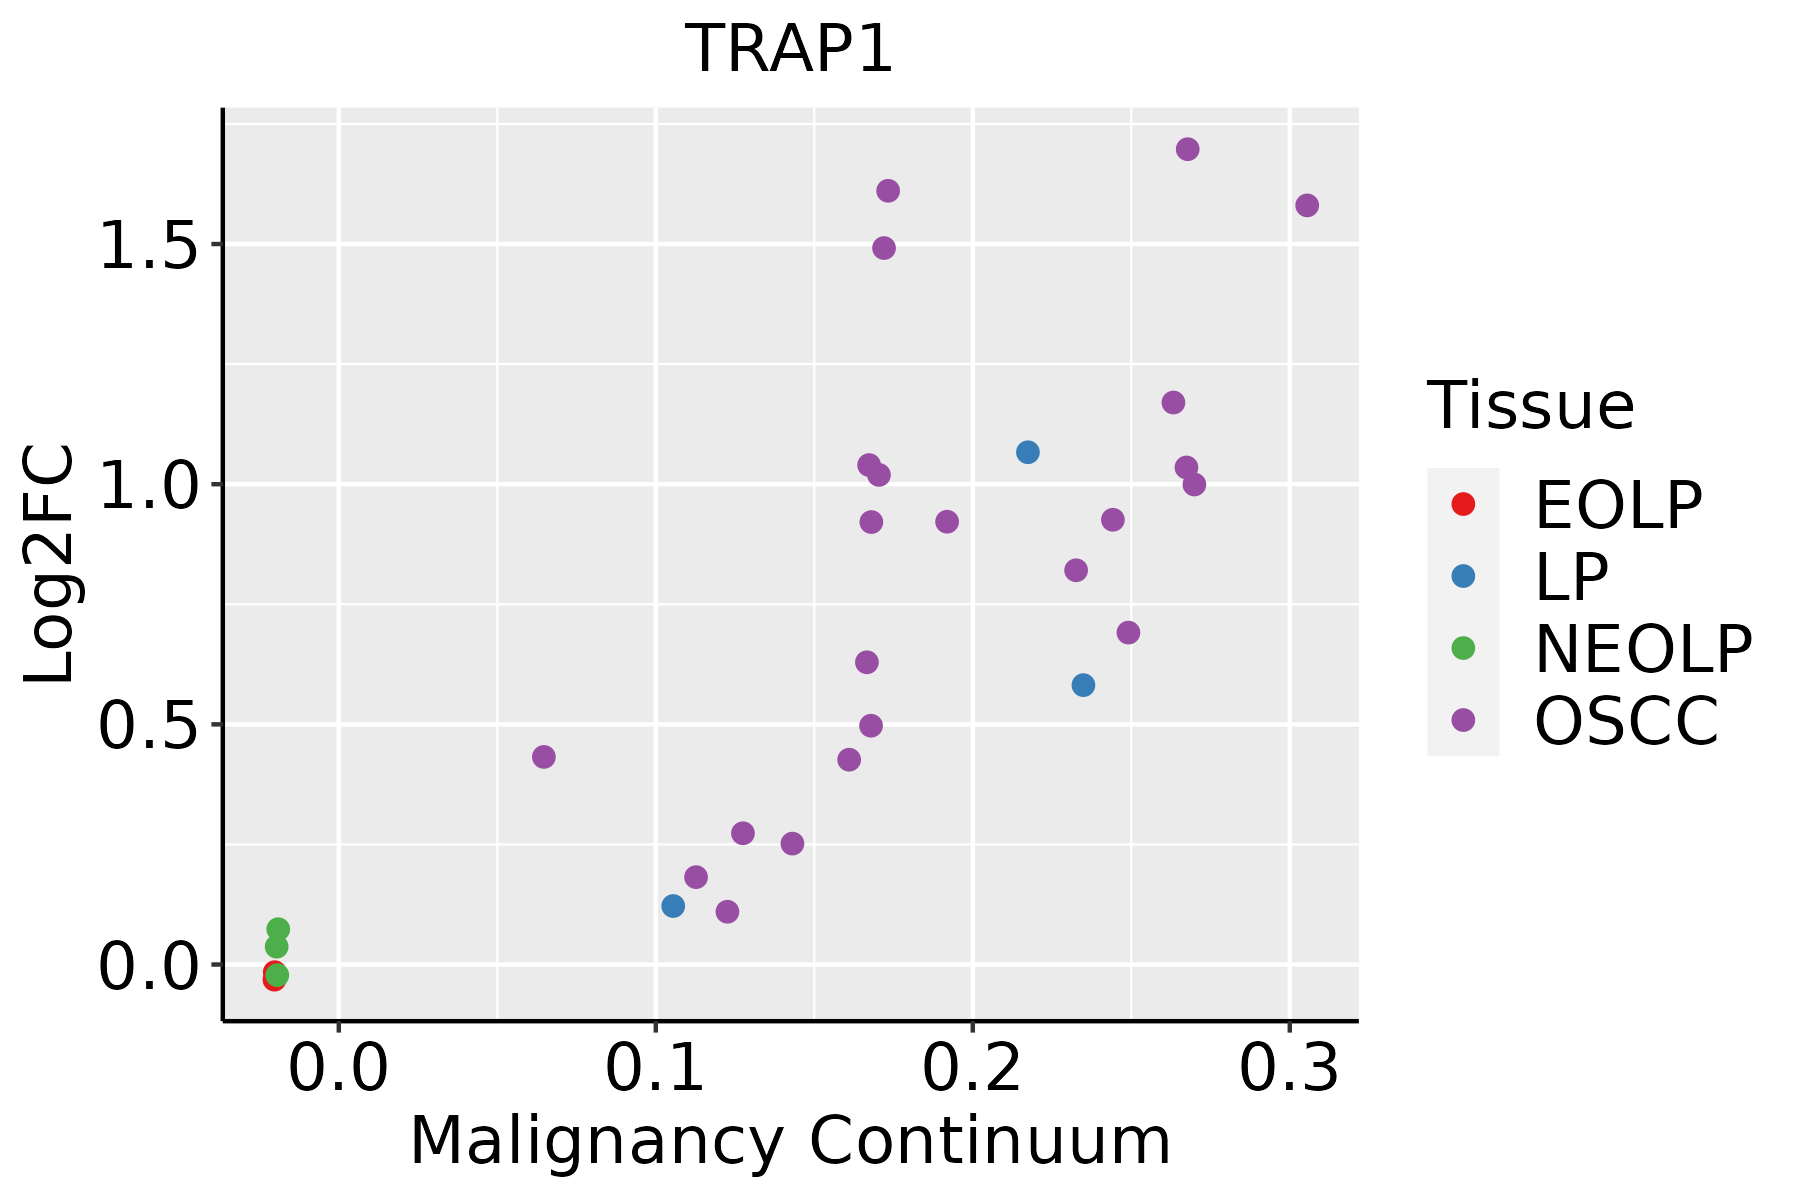 | EOLP: Erosive Oral lichen planus |
| LP: leukoplakia | ||
| NEOLP: Non-erosive oral lichen planus | ||
| OSCC: Oral squamous cell carcinoma | ||
| Skin |  | AK: Actinic keratosis |
| cSCC: Cutaneous squamous cell carcinoma | ||
| SCCIS:squamous cell carcinoma in situ | ||
| Thyroid | 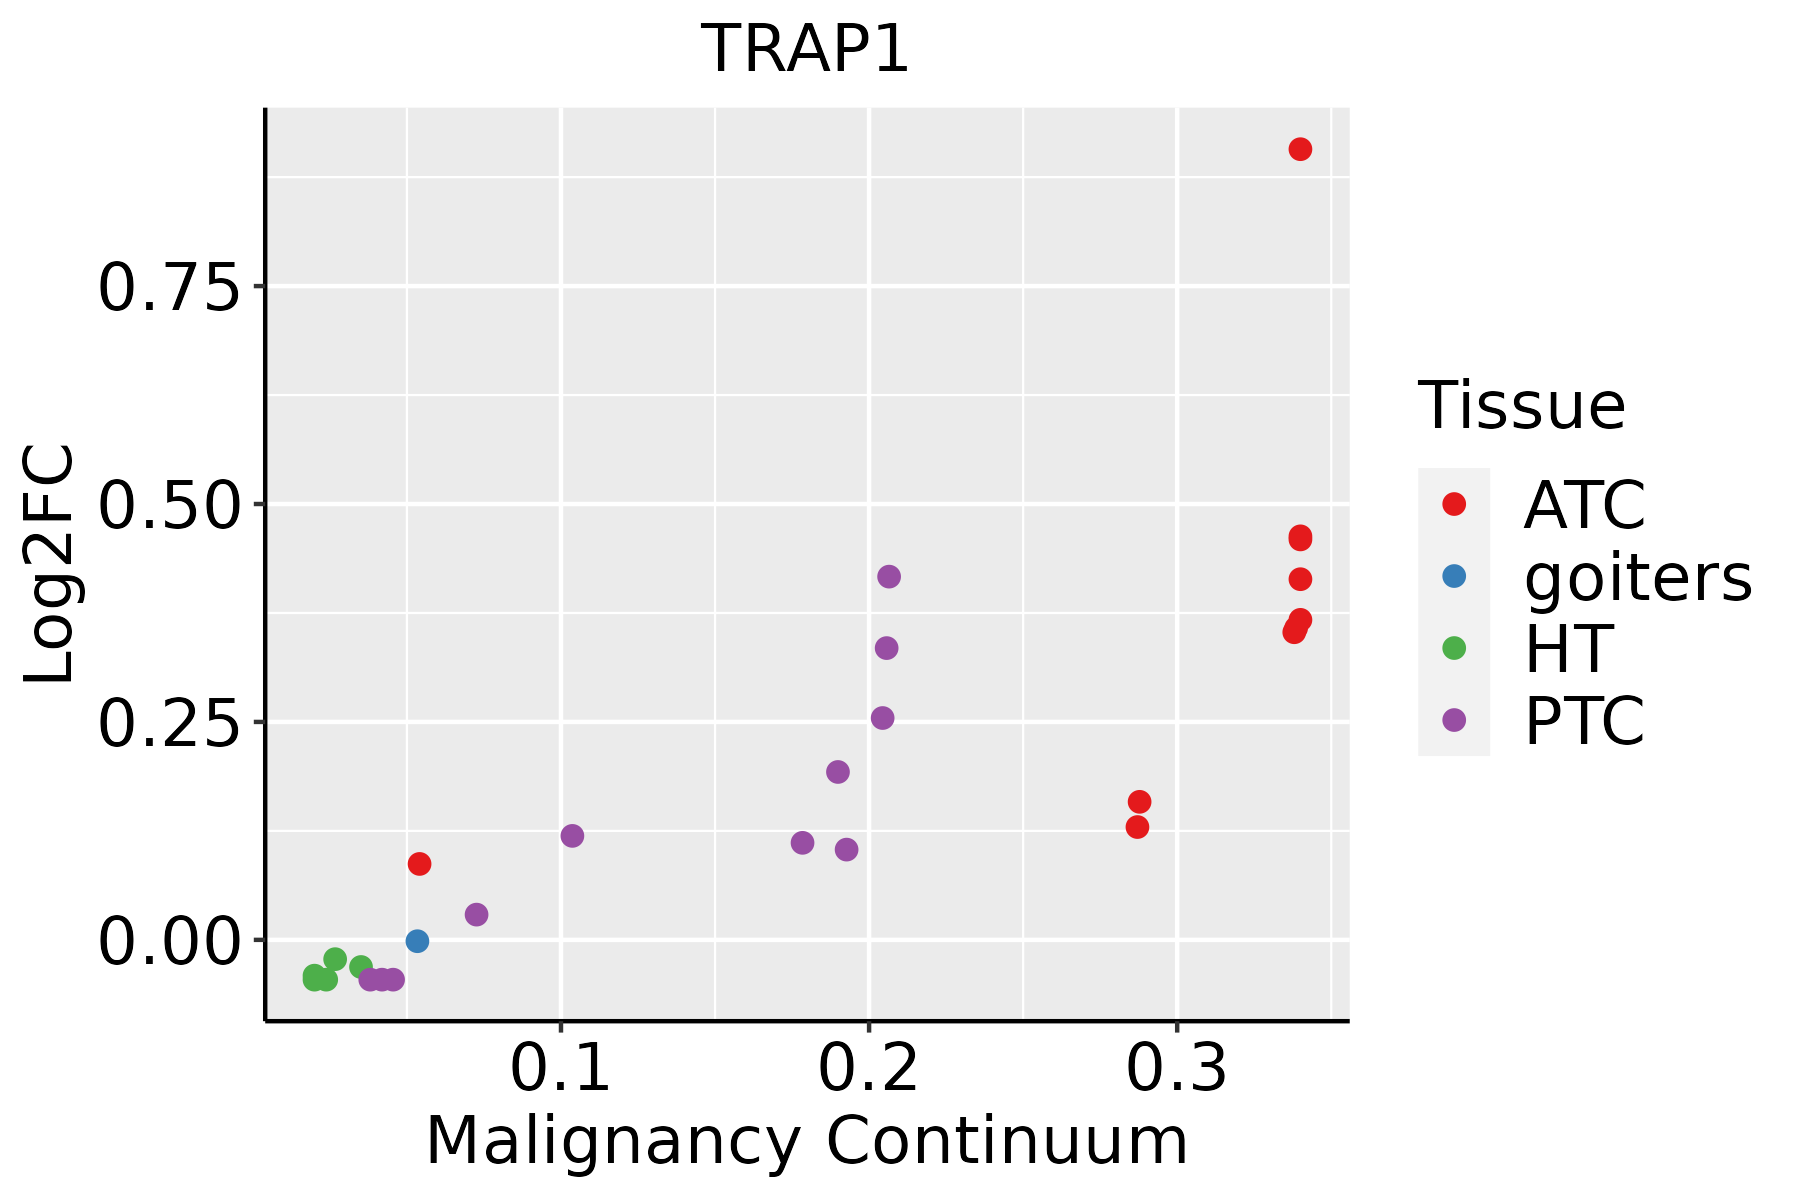 | ATC: Anaplastic thyroid cancer |
| HT: Hashimoto's thyroiditis | ||
| PTC: Papillary thyroid cancer |
| ∗log2FC in expression of this searched gene in stem-like cells from each diseased tissue sample relative to stem-like cells in normal samples in each tissue plotted against the malignancy continuum. Samples are colored based on if they are from different disease stage. |
Top |
Malignant transformation related pathway analysis |
| Find out the enriched GO biological processes and KEGG pathways involved in transition from healthy to precancer to cancer |
| Tissue | Disease Stage | Enriched GO biological Processes |
| Colorectum | AD |  |
| Colorectum | SER |  |
| Colorectum | MSS |  |
| Colorectum | MSI-H |  |
| Colorectum | FAP |  |
| ∗Top 15 enriched GO BP terms are showed in the bar plot of each disease state in each tissue. Each row represents a significant GO biological process which is colored according to the -log10(p.adjust). |
| Page: 1 2 3 4 5 6 7 8 9 |
| GO ID | Tissue | Disease Stage | Description | Gene Ratio | Bg Ratio | pvalue | p.adjust | Count |
| GO:000609120 | Esophagus | HGIN | generation of precursor metabolites and energy | 145/2587 | 490/18723 | 3.41e-20 | 2.04e-17 | 145 |
| GO:000641727 | Esophagus | HGIN | regulation of translation | 139/2587 | 468/18723 | 1.46e-19 | 7.98e-17 | 139 |
| GO:004533320 | Esophagus | HGIN | cellular respiration | 86/2587 | 230/18723 | 2.41e-19 | 1.20e-16 | 86 |
| GO:001598020 | Esophagus | HGIN | energy derivation by oxidation of organic compounds | 105/2587 | 318/18723 | 1.16e-18 | 4.99e-16 | 105 |
| GO:000645720 | Esophagus | HGIN | protein folding | 75/2587 | 212/18723 | 1.61e-15 | 3.86e-13 | 75 |
| GO:009719327 | Esophagus | HGIN | intrinsic apoptotic signaling pathway | 90/2587 | 288/18723 | 1.50e-14 | 2.80e-12 | 90 |
| GO:200124227 | Esophagus | HGIN | regulation of intrinsic apoptotic signaling pathway | 58/2587 | 164/18723 | 2.57e-12 | 3.58e-10 | 58 |
| GO:200123327 | Esophagus | HGIN | regulation of apoptotic signaling pathway | 97/2587 | 356/18723 | 1.36e-11 | 1.57e-09 | 97 |
| GO:000697927 | Esophagus | HGIN | response to oxidative stress | 107/2587 | 446/18723 | 3.91e-09 | 2.76e-07 | 107 |
| GO:006107720 | Esophagus | HGIN | chaperone-mediated protein folding | 27/2587 | 67/18723 | 7.99e-08 | 4.20e-06 | 27 |
| GO:200123427 | Esophagus | HGIN | negative regulation of apoptotic signaling pathway | 59/2587 | 224/18723 | 4.68e-07 | 2.07e-05 | 59 |
| GO:200124325 | Esophagus | HGIN | negative regulation of intrinsic apoptotic signaling pathway | 33/2587 | 98/18723 | 4.73e-07 | 2.07e-05 | 33 |
| GO:006219727 | Esophagus | HGIN | cellular response to chemical stress | 76/2587 | 337/18723 | 8.00e-06 | 2.41e-04 | 76 |
| GO:003459926 | Esophagus | HGIN | cellular response to oxidative stress | 65/2587 | 288/18723 | 3.42e-05 | 8.66e-04 | 65 |
| GO:000030226 | Esophagus | HGIN | response to reactive oxygen species | 52/2587 | 222/18723 | 7.30e-05 | 1.66e-03 | 52 |
| GO:004346718 | Esophagus | HGIN | regulation of generation of precursor metabolites and energy | 34/2587 | 130/18723 | 1.37e-04 | 2.76e-03 | 34 |
| GO:000863119 | Esophagus | HGIN | intrinsic apoptotic signaling pathway in response to oxidative stress | 16/2587 | 45/18723 | 2.04e-04 | 3.78e-03 | 16 |
| GO:190217520 | Esophagus | HGIN | regulation of oxidative stress-induced intrinsic apoptotic signaling pathway | 12/2587 | 29/18723 | 2.48e-04 | 4.38e-03 | 12 |
| GO:004254220 | Esophagus | HGIN | response to hydrogen peroxide | 35/2587 | 146/18723 | 6.58e-04 | 9.01e-03 | 35 |
| GO:190217615 | Esophagus | HGIN | negative regulation of oxidative stress-induced intrinsic apoptotic signaling pathway | 9/2587 | 20/18723 | 7.18e-04 | 9.60e-03 | 9 |
| Page: 1 2 3 4 5 6 7 8 9 10 11 12 13 |
| Pathway ID | Tissue | Disease Stage | Description | Gene Ratio | Bg Ratio | pvalue | p.adjust | qvalue | Count |
| hsa0501239 | Esophagus | HGIN | Parkinson disease | 124/1383 | 266/8465 | 5.95e-32 | 9.70e-30 | 7.70e-30 | 124 |
| hsa0502230 | Esophagus | HGIN | Pathways of neurodegeneration - multiple diseases | 153/1383 | 476/8465 | 1.22e-18 | 4.41e-17 | 3.50e-17 | 153 |
| hsa05012114 | Esophagus | HGIN | Parkinson disease | 124/1383 | 266/8465 | 5.95e-32 | 9.70e-30 | 7.70e-30 | 124 |
| hsa05022113 | Esophagus | HGIN | Pathways of neurodegeneration - multiple diseases | 153/1383 | 476/8465 | 1.22e-18 | 4.41e-17 | 3.50e-17 | 153 |
| hsa05012211 | Esophagus | ESCC | Parkinson disease | 201/4205 | 266/8465 | 1.56e-18 | 8.72e-17 | 4.46e-17 | 201 |
| hsa05022210 | Esophagus | ESCC | Pathways of neurodegeneration - multiple diseases | 318/4205 | 476/8465 | 6.10e-15 | 2.04e-13 | 1.05e-13 | 318 |
| hsa05012310 | Esophagus | ESCC | Parkinson disease | 201/4205 | 266/8465 | 1.56e-18 | 8.72e-17 | 4.46e-17 | 201 |
| hsa0502238 | Esophagus | ESCC | Pathways of neurodegeneration - multiple diseases | 318/4205 | 476/8465 | 6.10e-15 | 2.04e-13 | 1.05e-13 | 318 |
| hsa0501214 | Liver | Cirrhotic | Parkinson disease | 158/2530 | 266/8465 | 3.62e-24 | 6.02e-22 | 3.71e-22 | 158 |
| hsa0502214 | Liver | Cirrhotic | Pathways of neurodegeneration - multiple diseases | 217/2530 | 476/8465 | 7.30e-14 | 2.03e-12 | 1.25e-12 | 217 |
| hsa0501215 | Liver | Cirrhotic | Parkinson disease | 158/2530 | 266/8465 | 3.62e-24 | 6.02e-22 | 3.71e-22 | 158 |
| hsa0502215 | Liver | Cirrhotic | Pathways of neurodegeneration - multiple diseases | 217/2530 | 476/8465 | 7.30e-14 | 2.03e-12 | 1.25e-12 | 217 |
| hsa0501222 | Liver | HCC | Parkinson disease | 198/4020 | 266/8465 | 9.40e-20 | 1.58e-17 | 8.76e-18 | 198 |
| hsa0502222 | Liver | HCC | Pathways of neurodegeneration - multiple diseases | 298/4020 | 476/8465 | 6.59e-12 | 1.30e-10 | 7.22e-11 | 298 |
| hsa0501232 | Liver | HCC | Parkinson disease | 198/4020 | 266/8465 | 9.40e-20 | 1.58e-17 | 8.76e-18 | 198 |
| hsa0502232 | Liver | HCC | Pathways of neurodegeneration - multiple diseases | 298/4020 | 476/8465 | 6.59e-12 | 1.30e-10 | 7.22e-11 | 298 |
| hsa0501230 | Oral cavity | OSCC | Parkinson disease | 188/3704 | 266/8465 | 1.82e-19 | 1.52e-17 | 7.75e-18 | 188 |
| hsa0502228 | Oral cavity | OSCC | Pathways of neurodegeneration - multiple diseases | 292/3704 | 476/8465 | 1.60e-15 | 4.47e-14 | 2.28e-14 | 292 |
| hsa05012113 | Oral cavity | OSCC | Parkinson disease | 188/3704 | 266/8465 | 1.82e-19 | 1.52e-17 | 7.75e-18 | 188 |
| hsa05022112 | Oral cavity | OSCC | Pathways of neurodegeneration - multiple diseases | 292/3704 | 476/8465 | 1.60e-15 | 4.47e-14 | 2.28e-14 | 292 |
| Page: 1 2 |
Top |
Cell-cell communication analysis |
| Identification of potential cell-cell interactions between two cell types and their ligand-receptor pairs for different disease states |
| Ligand | Receptor | LRpair | Pathway | Tissue | Disease Stage |
| Page: 1 |
Top |
Single-cell gene regulatory network inference analysis |
| Find out the significant the regulons (TFs) and the target genes of each regulon across cell types for different disease states |
| TF | Cell Type | Tissue | Disease Stage | Target Gene | RSS | Regulon Activity |
| ∗The dot plots of a searched regulon are shown for all cell subpopulations in each disease state of each tissue based on the regulon specific score inferred using pySCENIC and by calculating the average expression. |
| Page: 1 |
Top |
Somatic mutation of malignant transformation related genes |
| Annotation of somatic variants for genes involved in malignant transformation |
| Hugo Symbol | Variant Class | Variant Classification | dbSNP RS | HGVSc | HGVSp | HGVSp Short | SWISSPROT | BIOTYPE | SIFT | PolyPhen | Tumor Sample Barcode | Tissue | Histology | Sex | Age | Stage | Therapy Types | Drugs | Outcome |
| TRAP1 | SNV | Missense_Mutation | c.509N>G | p.Ser170Cys | p.S170C | Q12931 | protein_coding | deleterious(0) | possibly_damaging(0.84) | TCGA-A8-A08R-01 | Breast | breast invasive carcinoma | Female | <65 | I/II | Unknown | Unknown | SD | |
| TRAP1 | SNV | Missense_Mutation | c.1221N>C | p.Glu407Asp | p.E407D | Q12931 | protein_coding | tolerated(1) | benign(0.006) | TCGA-AC-A23H-01 | Breast | breast invasive carcinoma | Female | >=65 | I/II | Unknown | Unknown | PD | |
| TRAP1 | SNV | Missense_Mutation | rs148589352 | c.140G>A | p.Arg47Gln | p.R47Q | Q12931 | protein_coding | tolerated_low_confidence(0.37) | benign(0) | TCGA-AN-A046-01 | Breast | breast invasive carcinoma | Female | >=65 | I/II | Unknown | Unknown | SD |
| TRAP1 | SNV | Missense_Mutation | rs774978448 | c.1130C>T | p.Thr377Met | p.T377M | Q12931 | protein_coding | tolerated(0.06) | possibly_damaging(0.631) | TCGA-C5-A3HE-01 | Cervix | cervical & endocervical cancer | Female | <65 | I/II | Unknown | Unknown | PD |
| TRAP1 | SNV | Missense_Mutation | rs138210295 | c.1280N>A | p.Ile427Asn | p.I427N | Q12931 | protein_coding | tolerated(0.6) | benign(0) | TCGA-DS-A1OC-01 | Cervix | cervical & endocervical cancer | Female | <65 | I/II | Chemotherapy | gemcitabine | SD |
| TRAP1 | SNV | Missense_Mutation | rs139636268 | c.1972N>T | p.Arg658Cys | p.R658C | Q12931 | protein_coding | deleterious(0) | benign(0.4) | TCGA-LP-A5U2-01 | Cervix | cervical & endocervical cancer | Female | <65 | III/IV | Unknown | Unknown | SD |
| TRAP1 | SNV | Missense_Mutation | novel | c.1223G>A | p.Ser408Asn | p.S408N | Q12931 | protein_coding | tolerated(0.23) | benign(0.196) | TCGA-VS-A94Z-01 | Cervix | cervical & endocervical cancer | Female | <65 | I/II | Chemotherapy | cisplatin | CR |
| TRAP1 | SNV | Missense_Mutation | c.1198C>A | p.Leu400Ile | p.L400I | Q12931 | protein_coding | deleterious(0.02) | benign(0.359) | TCGA-AA-3710-01 | Colorectum | colon adenocarcinoma | Female | >=65 | I/II | Unknown | Unknown | SD | |
| TRAP1 | SNV | Missense_Mutation | novel | c.1457A>G | p.Tyr486Cys | p.Y486C | Q12931 | protein_coding | deleterious(0) | probably_damaging(1) | TCGA-AA-3845-01 | Colorectum | colon adenocarcinoma | Female | >=65 | I/II | Unknown | Unknown | PD |
| TRAP1 | SNV | Missense_Mutation | rs765500192 | c.1655N>T | p.Thr552Met | p.T552M | Q12931 | protein_coding | deleterious(0.01) | benign(0.283) | TCGA-AA-A01R-01 | Colorectum | colon adenocarcinoma | Male | <65 | III/IV | Chemotherapy | 5-fluorouracil | PD |
| Page: 1 2 3 4 5 6 7 |
Top |
Related drugs of malignant transformation related genes |
| Identification of chemicals and drugs interact with genes involved in malignant transfromation |
| (DGIdb 4.0) |
| Entrez ID | Symbol | Category | Interaction Types | Drug Claim Name | Drug Name | PMIDs |
| 10131 | TRAP1 | DRUGGABLE GENOME | inhibitor | 315661336 | LUMINESPIB |
| Page: 1 |

Copyright 2023-Present -The University of Texas Health Science Center at Houston |