
|
|||||
|
 | |
| |
| |
| |
| |
| |
|
Gene: TRANK1 |
Gene summary for TRANK1 |
| Gene information | Species | Human | Gene symbol | TRANK1 | Gene ID | 9881 |
| Gene name | tetratricopeptide repeat and ankyrin repeat containing 1 | |
| Gene Alias | LBA1 | |
| Cytomap | 3p22.2 | |
| Gene Type | protein-coding | GO ID | NA | UniProtAcc | O15050 |
Top |
Malignant transformation analysis |
| Identification of the aberrant gene expression in precancerous and cancerous lesions by comparing the gene expression of stem-like cells in diseased tissues with normal stem cells |
| Entrez ID | Symbol | Replicates | Species | Organ | Tissue | Adj P-value | Log2FC | Malignancy |
| 9881 | TRANK1 | HTA11_2487_2000001011 | Human | Colorectum | SER | 1.45e-10 | 6.93e-01 | -0.1808 |
| 9881 | TRANK1 | HTA11_347_2000001011 | Human | Colorectum | AD | 6.70e-10 | 5.83e-01 | -0.1954 |
| 9881 | TRANK1 | HTA11_411_2000001011 | Human | Colorectum | SER | 3.75e-06 | 1.57e+00 | -0.2602 |
| 9881 | TRANK1 | HTA11_2112_2000001011 | Human | Colorectum | SER | 2.16e-05 | 1.25e+00 | -0.2196 |
| 9881 | TRANK1 | HTA11_696_2000001011 | Human | Colorectum | AD | 1.82e-04 | 3.63e-01 | -0.1464 |
| 9881 | TRANK1 | HTA11_866_2000001011 | Human | Colorectum | AD | 4.79e-02 | 2.60e-01 | -0.1001 |
| 9881 | TRANK1 | HCC2 | Human | Liver | HCC | 3.43e-15 | 3.79e+00 | 0.5341 |
| 9881 | TRANK1 | S028 | Human | Liver | HCC | 4.03e-02 | 2.32e-01 | 0.2503 |
| 9881 | TRANK1 | S029 | Human | Liver | HCC | 5.46e-11 | 5.71e-01 | 0.2581 |
| 9881 | TRANK1 | 048752_1579-all-cells | Human | Prostate | BPH | 2.69e-16 | 3.14e-01 | 0.1008 |
| 9881 | TRANK1 | 052097_1595-all-cells | Human | Prostate | BPH | 7.05e-03 | 1.29e-01 | 0.0972 |
| 9881 | TRANK1 | 052099_1652-all-cells | Human | Prostate | BPH | 3.33e-06 | 1.80e-01 | 0.1038 |
| 9881 | TRANK1 | GSM5353221_PA_PB2A_Pool_1_3_S25_L001 | Human | Prostate | Tumor | 9.07e-11 | 5.04e-01 | 0.1633 |
| 9881 | TRANK1 | GSM5353222_PA_PB2B_Pool_1_3_S52_L002 | Human | Prostate | Tumor | 1.97e-09 | 3.88e-01 | 0.1608 |
| 9881 | TRANK1 | GSM5353223_PA_PB2B_Pool_2_S26_L001 | Human | Prostate | Tumor | 5.02e-03 | 2.67e-01 | 0.1604 |
| 9881 | TRANK1 | GSM5353224_PA_PR5186_Pool_1_2_3_S27_L001 | Human | Prostate | Tumor | 5.21e-05 | 3.21e-01 | 0.1621 |
| 9881 | TRANK1 | GSM5353228_PA_PR5199-640K_Pool_1_3_S108_L004 | Human | Prostate | Tumor | 3.15e-04 | 8.95e-01 | 0.1537 |
| 9881 | TRANK1 | GSM5353237_PA_PR5251_T2_S8_L001 | Human | Prostate | Tumor | 1.37e-02 | 4.49e-01 | 0.1622 |
| Page: 1 |
| Tissue | Expression Dynamics | Abbreviation |
| Colorectum (GSE201348) |  | FAP: Familial adenomatous polyposis |
| CRC: Colorectal cancer | ||
| Colorectum (HTA11) |  | AD: Adenomas |
| SER: Sessile serrated lesions | ||
| MSI-H: Microsatellite-high colorectal cancer | ||
| MSS: Microsatellite stable colorectal cancer | ||
| Liver | 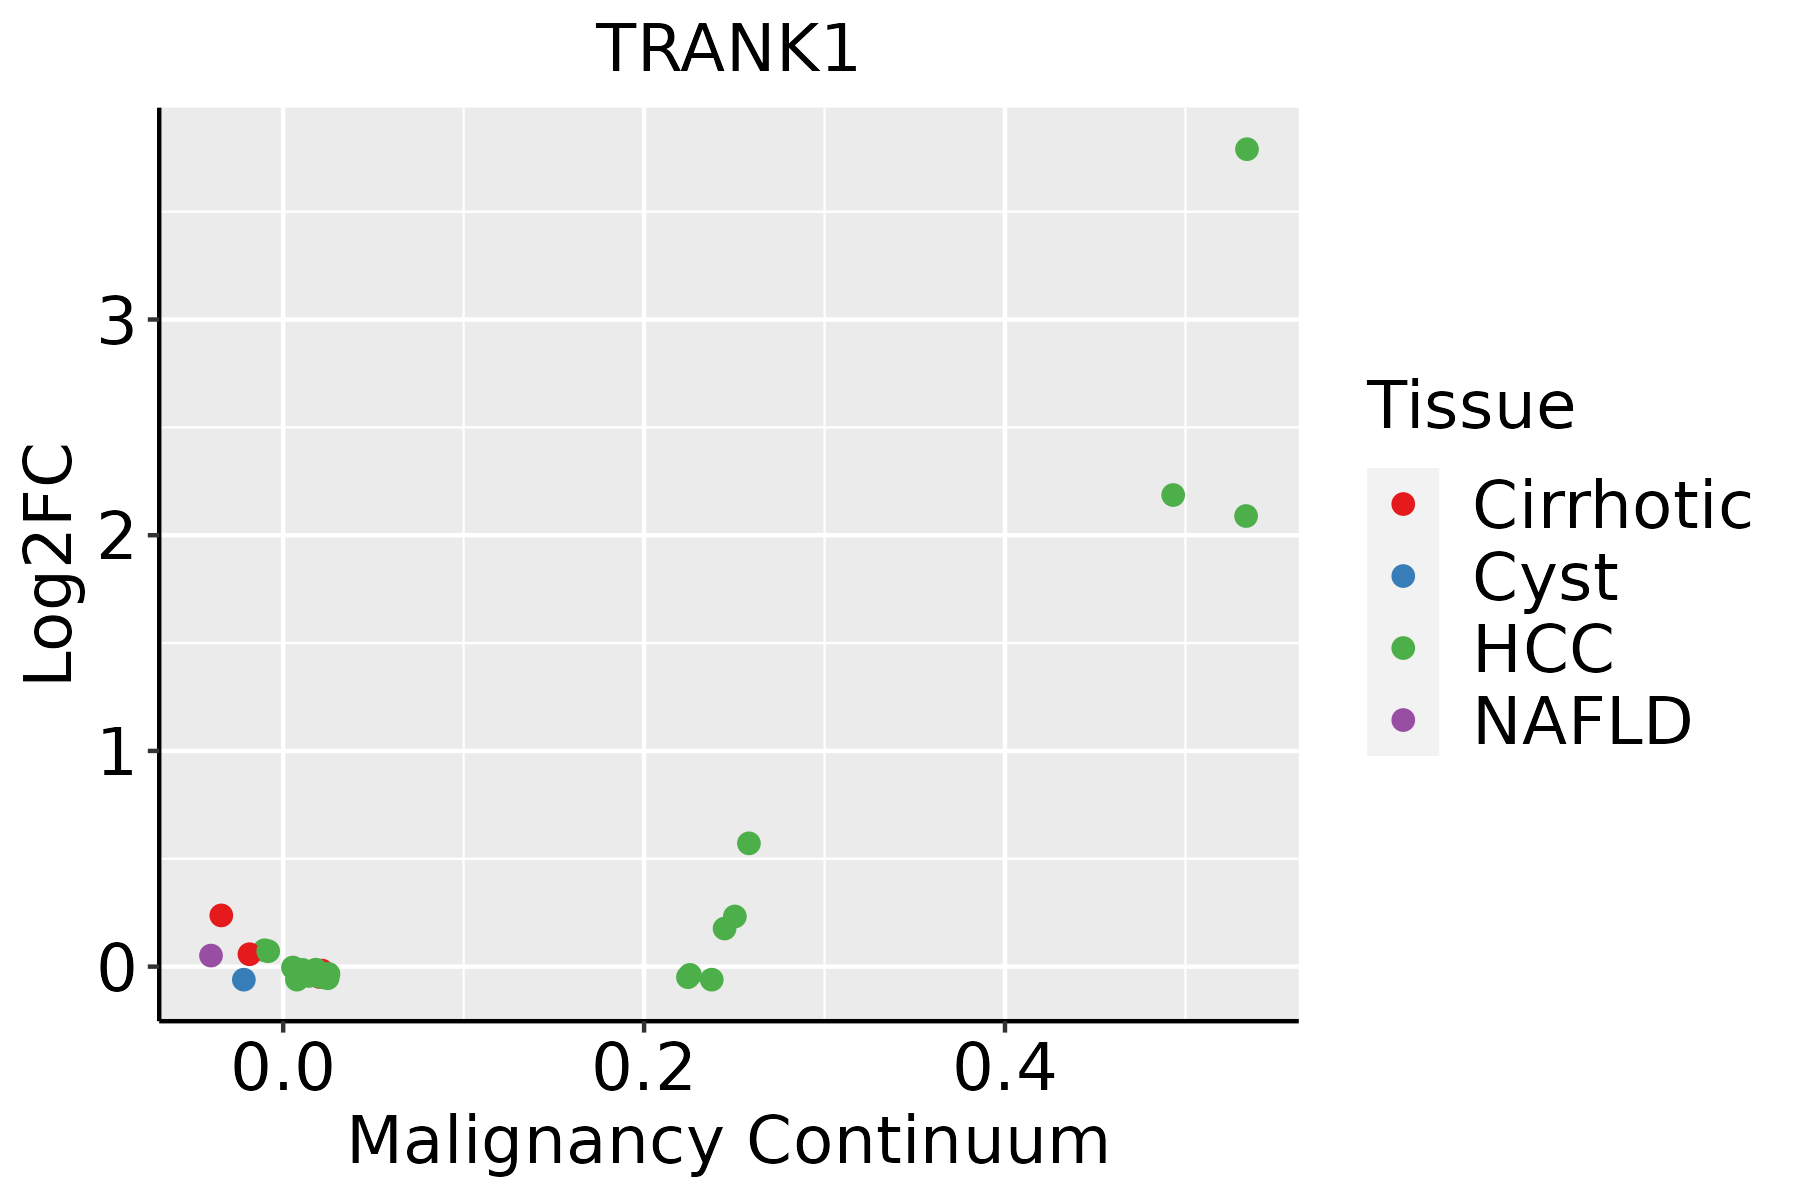 | HCC: Hepatocellular carcinoma |
| NAFLD: Non-alcoholic fatty liver disease | ||
| Prostate |  | BPH: Benign Prostatic Hyperplasia |
| ∗log2FC in expression of this searched gene in stem-like cells from each diseased tissue sample relative to stem-like cells in normal samples in each tissue plotted against the malignancy continuum. Samples are colored based on if they are from different disease stage. |
Top |
Malignant transformation related pathway analysis |
| Find out the enriched GO biological processes and KEGG pathways involved in transition from healthy to precancer to cancer |
| Tissue | Disease Stage | Enriched GO biological Processes |
| Colorectum | AD |  |
| Colorectum | SER |  |
| Colorectum | MSS |  |
| Colorectum | MSI-H |  |
| Colorectum | FAP |  |
| ∗Top 15 enriched GO BP terms are showed in the bar plot of each disease state in each tissue. Each row represents a significant GO biological process which is colored according to the -log10(p.adjust). |
| Page: 1 2 3 4 5 6 7 8 9 |
| GO ID | Tissue | Disease Stage | Description | Gene Ratio | Bg Ratio | pvalue | p.adjust | Count |
| Page: 1 |
| Pathway ID | Tissue | Disease Stage | Description | Gene Ratio | Bg Ratio | pvalue | p.adjust | qvalue | Count |
| Page: 1 |
Top |
Cell-cell communication analysis |
| Identification of potential cell-cell interactions between two cell types and their ligand-receptor pairs for different disease states |
| Ligand | Receptor | LRpair | Pathway | Tissue | Disease Stage |
| Page: 1 |
Top |
Single-cell gene regulatory network inference analysis |
| Find out the significant the regulons (TFs) and the target genes of each regulon across cell types for different disease states |
| TF | Cell Type | Tissue | Disease Stage | Target Gene | RSS | Regulon Activity |
| ∗The dot plots of a searched regulon are shown for all cell subpopulations in each disease state of each tissue based on the regulon specific score inferred using pySCENIC and by calculating the average expression. |
| Page: 1 |
Top |
Somatic mutation of malignant transformation related genes |
| Annotation of somatic variants for genes involved in malignant transformation |
| Hugo Symbol | Variant Class | Variant Classification | dbSNP RS | HGVSc | HGVSp | HGVSp Short | SWISSPROT | BIOTYPE | SIFT | PolyPhen | Tumor Sample Barcode | Tissue | Histology | Sex | Age | Stage | Therapy Types | Drugs | Outcome |
| TRANK1 | SNV | Missense_Mutation | c.1164N>G | p.Phe388Leu | p.F388L | O15050 | protein_coding | tolerated(0.2) | benign(0) | TCGA-A2-A0SY-01 | Breast | breast invasive carcinoma | Female | <65 | III/IV | Hormone Therapy | arimidex | SD | |
| TRANK1 | SNV | Missense_Mutation | rs749709168 | c.7816T>G | p.Trp2606Gly | p.W2606G | O15050 | protein_coding | deleterious(0.03) | benign(0.048) | TCGA-A2-A1G4-01 | Breast | breast invasive carcinoma | Female | >=65 | III/IV | Chemotherapy | adriamycin | SD |
| TRANK1 | SNV | Missense_Mutation | c.6021N>G | p.Phe2007Leu | p.F2007L | O15050 | protein_coding | tolerated(0.67) | benign(0) | TCGA-A8-A08O-01 | Breast | breast invasive carcinoma | Female | <65 | III/IV | Chemotherapy | docetaxel | PD | |
| TRANK1 | SNV | Missense_Mutation | novel | c.5393N>T | p.Asp1798Val | p.D1798V | O15050 | protein_coding | deleterious(0) | possibly_damaging(0.784) | TCGA-A8-A09Q-01 | Breast | breast invasive carcinoma | Female | >=65 | III/IV | Hormone Therapy | anastrozole | SD |
| TRANK1 | SNV | Missense_Mutation | c.3592N>G | p.Leu1198Val | p.L1198V | O15050 | protein_coding | deleterious(0) | possibly_damaging(0.832) | TCGA-AC-A23H-01 | Breast | breast invasive carcinoma | Female | >=65 | I/II | Unknown | Unknown | PD | |
| TRANK1 | SNV | Missense_Mutation | c.1847N>G | p.Ser616Cys | p.S616C | O15050 | protein_coding | tolerated(0.07) | benign(0.125) | TCGA-AC-A23H-01 | Breast | breast invasive carcinoma | Female | >=65 | I/II | Unknown | Unknown | PD | |
| TRANK1 | SNV | Missense_Mutation | novel | c.8267N>A | p.Leu2756His | p.L2756H | O15050 | protein_coding | tolerated(0.55) | benign(0.001) | TCGA-AC-A6IW-01 | Breast | breast invasive carcinoma | Female | >=65 | I/II | Unknown | Unknown | SD |
| TRANK1 | SNV | Missense_Mutation | novel | c.2655N>T | p.Glu885Asp | p.E885D | O15050 | protein_coding | tolerated(0.06) | benign(0.197) | TCGA-AN-A046-01 | Breast | breast invasive carcinoma | Female | >=65 | I/II | Unknown | Unknown | SD |
| TRANK1 | SNV | Missense_Mutation | novel | c.1692N>T | p.Lys564Asn | p.K564N | O15050 | protein_coding | tolerated(0.12) | benign(0.001) | TCGA-AN-A046-01 | Breast | breast invasive carcinoma | Female | >=65 | I/II | Unknown | Unknown | SD |
| TRANK1 | SNV | Missense_Mutation | novel | c.1418N>G | p.Lys473Arg | p.K473R | O15050 | protein_coding | tolerated(0.19) | benign(0.003) | TCGA-AN-A046-01 | Breast | breast invasive carcinoma | Female | >=65 | I/II | Unknown | Unknown | SD |
| Page: 1 2 3 4 5 6 7 8 9 10 11 12 13 14 15 16 17 18 19 20 21 22 23 24 25 26 27 28 29 |
Top |
Related drugs of malignant transformation related genes |
| Identification of chemicals and drugs interact with genes involved in malignant transfromation |
| (DGIdb 4.0) |
| Entrez ID | Symbol | Category | Interaction Types | Drug Claim Name | Drug Name | PMIDs |
| Page: 1 |

Copyright 2023-Present -The University of Texas Health Science Center at Houston |