
|
|||||
|
 | |
| |
| |
| |
| |
| |
|
Gene: TRAM2 |
Gene summary for TRAM2 |
| Gene information | Species | Human | Gene symbol | TRAM2 | Gene ID | 9697 |
| Gene name | translocation associated membrane protein 2 | |
| Gene Alias | TRAM2 | |
| Cytomap | 6p12.2 | |
| Gene Type | protein-coding | GO ID | GO:0006605 | UniProtAcc | A0A024RD84 |
Top |
Malignant transformation analysis |
| Identification of the aberrant gene expression in precancerous and cancerous lesions by comparing the gene expression of stem-like cells in diseased tissues with normal stem cells |
| Entrez ID | Symbol | Replicates | Species | Organ | Tissue | Adj P-value | Log2FC | Malignancy |
| 9697 | TRAM2 | LZE2T | Human | Esophagus | ESCC | 5.48e-05 | 3.91e-01 | 0.082 |
| 9697 | TRAM2 | LZE4T | Human | Esophagus | ESCC | 1.14e-02 | 1.28e-01 | 0.0811 |
| 9697 | TRAM2 | LZE7T | Human | Esophagus | ESCC | 1.43e-07 | 3.76e-01 | 0.0667 |
| 9697 | TRAM2 | LZE24T | Human | Esophagus | ESCC | 9.17e-05 | 8.26e-02 | 0.0596 |
| 9697 | TRAM2 | P2T-E | Human | Esophagus | ESCC | 7.17e-03 | 7.70e-02 | 0.1177 |
| 9697 | TRAM2 | P4T-E | Human | Esophagus | ESCC | 1.70e-10 | 2.18e-01 | 0.1323 |
| 9697 | TRAM2 | P8T-E | Human | Esophagus | ESCC | 3.81e-02 | 1.42e-01 | 0.0889 |
| 9697 | TRAM2 | P9T-E | Human | Esophagus | ESCC | 2.63e-07 | 1.65e-01 | 0.1131 |
| 9697 | TRAM2 | P10T-E | Human | Esophagus | ESCC | 7.18e-14 | 2.74e-01 | 0.116 |
| 9697 | TRAM2 | P11T-E | Human | Esophagus | ESCC | 3.91e-12 | 4.54e-01 | 0.1426 |
| 9697 | TRAM2 | P12T-E | Human | Esophagus | ESCC | 9.95e-10 | 1.70e-01 | 0.1122 |
| 9697 | TRAM2 | P15T-E | Human | Esophagus | ESCC | 8.28e-12 | 2.34e-01 | 0.1149 |
| 9697 | TRAM2 | P16T-E | Human | Esophagus | ESCC | 1.13e-05 | 1.81e-01 | 0.1153 |
| 9697 | TRAM2 | P17T-E | Human | Esophagus | ESCC | 1.04e-02 | 1.83e-01 | 0.1278 |
| 9697 | TRAM2 | P19T-E | Human | Esophagus | ESCC | 1.55e-03 | 3.21e-01 | 0.1662 |
| 9697 | TRAM2 | P20T-E | Human | Esophagus | ESCC | 6.13e-06 | 8.42e-02 | 0.1124 |
| 9697 | TRAM2 | P21T-E | Human | Esophagus | ESCC | 7.78e-22 | 4.77e-01 | 0.1617 |
| 9697 | TRAM2 | P22T-E | Human | Esophagus | ESCC | 7.76e-03 | 8.71e-02 | 0.1236 |
| 9697 | TRAM2 | P23T-E | Human | Esophagus | ESCC | 4.25e-05 | 1.54e-01 | 0.108 |
| 9697 | TRAM2 | P24T-E | Human | Esophagus | ESCC | 2.82e-03 | 5.47e-02 | 0.1287 |
| Page: 1 2 3 4 |
| Tissue | Expression Dynamics | Abbreviation |
| Esophagus | 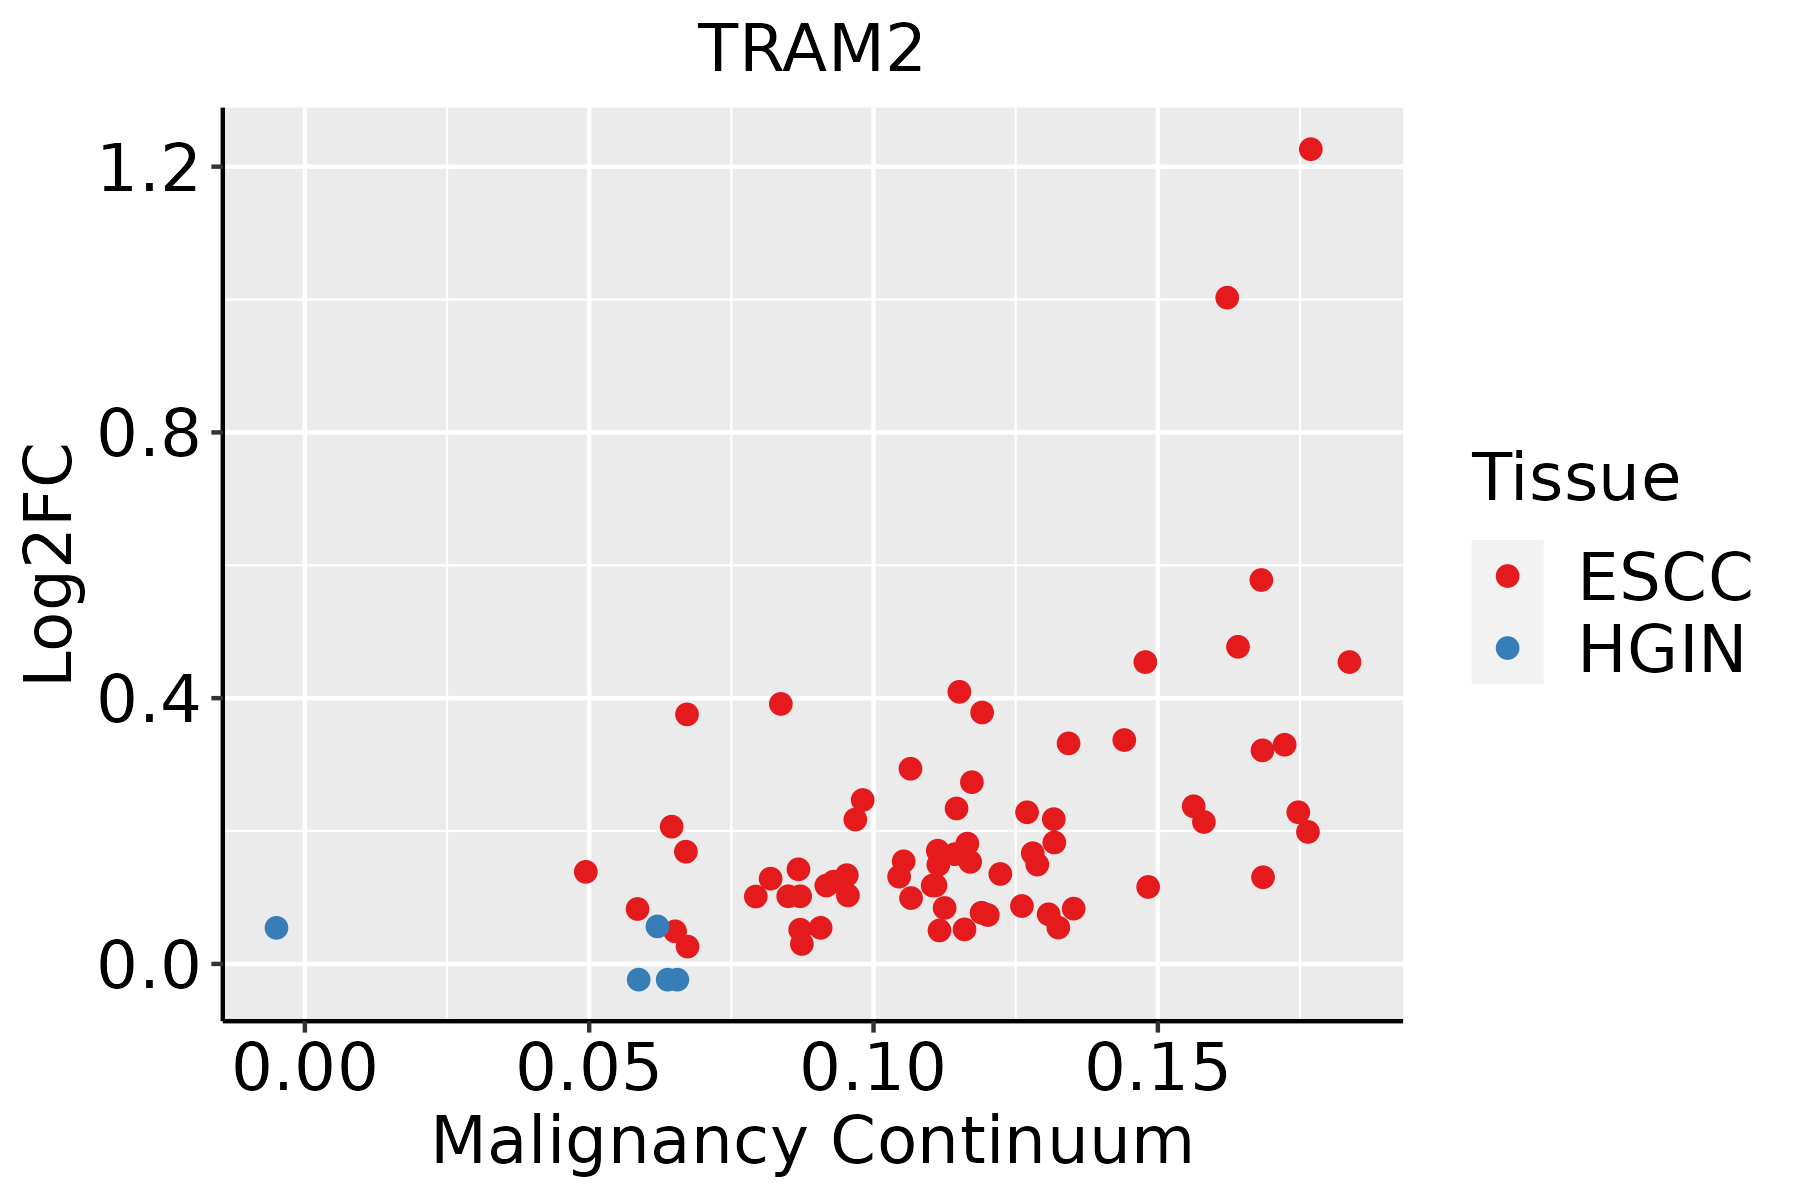 | ESCC: Esophageal squamous cell carcinoma |
| HGIN: High-grade intraepithelial neoplasias | ||
| LGIN: Low-grade intraepithelial neoplasias | ||
| Thyroid |  | ATC: Anaplastic thyroid cancer |
| HT: Hashimoto's thyroiditis | ||
| PTC: Papillary thyroid cancer |
| ∗log2FC in expression of this searched gene in stem-like cells from each diseased tissue sample relative to stem-like cells in normal samples in each tissue plotted against the malignancy continuum. Samples are colored based on if they are from different disease stage. |
Top |
Malignant transformation related pathway analysis |
| Find out the enriched GO biological processes and KEGG pathways involved in transition from healthy to precancer to cancer |
| Tissue | Disease Stage | Enriched GO biological Processes |
| Colorectum | AD |  |
| Colorectum | SER |  |
| Colorectum | MSS |  |
| Colorectum | MSI-H |  |
| Colorectum | FAP |  |
| ∗Top 15 enriched GO BP terms are showed in the bar plot of each disease state in each tissue. Each row represents a significant GO biological process which is colored according to the -log10(p.adjust). |
| Page: 1 2 3 4 5 6 7 8 9 |
| GO ID | Tissue | Disease Stage | Description | Gene Ratio | Bg Ratio | pvalue | p.adjust | Count |
| GO:0072594110 | Esophagus | ESCC | establishment of protein localization to organelle | 311/8552 | 422/18723 | 3.02e-32 | 2.13e-29 | 311 |
| GO:0006605111 | Esophagus | ESCC | protein targeting | 229/8552 | 314/18723 | 4.93e-23 | 1.01e-20 | 229 |
| GO:0090150110 | Esophagus | ESCC | establishment of protein localization to membrane | 182/8552 | 260/18723 | 1.27e-15 | 8.19e-14 | 182 |
| GO:000702914 | Esophagus | ESCC | endoplasmic reticulum organization | 65/8552 | 87/18723 | 3.28e-08 | 6.08e-07 | 65 |
| GO:005120515 | Esophagus | ESCC | protein insertion into membrane | 46/8552 | 57/18723 | 5.90e-08 | 1.04e-06 | 46 |
| GO:00718069 | Esophagus | ESCC | protein transmembrane transport | 47/8552 | 59/18723 | 9.02e-08 | 1.51e-06 | 47 |
| GO:004504812 | Esophagus | ESCC | protein insertion into ER membrane | 21/8552 | 22/18723 | 8.75e-07 | 1.13e-05 | 21 |
| GO:00650026 | Esophagus | ESCC | intracellular protein transmembrane transport | 40/8552 | 51/18723 | 1.76e-06 | 2.08e-05 | 40 |
| GO:007097218 | Esophagus | ESCC | protein localization to endoplasmic reticulum | 52/8552 | 74/18723 | 1.58e-05 | 1.42e-04 | 52 |
| GO:00066124 | Esophagus | ESCC | protein targeting to membrane | 83/8552 | 131/18723 | 3.31e-05 | 2.73e-04 | 83 |
| GO:007259915 | Esophagus | ESCC | establishment of protein localization to endoplasmic reticulum | 31/8552 | 46/18723 | 2.42e-03 | 1.06e-02 | 31 |
| GO:00329631 | Esophagus | ESCC | collagen metabolic process | 62/8552 | 104/18723 | 2.90e-03 | 1.22e-02 | 62 |
| GO:004504715 | Esophagus | ESCC | protein targeting to ER | 28/8552 | 42/18723 | 4.90e-03 | 1.89e-02 | 28 |
| GO:0072594112 | Thyroid | PTC | establishment of protein localization to organelle | 244/5968 | 422/18723 | 1.18e-28 | 4.97e-26 | 244 |
| GO:0006605113 | Thyroid | PTC | protein targeting | 180/5968 | 314/18723 | 6.81e-21 | 1.19e-18 | 180 |
| GO:0090150112 | Thyroid | PTC | establishment of protein localization to membrane | 149/5968 | 260/18723 | 1.64e-17 | 1.59e-15 | 149 |
| GO:0070972111 | Thyroid | PTC | protein localization to endoplasmic reticulum | 51/5968 | 74/18723 | 6.57e-11 | 2.30e-09 | 51 |
| GO:000702915 | Thyroid | PTC | endoplasmic reticulum organization | 51/5968 | 87/18723 | 2.37e-07 | 4.15e-06 | 51 |
| GO:007259918 | Thyroid | PTC | establishment of protein localization to endoplasmic reticulum | 31/5968 | 46/18723 | 8.06e-07 | 1.24e-05 | 31 |
| GO:004504716 | Thyroid | PTC | protein targeting to ER | 28/5968 | 42/18723 | 3.83e-06 | 4.80e-05 | 28 |
| Page: 1 2 3 |
| Pathway ID | Tissue | Disease Stage | Description | Gene Ratio | Bg Ratio | pvalue | p.adjust | qvalue | Count |
| Page: 1 |
Top |
Cell-cell communication analysis |
| Identification of potential cell-cell interactions between two cell types and their ligand-receptor pairs for different disease states |
| Ligand | Receptor | LRpair | Pathway | Tissue | Disease Stage |
| Page: 1 |
Top |
Single-cell gene regulatory network inference analysis |
| Find out the significant the regulons (TFs) and the target genes of each regulon across cell types for different disease states |
| TF | Cell Type | Tissue | Disease Stage | Target Gene | RSS | Regulon Activity |
| ∗The dot plots of a searched regulon are shown for all cell subpopulations in each disease state of each tissue based on the regulon specific score inferred using pySCENIC and by calculating the average expression. |
| Page: 1 |
Top |
Somatic mutation of malignant transformation related genes |
| Annotation of somatic variants for genes involved in malignant transformation |
| Hugo Symbol | Variant Class | Variant Classification | dbSNP RS | HGVSc | HGVSp | HGVSp Short | SWISSPROT | BIOTYPE | SIFT | PolyPhen | Tumor Sample Barcode | Tissue | Histology | Sex | Age | Stage | Therapy Types | Drugs | Outcome |
| TRAM2 | SNV | Missense_Mutation | novel | c.951C>G | p.His317Gln | p.H317Q | Q15035 | protein_coding | tolerated(0.07) | benign(0.026) | TCGA-AC-A2BK-01 | Breast | breast invasive carcinoma | Female | >=65 | III/IV | Chemotherapy | cytoxan | CR |
| TRAM2 | SNV | Missense_Mutation | novel | c.763A>C | p.Thr255Pro | p.T255P | Q15035 | protein_coding | tolerated(0.21) | probably_damaging(0.982) | TCGA-BH-A0HL-01 | Breast | breast invasive carcinoma | Female | <65 | I/II | Chemotherapy | cyclophosphamide | SD |
| TRAM2 | SNV | Missense_Mutation | rs754282909 | c.307C>T | p.Arg103Trp | p.R103W | Q15035 | protein_coding | deleterious(0) | probably_damaging(1) | TCGA-E2-A154-01 | Breast | breast invasive carcinoma | Female | >=65 | I/II | Hormone Therapy | arimidex | SD |
| TRAM2 | insertion | In_Frame_Ins | novel | c.325_326insACAATTTTCCCC | p.Val109delinsAspAsnPheProLeu | p.V109delinsDNFPL | Q15035 | protein_coding | TCGA-A7-A0CJ-01 | Breast | breast invasive carcinoma | Female | <65 | I/II | Chemotherapy | cytoxan | SD | ||
| TRAM2 | insertion | Frame_Shift_Ins | novel | c.323_324insTGCCGTTTCAACAAATGCCTGCAGGACC | p.Lys108AsnfsTer18 | p.K108Nfs*18 | Q15035 | protein_coding | TCGA-A7-A0CJ-01 | Breast | breast invasive carcinoma | Female | <65 | I/II | Chemotherapy | cytoxan | SD | ||
| TRAM2 | insertion | Nonsense_Mutation | novel | c.121_122insACTGTTGTTAAGGAGG | p.Val41AspfsTer4 | p.V41Dfs*4 | Q15035 | protein_coding | TCGA-A7-A0CJ-01 | Breast | breast invasive carcinoma | Female | <65 | I/II | Chemotherapy | cytoxan | SD | ||
| TRAM2 | insertion | Frame_Shift_Ins | novel | c.306_307insGAGTTCCAAGCTCAAATTTTGCAGTATGCCTGTGGTTC | p.Arg103GlufsTer39 | p.R103Efs*39 | Q15035 | protein_coding | TCGA-BH-A0E7-01 | Breast | breast invasive carcinoma | Female | >=65 | I/II | Hormone Therapy | arimidex | SD | ||
| TRAM2 | deletion | Frame_Shift_Del | novel | c.683delN | p.Phe228SerfsTer127 | p.F228Sfs*127 | Q15035 | protein_coding | TCGA-D8-A27V-01 | Breast | breast invasive carcinoma | Female | <65 | I/II | Hormone Therapy | tamoxiphen | SD | ||
| TRAM2 | SNV | Missense_Mutation | novel | c.57N>G | p.Ile19Met | p.I19M | Q15035 | protein_coding | deleterious(0) | probably_damaging(0.986) | TCGA-VS-A953-01 | Cervix | cervical & endocervical cancer | Female | <65 | I/II | Unknown | Unknown | PD |
| TRAM2 | SNV | Missense_Mutation | c.950N>G | p.His317Arg | p.H317R | Q15035 | protein_coding | tolerated(1) | benign(0) | TCGA-F4-6461-01 | Colorectum | colon adenocarcinoma | Female | <65 | III/IV | Unknown | Unknown | PD |
| Page: 1 2 3 4 5 |
Top |
Related drugs of malignant transformation related genes |
| Identification of chemicals and drugs interact with genes involved in malignant transfromation |
| (DGIdb 4.0) |
| Entrez ID | Symbol | Category | Interaction Types | Drug Claim Name | Drug Name | PMIDs |
| Page: 1 |

Copyright 2023-Present -The University of Texas Health Science Center at Houston |