
|
|||||
|
 | |
| |
| |
| |
| |
| |
|
Gene: TRAM1 |
Gene summary for TRAM1 |
| Gene information | Species | Human | Gene symbol | TRAM1 | Gene ID | 23471 |
| Gene name | translocation associated membrane protein 1 | |
| Gene Alias | PNAS8 | |
| Cytomap | 8q13.3 | |
| Gene Type | protein-coding | GO ID | GO:0006605 | UniProtAcc | Q15629 |
Top |
Malignant transformation analysis |
| Identification of the aberrant gene expression in precancerous and cancerous lesions by comparing the gene expression of stem-like cells in diseased tissues with normal stem cells |
| Entrez ID | Symbol | Replicates | Species | Organ | Tissue | Adj P-value | Log2FC | Malignancy |
| 23471 | TRAM1 | AEH-subject1 | Human | Endometrium | AEH | 1.03e-07 | -3.41e-01 | -0.3059 |
| 23471 | TRAM1 | AEH-subject2 | Human | Endometrium | AEH | 8.91e-07 | -3.52e-01 | -0.2525 |
| 23471 | TRAM1 | AEH-subject3 | Human | Endometrium | AEH | 2.71e-04 | -2.88e-01 | -0.2576 |
| 23471 | TRAM1 | AEH-subject4 | Human | Endometrium | AEH | 7.48e-03 | -2.29e-01 | -0.2657 |
| 23471 | TRAM1 | AEH-subject5 | Human | Endometrium | AEH | 2.94e-02 | -3.13e-01 | -0.2953 |
| 23471 | TRAM1 | EEC-subject1 | Human | Endometrium | EEC | 5.97e-06 | -3.25e-01 | -0.2682 |
| 23471 | TRAM1 | EEC-subject2 | Human | Endometrium | EEC | 3.79e-10 | -4.41e-01 | -0.2607 |
| 23471 | TRAM1 | EEC-subject3 | Human | Endometrium | EEC | 5.81e-25 | -3.39e-01 | -0.2525 |
| 23471 | TRAM1 | GSM6177620_NYU_UCEC1_lib1_lib1 | Human | Endometrium | EEC | 2.80e-22 | -1.84e-01 | -0.1869 |
| 23471 | TRAM1 | GSM6177620_NYU_UCEC1_lib2_lib2 | Human | Endometrium | EEC | 2.85e-23 | -1.36e-01 | -0.1875 |
| 23471 | TRAM1 | GSM6177620_NYU_UCEC1_lib3_lib3 | Human | Endometrium | EEC | 4.11e-30 | -1.62e-01 | -0.1883 |
| 23471 | TRAM1 | GSM6177621_NYU_UCEC2_lib1_lib1 | Human | Endometrium | EEC | 2.86e-34 | 3.48e-01 | -0.1934 |
| 23471 | TRAM1 | GSM6177622_NYU_UCEC3_lib1_lib1 | Human | Endometrium | EEC | 7.86e-40 | -1.88e-01 | -0.1917 |
| 23471 | TRAM1 | GSM6177622_NYU_UCEC3_lib2_lib2 | Human | Endometrium | EEC | 3.42e-36 | -1.83e-01 | -0.1916 |
| 23471 | TRAM1 | GSM6177623_NYU_UCEC3_Vis | Human | Endometrium | EEC | 7.89e-03 | -1.18e-01 | -0.1269 |
| 23471 | TRAM1 | LZE2D | Human | Esophagus | HGIN | 7.02e-03 | 1.23e-01 | 0.0642 |
| 23471 | TRAM1 | LZE2T | Human | Esophagus | ESCC | 3.03e-04 | 4.68e-01 | 0.082 |
| 23471 | TRAM1 | LZE3D | Human | Esophagus | HGIN | 6.71e-03 | 3.69e-01 | 0.0668 |
| 23471 | TRAM1 | LZE4T | Human | Esophagus | ESCC | 1.59e-28 | 8.43e-01 | 0.0811 |
| 23471 | TRAM1 | LZE7T | Human | Esophagus | ESCC | 3.18e-03 | 3.63e-01 | 0.0667 |
| Page: 1 2 3 4 5 6 7 8 9 10 |
| Tissue | Expression Dynamics | Abbreviation |
| Endometrium | 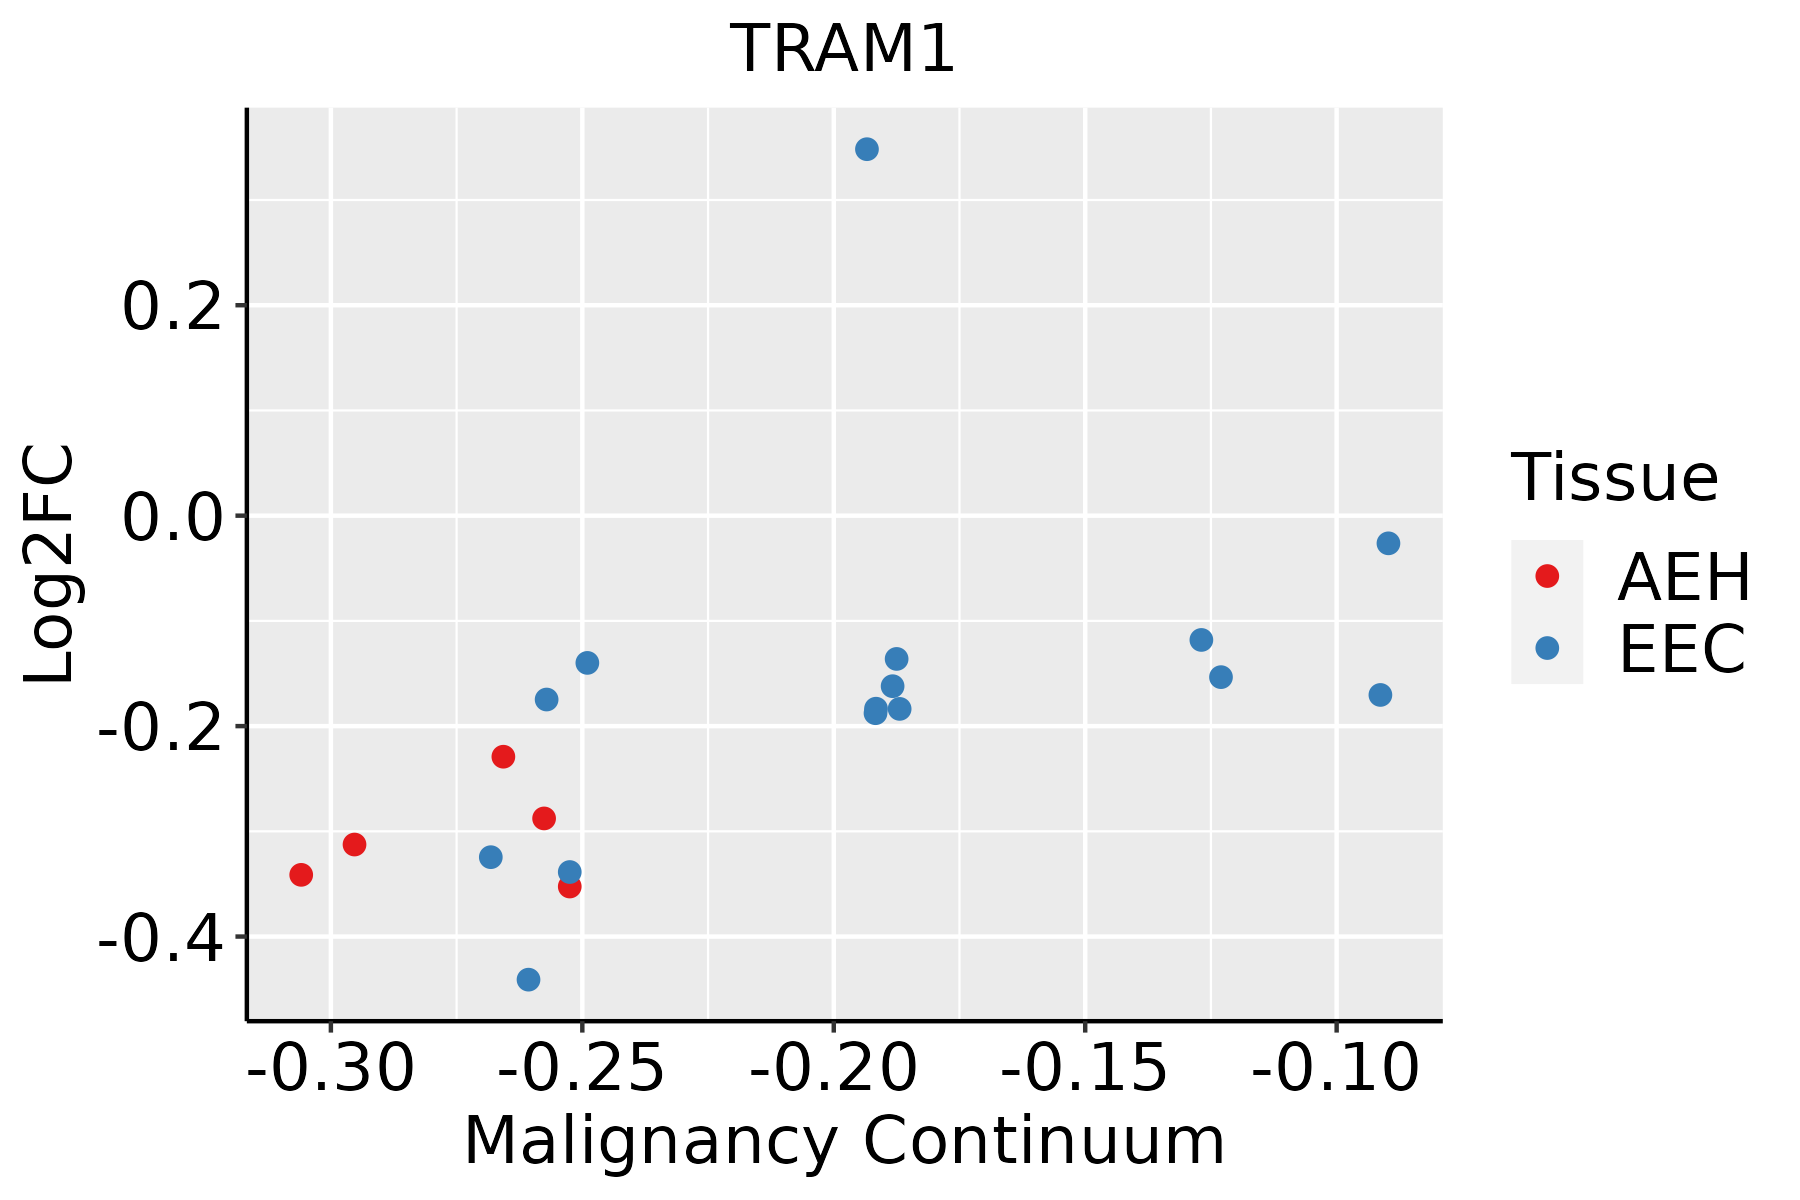 | AEH: Atypical endometrial hyperplasia |
| EEC: Endometrioid Cancer | ||
| Esophagus |  | ESCC: Esophageal squamous cell carcinoma |
| HGIN: High-grade intraepithelial neoplasias | ||
| LGIN: Low-grade intraepithelial neoplasias | ||
| Liver | 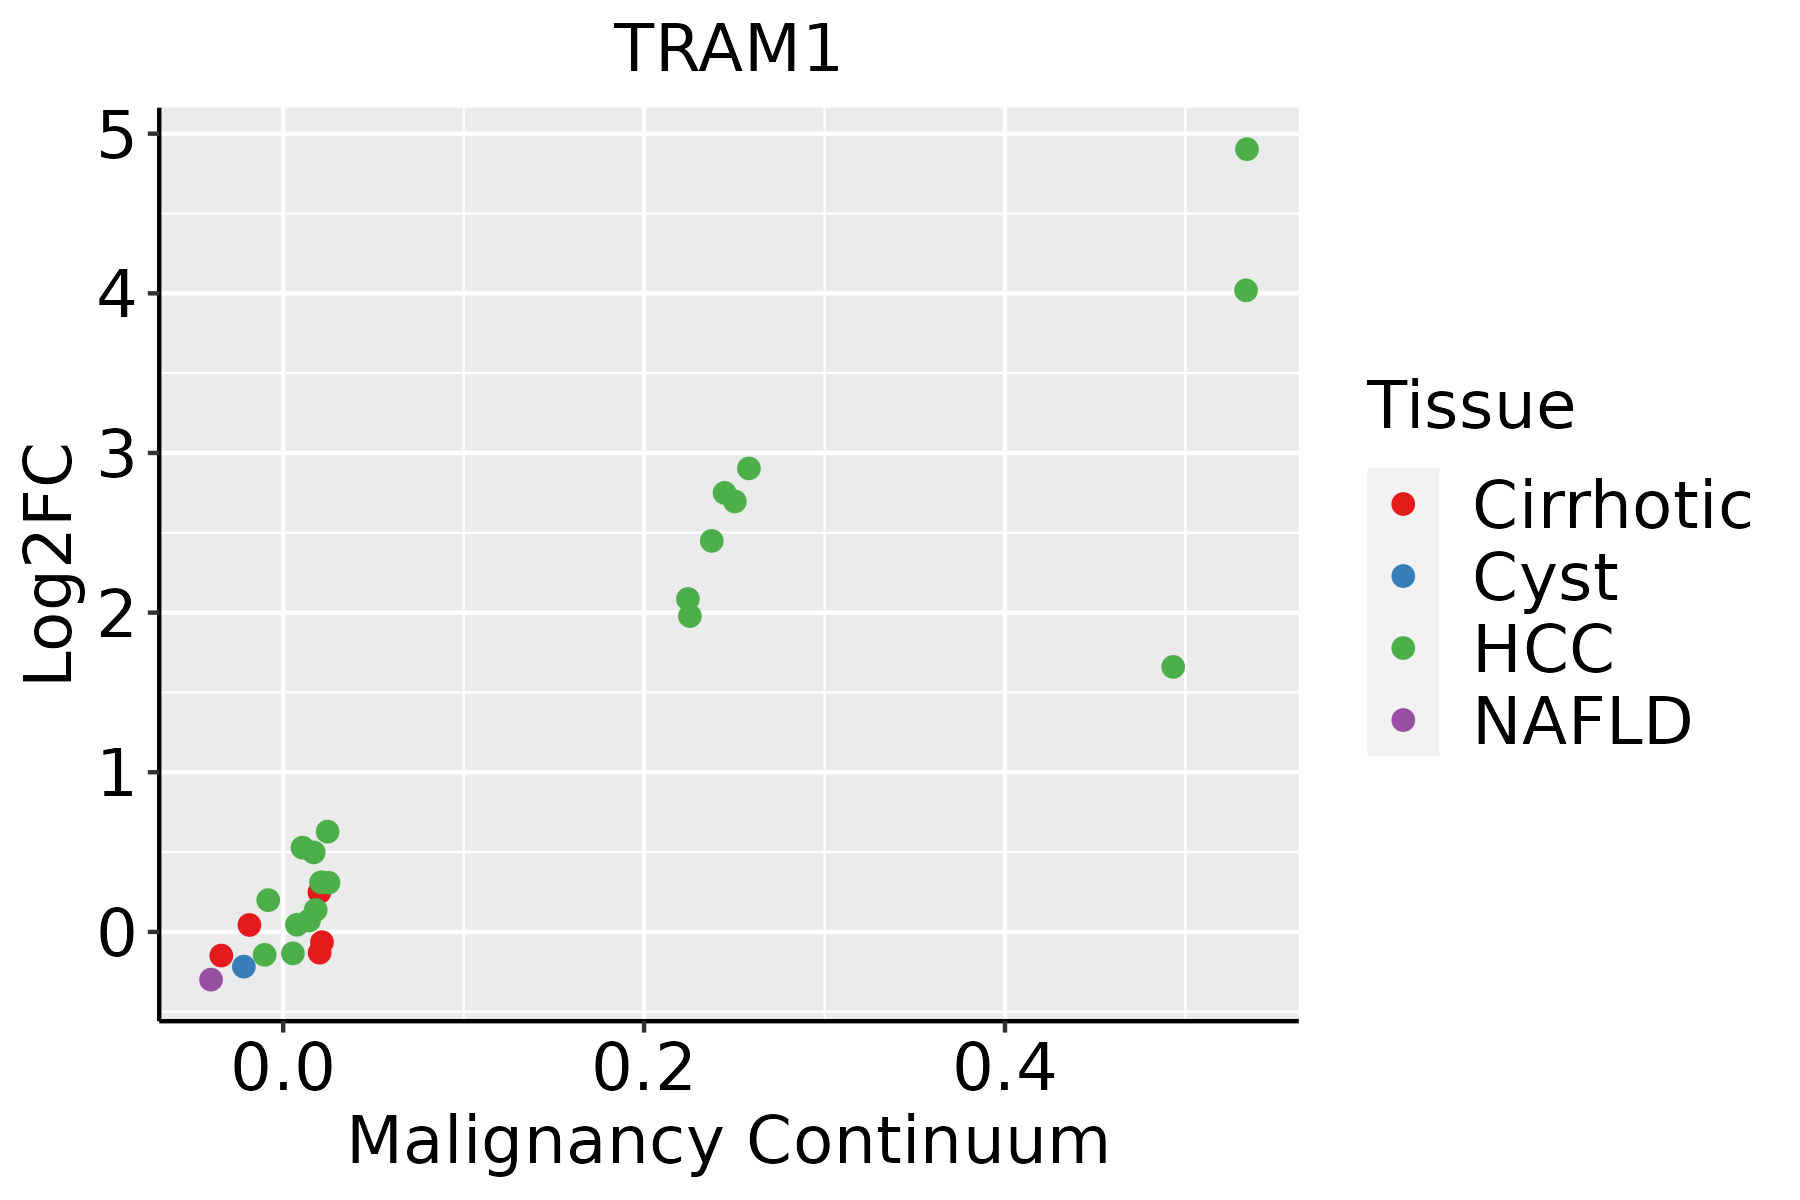 | HCC: Hepatocellular carcinoma |
| NAFLD: Non-alcoholic fatty liver disease | ||
| Lung | 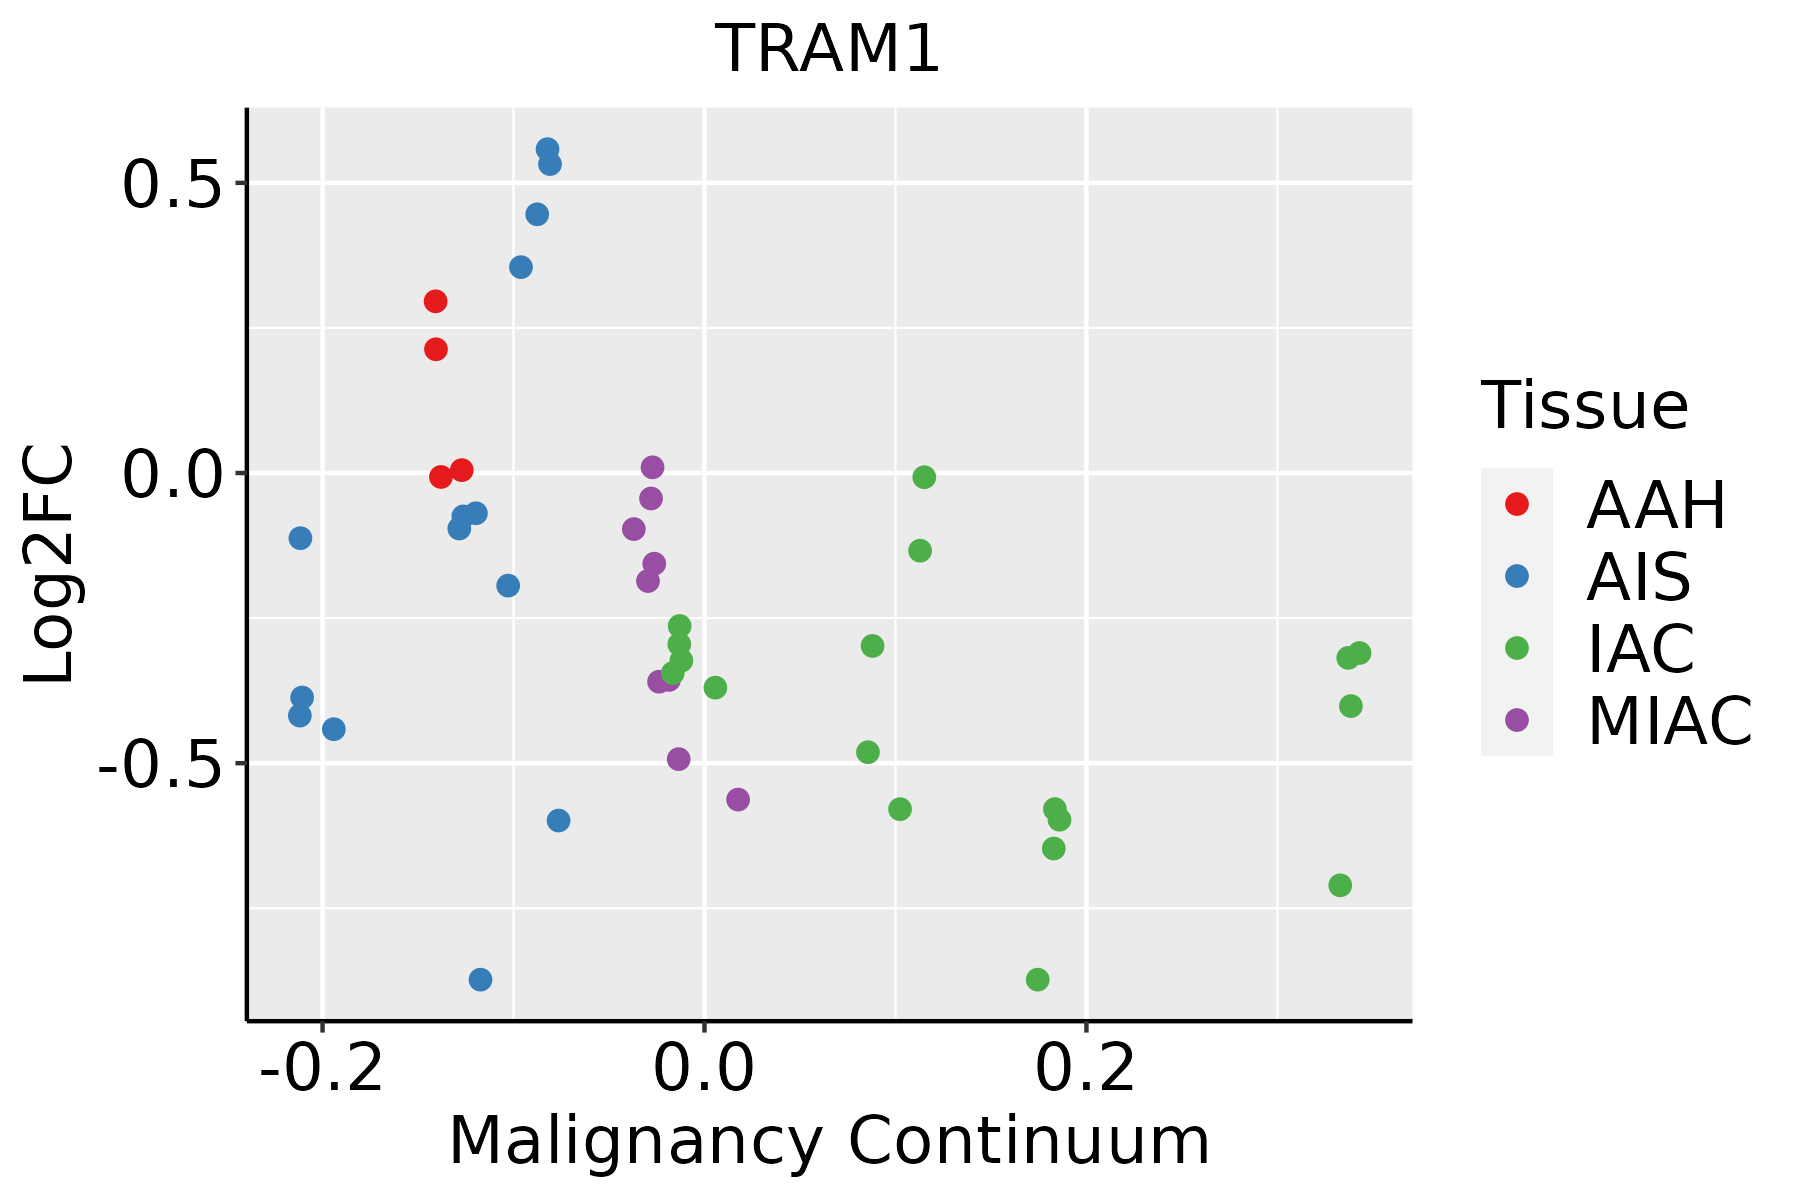 | AAH: Atypical adenomatous hyperplasia |
| AIS: Adenocarcinoma in situ | ||
| IAC: Invasive lung adenocarcinoma | ||
| MIA: Minimally invasive adenocarcinoma | ||
| Oral Cavity | 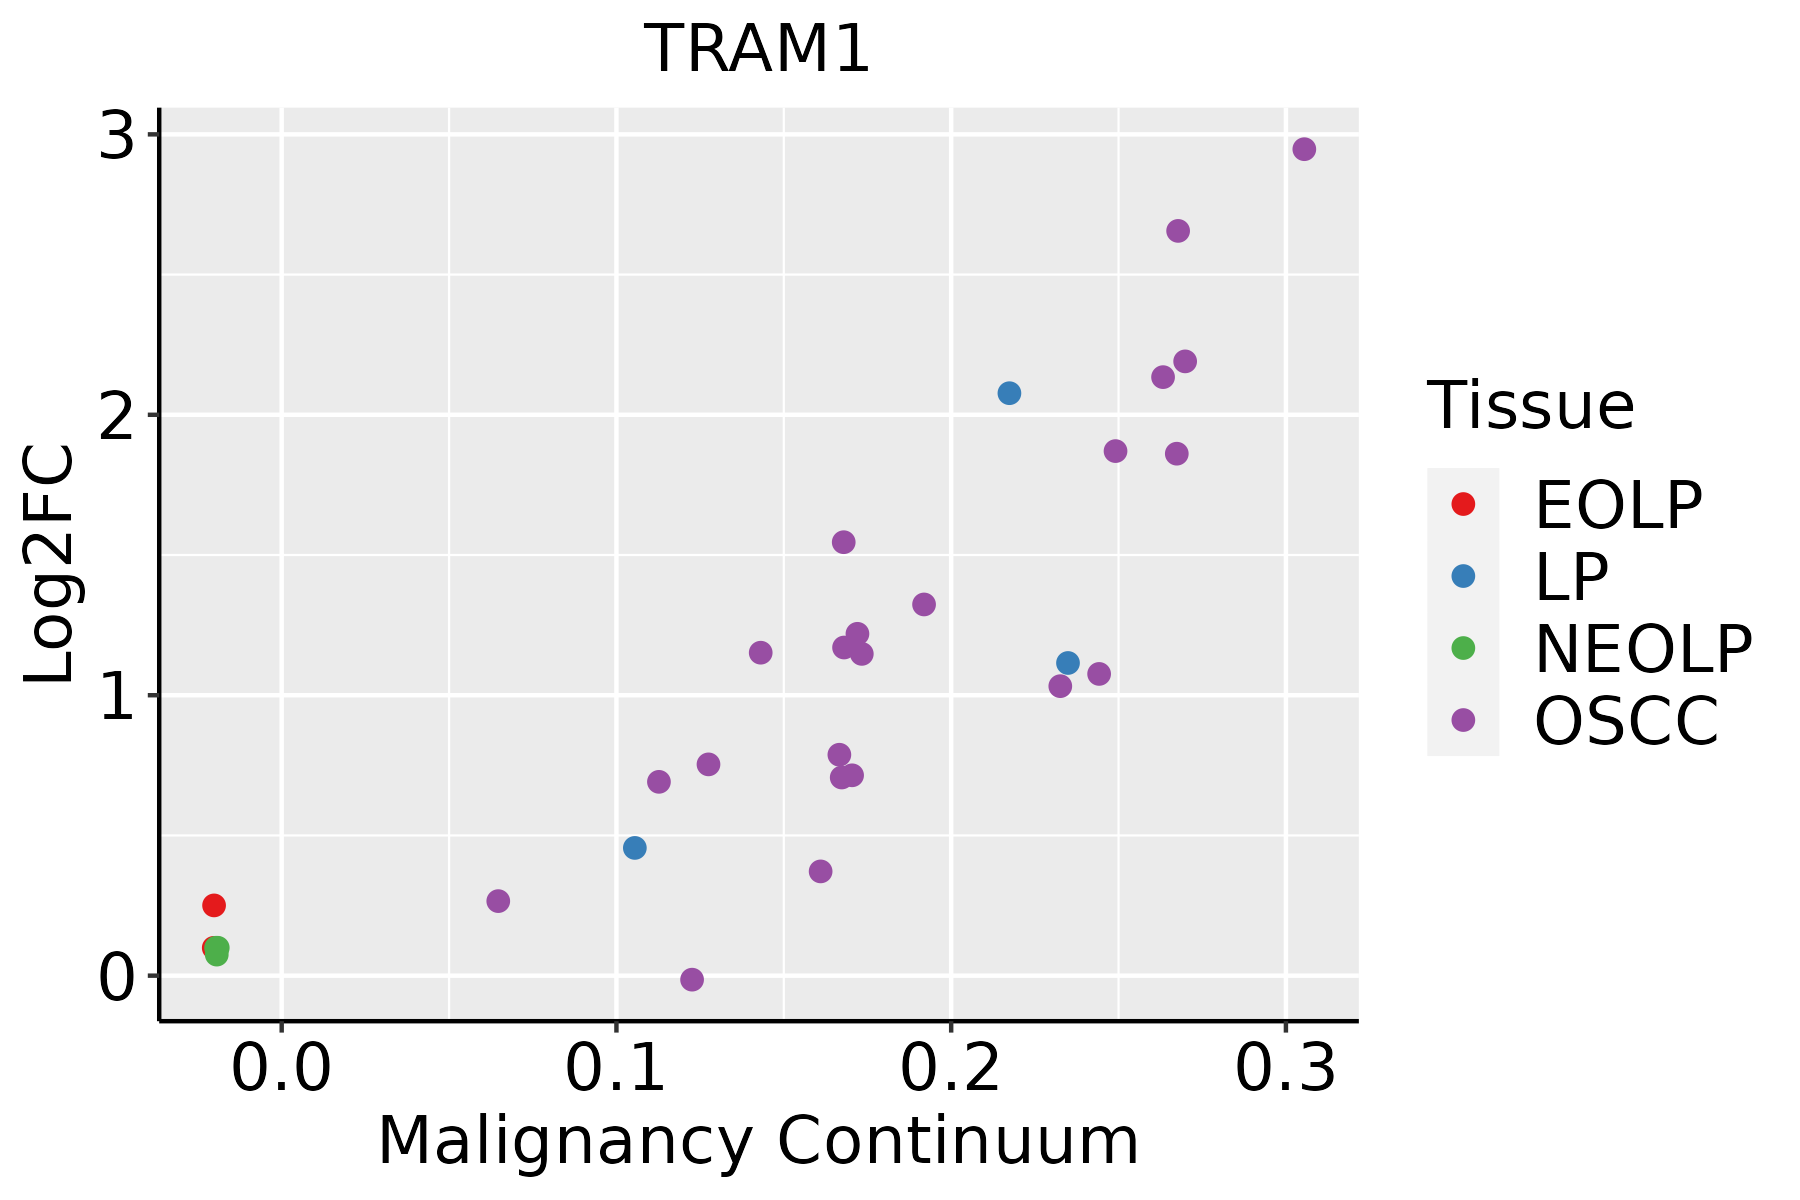 | EOLP: Erosive Oral lichen planus |
| LP: leukoplakia | ||
| NEOLP: Non-erosive oral lichen planus | ||
| OSCC: Oral squamous cell carcinoma | ||
| Prostate | 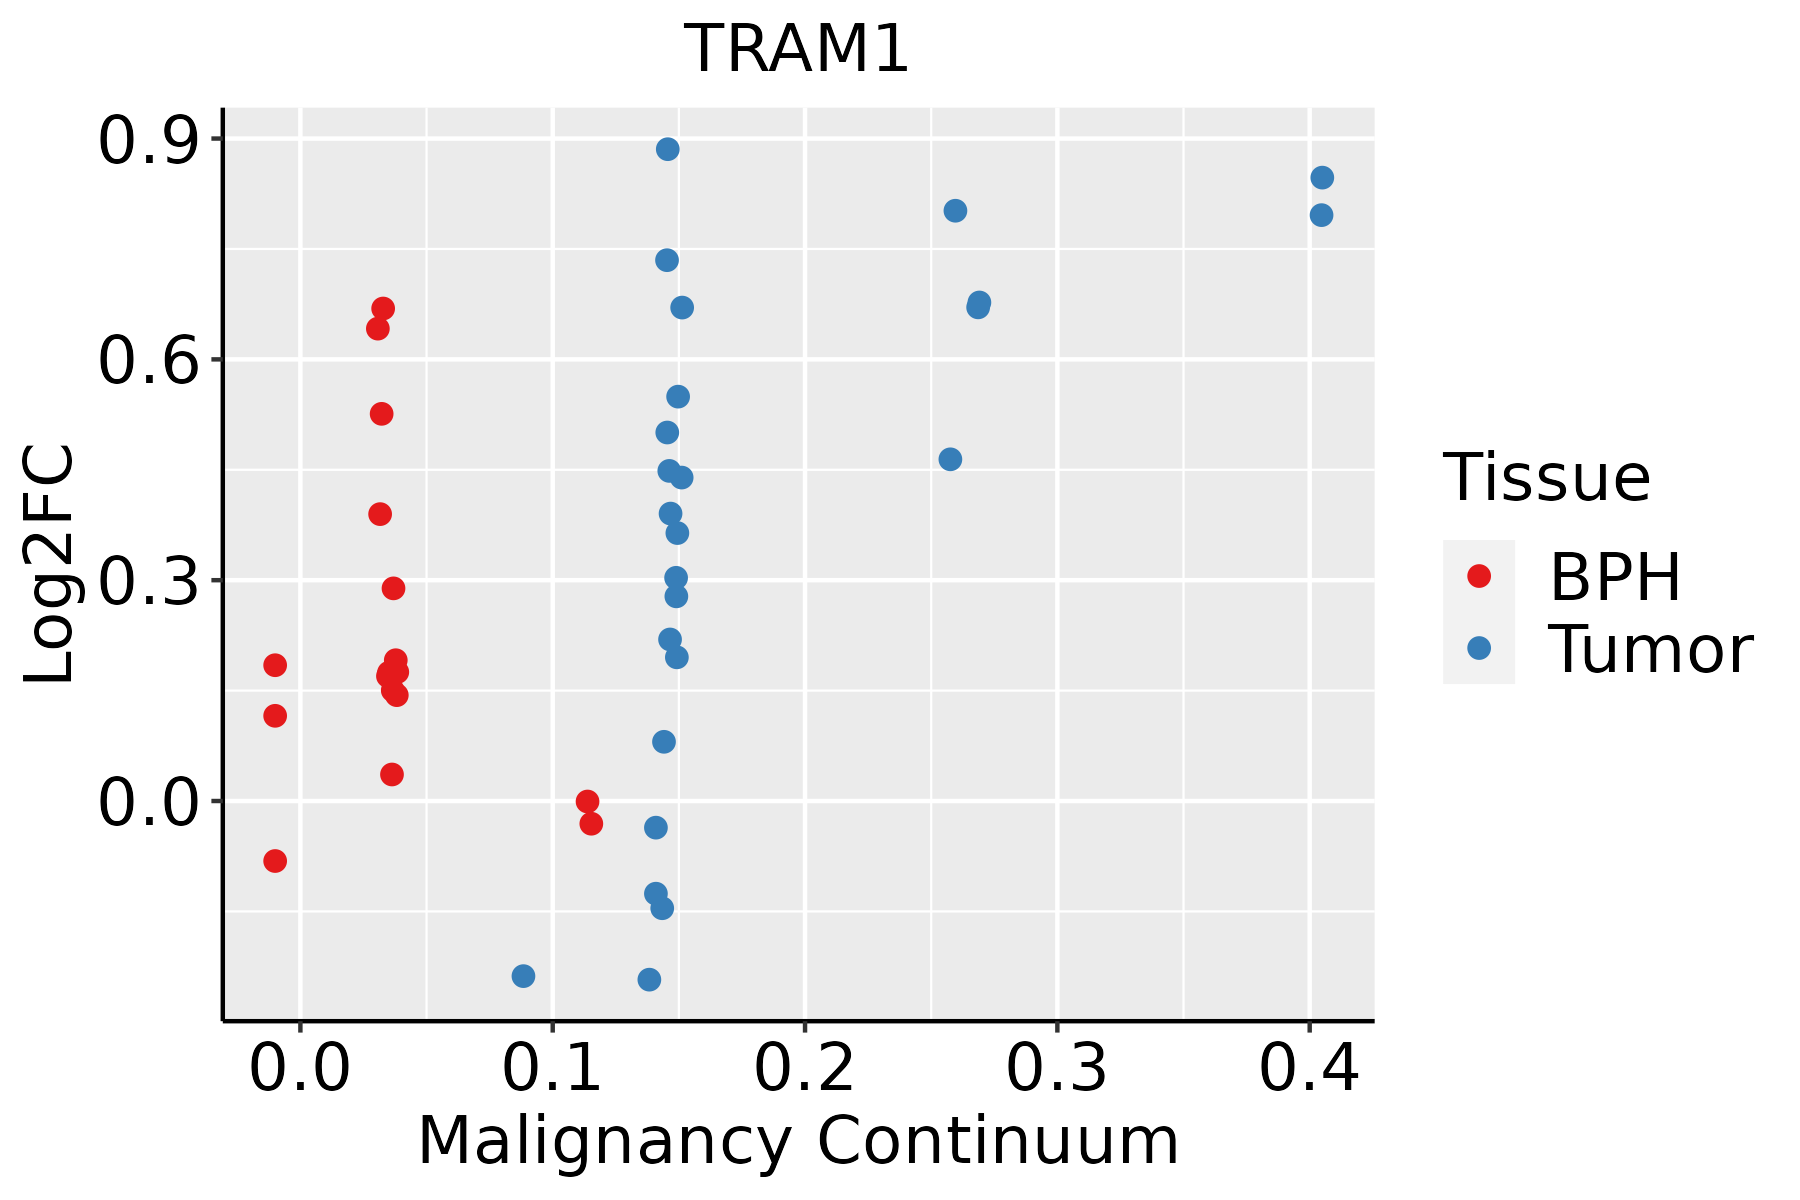 | BPH: Benign Prostatic Hyperplasia |
| Skin | 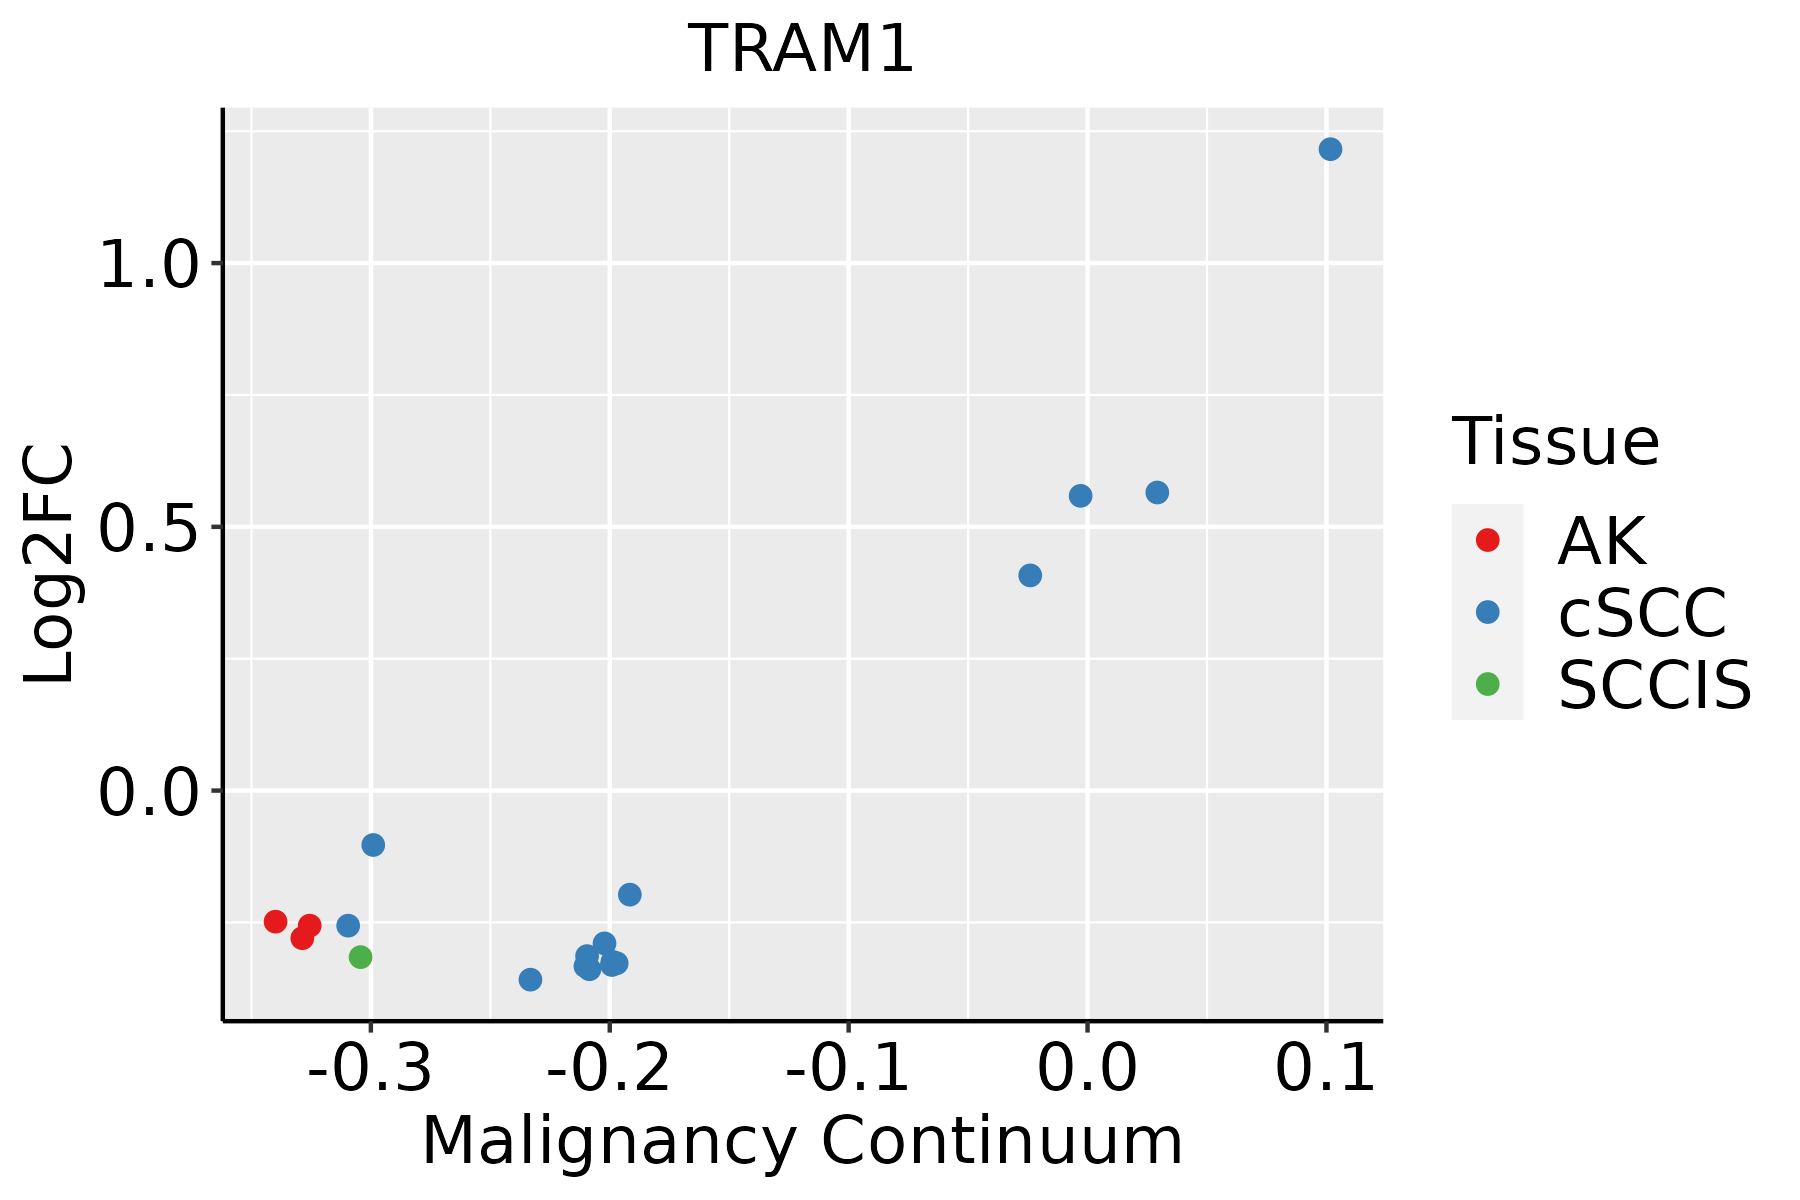 | AK: Actinic keratosis |
| cSCC: Cutaneous squamous cell carcinoma | ||
| SCCIS:squamous cell carcinoma in situ | ||
| Thyroid | 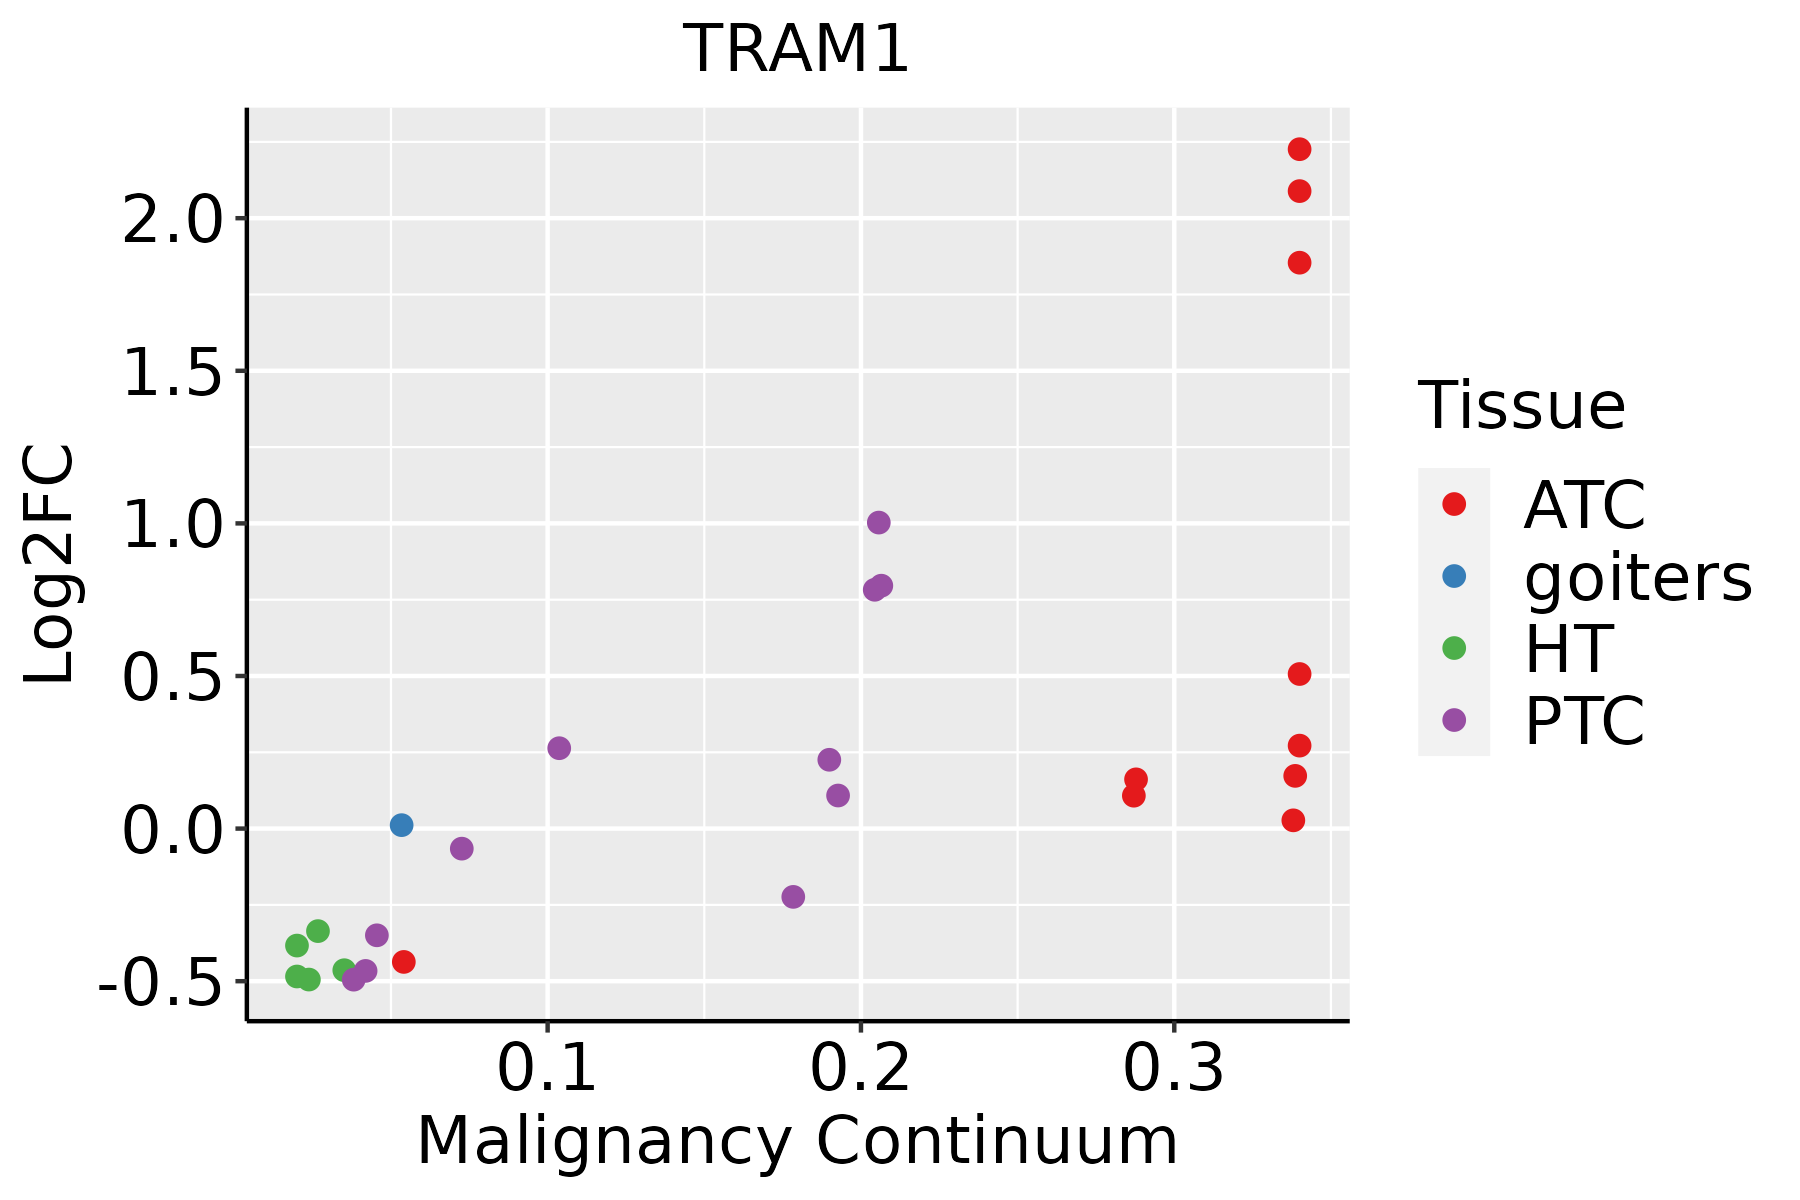 | ATC: Anaplastic thyroid cancer |
| HT: Hashimoto's thyroiditis | ||
| PTC: Papillary thyroid cancer |
| ∗log2FC in expression of this searched gene in stem-like cells from each diseased tissue sample relative to stem-like cells in normal samples in each tissue plotted against the malignancy continuum. Samples are colored based on if they are from different disease stage. |
Top |
Malignant transformation related pathway analysis |
| Find out the enriched GO biological processes and KEGG pathways involved in transition from healthy to precancer to cancer |
| Tissue | Disease Stage | Enriched GO biological Processes |
| Colorectum | AD |  |
| Colorectum | SER |  |
| Colorectum | MSS |  |
| Colorectum | MSI-H |  |
| Colorectum | FAP |  |
| ∗Top 15 enriched GO BP terms are showed in the bar plot of each disease state in each tissue. Each row represents a significant GO biological process which is colored according to the -log10(p.adjust). |
| Page: 1 2 3 4 5 6 7 8 9 |
| GO ID | Tissue | Disease Stage | Description | Gene Ratio | Bg Ratio | pvalue | p.adjust | Count |
| GO:007259410 | Endometrium | AEH | establishment of protein localization to organelle | 89/2100 | 422/18723 | 2.41e-09 | 1.90e-07 | 89 |
| GO:000660516 | Endometrium | AEH | protein targeting | 68/2100 | 314/18723 | 6.30e-08 | 3.38e-06 | 68 |
| GO:003596616 | Endometrium | AEH | response to topologically incorrect protein | 39/2100 | 159/18723 | 1.69e-06 | 5.23e-05 | 39 |
| GO:000698616 | Endometrium | AEH | response to unfolded protein | 35/2100 | 137/18723 | 2.09e-06 | 6.28e-05 | 35 |
| GO:00709727 | Endometrium | AEH | protein localization to endoplasmic reticulum | 23/2100 | 74/18723 | 3.44e-06 | 9.24e-05 | 23 |
| GO:009015010 | Endometrium | AEH | establishment of protein localization to membrane | 51/2100 | 260/18723 | 4.74e-05 | 7.85e-04 | 51 |
| GO:00450475 | Endometrium | AEH | protein targeting to ER | 12/2100 | 42/18723 | 1.70e-03 | 1.37e-02 | 12 |
| GO:00512054 | Endometrium | AEH | protein insertion into membrane | 14/2100 | 57/18723 | 3.48e-03 | 2.39e-02 | 14 |
| GO:00725996 | Endometrium | AEH | establishment of protein localization to endoplasmic reticulum | 12/2100 | 46/18723 | 3.91e-03 | 2.64e-02 | 12 |
| GO:00718066 | Endometrium | AEH | protein transmembrane transport | 14/2100 | 59/18723 | 4.86e-03 | 3.07e-02 | 14 |
| GO:00066133 | Endometrium | AEH | cotranslational protein targeting to membrane | 9/2100 | 31/18723 | 5.59e-03 | 3.44e-02 | 9 |
| GO:007259415 | Endometrium | EEC | establishment of protein localization to organelle | 94/2168 | 422/18723 | 2.22e-10 | 2.51e-08 | 94 |
| GO:000660517 | Endometrium | EEC | protein targeting | 69/2168 | 314/18723 | 9.61e-08 | 4.69e-06 | 69 |
| GO:003596617 | Endometrium | EEC | response to topologically incorrect protein | 41/2168 | 159/18723 | 5.20e-07 | 2.00e-05 | 41 |
| GO:000698617 | Endometrium | EEC | response to unfolded protein | 37/2168 | 137/18723 | 5.40e-07 | 2.04e-05 | 37 |
| GO:007097215 | Endometrium | EEC | protein localization to endoplasmic reticulum | 24/2168 | 74/18723 | 1.59e-06 | 4.96e-05 | 24 |
| GO:009015015 | Endometrium | EEC | establishment of protein localization to membrane | 52/2168 | 260/18723 | 5.46e-05 | 8.64e-04 | 52 |
| GO:004504712 | Endometrium | EEC | protein targeting to ER | 13/2168 | 42/18723 | 6.46e-04 | 6.31e-03 | 13 |
| GO:007259912 | Endometrium | EEC | establishment of protein localization to endoplasmic reticulum | 13/2168 | 46/18723 | 1.65e-03 | 1.29e-02 | 13 |
| GO:000661311 | Endometrium | EEC | cotranslational protein targeting to membrane | 10/2168 | 31/18723 | 1.89e-03 | 1.45e-02 | 10 |
| Page: 1 2 3 4 5 6 7 8 9 10 11 |
| Pathway ID | Tissue | Disease Stage | Description | Gene Ratio | Bg Ratio | pvalue | p.adjust | qvalue | Count |
| hsa0414126 | Endometrium | AEH | Protein processing in endoplasmic reticulum | 62/1197 | 174/8465 | 5.97e-13 | 1.39e-11 | 1.01e-11 | 62 |
| hsa04141111 | Endometrium | AEH | Protein processing in endoplasmic reticulum | 62/1197 | 174/8465 | 5.97e-13 | 1.39e-11 | 1.01e-11 | 62 |
| hsa0414127 | Endometrium | EEC | Protein processing in endoplasmic reticulum | 64/1237 | 174/8465 | 2.17e-13 | 5.09e-12 | 3.80e-12 | 64 |
| hsa0414136 | Endometrium | EEC | Protein processing in endoplasmic reticulum | 64/1237 | 174/8465 | 2.17e-13 | 5.09e-12 | 3.80e-12 | 64 |
| hsa0414139 | Esophagus | HGIN | Protein processing in endoplasmic reticulum | 67/1383 | 174/8465 | 1.06e-12 | 2.16e-11 | 1.72e-11 | 67 |
| hsa04141114 | Esophagus | HGIN | Protein processing in endoplasmic reticulum | 67/1383 | 174/8465 | 1.06e-12 | 2.16e-11 | 1.72e-11 | 67 |
| hsa04141211 | Esophagus | ESCC | Protein processing in endoplasmic reticulum | 147/4205 | 174/8465 | 3.29e-22 | 1.10e-19 | 5.64e-20 | 147 |
| hsa04141310 | Esophagus | ESCC | Protein processing in endoplasmic reticulum | 147/4205 | 174/8465 | 3.29e-22 | 1.10e-19 | 5.64e-20 | 147 |
| hsa0414114 | Liver | Cirrhotic | Protein processing in endoplasmic reticulum | 114/2530 | 174/8465 | 1.16e-22 | 9.67e-21 | 5.96e-21 | 114 |
| hsa0414115 | Liver | Cirrhotic | Protein processing in endoplasmic reticulum | 114/2530 | 174/8465 | 1.16e-22 | 9.67e-21 | 5.96e-21 | 114 |
| hsa0414122 | Liver | HCC | Protein processing in endoplasmic reticulum | 146/4020 | 174/8465 | 7.34e-24 | 2.46e-21 | 1.37e-21 | 146 |
| hsa0414132 | Liver | HCC | Protein processing in endoplasmic reticulum | 146/4020 | 174/8465 | 7.34e-24 | 2.46e-21 | 1.37e-21 | 146 |
| hsa0414116 | Lung | IAC | Protein processing in endoplasmic reticulum | 37/1053 | 174/8465 | 6.53e-04 | 5.73e-03 | 3.81e-03 | 37 |
| hsa0414117 | Lung | IAC | Protein processing in endoplasmic reticulum | 37/1053 | 174/8465 | 6.53e-04 | 5.73e-03 | 3.81e-03 | 37 |
| hsa0414123 | Lung | AIS | Protein processing in endoplasmic reticulum | 35/961 | 174/8465 | 4.88e-04 | 4.39e-03 | 2.81e-03 | 35 |
| hsa0414133 | Lung | AIS | Protein processing in endoplasmic reticulum | 35/961 | 174/8465 | 4.88e-04 | 4.39e-03 | 2.81e-03 | 35 |
| hsa0414130 | Oral cavity | OSCC | Protein processing in endoplasmic reticulum | 143/3704 | 174/8465 | 6.82e-26 | 2.28e-23 | 1.16e-23 | 143 |
| hsa04141113 | Oral cavity | OSCC | Protein processing in endoplasmic reticulum | 143/3704 | 174/8465 | 6.82e-26 | 2.28e-23 | 1.16e-23 | 143 |
| hsa04141210 | Oral cavity | LP | Protein processing in endoplasmic reticulum | 113/2418 | 174/8465 | 8.74e-24 | 5.82e-22 | 3.76e-22 | 113 |
| hsa0414138 | Oral cavity | LP | Protein processing in endoplasmic reticulum | 113/2418 | 174/8465 | 8.74e-24 | 5.82e-22 | 3.76e-22 | 113 |
| Page: 1 2 |
Top |
Cell-cell communication analysis |
| Identification of potential cell-cell interactions between two cell types and their ligand-receptor pairs for different disease states |
| Ligand | Receptor | LRpair | Pathway | Tissue | Disease Stage |
| Page: 1 |
Top |
Single-cell gene regulatory network inference analysis |
| Find out the significant the regulons (TFs) and the target genes of each regulon across cell types for different disease states |
| TF | Cell Type | Tissue | Disease Stage | Target Gene | RSS | Regulon Activity |
| ∗The dot plots of a searched regulon are shown for all cell subpopulations in each disease state of each tissue based on the regulon specific score inferred using pySCENIC and by calculating the average expression. |
| Page: 1 |
Top |
Somatic mutation of malignant transformation related genes |
| Annotation of somatic variants for genes involved in malignant transformation |
| Hugo Symbol | Variant Class | Variant Classification | dbSNP RS | HGVSc | HGVSp | HGVSp Short | SWISSPROT | BIOTYPE | SIFT | PolyPhen | Tumor Sample Barcode | Tissue | Histology | Sex | Age | Stage | Therapy Types | Drugs | Outcome |
| TRAM1 | SNV | Missense_Mutation | novel | c.235N>T | p.Asp79Tyr | p.D79Y | Q15629 | protein_coding | deleterious(0) | probably_damaging(1) | TCGA-5L-AAT1-01 | Breast | breast invasive carcinoma | Female | <65 | III/IV | Hormone Therapy | letrozol | SD |
| TRAM1 | SNV | Missense_Mutation | c.158N>A | p.Leu53His | p.L53H | Q15629 | protein_coding | deleterious(0.01) | probably_damaging(0.983) | TCGA-B6-A0RE-01 | Breast | breast invasive carcinoma | Female | <65 | I/II | Unknown | Unknown | SD | |
| TRAM1 | SNV | Missense_Mutation | c.945C>G | p.Phe315Leu | p.F315L | Q15629 | protein_coding | tolerated(0.25) | benign(0.01) | TCGA-C5-A1MH-01 | Cervix | cervical & endocervical cancer | Female | >=65 | III/IV | Chemotherapy | cisplatin | PD | |
| TRAM1 | SNV | Missense_Mutation | c.15N>C | p.Lys5Asn | p.K5N | Q15629 | protein_coding | deleterious(0) | possibly_damaging(0.856) | TCGA-IR-A3LA-01 | Cervix | cervical & endocervical cancer | Female | <65 | I/II | Chemotherapy | cisplatin | CR | |
| TRAM1 | SNV | Missense_Mutation | c.723N>A | p.Phe241Leu | p.F241L | Q15629 | protein_coding | deleterious(0.04) | possibly_damaging(0.544) | TCGA-A6-6782-01 | Colorectum | colon adenocarcinoma | Male | >=65 | I/II | Unknown | Unknown | SD | |
| TRAM1 | SNV | Missense_Mutation | c.721N>A | p.Phe241Ile | p.F241I | Q15629 | protein_coding | deleterious(0) | possibly_damaging(0.876) | TCGA-A6-6782-01 | Colorectum | colon adenocarcinoma | Male | >=65 | I/II | Unknown | Unknown | SD | |
| TRAM1 | SNV | Missense_Mutation | c.632N>C | p.Tyr211Ser | p.Y211S | Q15629 | protein_coding | deleterious(0) | probably_damaging(0.993) | TCGA-AA-3713-01 | Colorectum | colon adenocarcinoma | Male | >=65 | III/IV | Chemotherapy | 5-fluorouracil | PR | |
| TRAM1 | SNV | Missense_Mutation | rs766963451 | c.962N>A | p.Arg321Gln | p.R321Q | Q15629 | protein_coding | tolerated(0.39) | benign(0.011) | TCGA-AA-3984-01 | Colorectum | colon adenocarcinoma | Female | <65 | I/II | Unknown | Unknown | SD |
| TRAM1 | SNV | Missense_Mutation | c.750T>G | p.Phe250Leu | p.F250L | Q15629 | protein_coding | tolerated(0.1) | benign(0.046) | TCGA-CM-5341-01 | Colorectum | colon adenocarcinoma | Female | >=65 | III/IV | Chemotherapy | fluorouracil | SD | |
| TRAM1 | SNV | Missense_Mutation | c.581N>A | p.Pro194His | p.P194H | Q15629 | protein_coding | deleterious(0) | probably_damaging(0.954) | TCGA-G4-6586-01 | Colorectum | colon adenocarcinoma | Female | >=65 | I/II | Unknown | Unknown | SD |
| Page: 1 2 3 4 5 |
Top |
Related drugs of malignant transformation related genes |
| Identification of chemicals and drugs interact with genes involved in malignant transfromation |
| (DGIdb 4.0) |
| Entrez ID | Symbol | Category | Interaction Types | Drug Claim Name | Drug Name | PMIDs |
| Page: 1 |

Copyright 2023-Present -The University of Texas Health Science Center at Houston |