
|
|||||
|
 | |
| |
| |
| |
| |
| |
|
Gene: TRAK1 |
Gene summary for TRAK1 |
| Gene information | Species | Human | Gene symbol | TRAK1 | Gene ID | 22906 |
| Gene name | trafficking kinesin protein 1 | |
| Gene Alias | DEE68 | |
| Cytomap | 3p22.1 | |
| Gene Type | protein-coding | GO ID | GO:0000902 | UniProtAcc | A0A024R2M0 |
Top |
Malignant transformation analysis |
| Identification of the aberrant gene expression in precancerous and cancerous lesions by comparing the gene expression of stem-like cells in diseased tissues with normal stem cells |
| Entrez ID | Symbol | Replicates | Species | Organ | Tissue | Adj P-value | Log2FC | Malignancy |
| 22906 | TRAK1 | CCI_1 | Human | Cervix | CC | 5.56e-03 | 3.96e-01 | 0.528 |
| 22906 | TRAK1 | CCI_2 | Human | Cervix | CC | 2.58e-07 | 6.37e-01 | 0.5249 |
| 22906 | TRAK1 | CCI_3 | Human | Cervix | CC | 3.61e-09 | 6.84e-01 | 0.516 |
| 22906 | TRAK1 | HTA11_3410_2000001011 | Human | Colorectum | AD | 2.25e-08 | -2.85e-01 | 0.0155 |
| 22906 | TRAK1 | HTA11_347_2000001011 | Human | Colorectum | AD | 3.66e-08 | 6.01e-01 | -0.1954 |
| 22906 | TRAK1 | HTA11_866_2000001011 | Human | Colorectum | AD | 4.67e-06 | 3.95e-01 | -0.1001 |
| 22906 | TRAK1 | HTA11_1391_2000001011 | Human | Colorectum | AD | 2.00e-03 | 5.77e-01 | -0.059 |
| 22906 | TRAK1 | F007 | Human | Colorectum | FAP | 2.52e-03 | -2.50e-01 | 0.1176 |
| 22906 | TRAK1 | A001-C-207 | Human | Colorectum | FAP | 1.72e-06 | -3.15e-01 | 0.1278 |
| 22906 | TRAK1 | A015-C-203 | Human | Colorectum | FAP | 1.46e-22 | -4.37e-01 | -0.1294 |
| 22906 | TRAK1 | A015-C-204 | Human | Colorectum | FAP | 1.14e-06 | -2.72e-01 | -0.0228 |
| 22906 | TRAK1 | A014-C-040 | Human | Colorectum | FAP | 5.08e-07 | -4.08e-01 | -0.1184 |
| 22906 | TRAK1 | A002-C-201 | Human | Colorectum | FAP | 8.01e-20 | -4.19e-01 | 0.0324 |
| 22906 | TRAK1 | A001-C-119 | Human | Colorectum | FAP | 1.71e-12 | -4.65e-01 | -0.1557 |
| 22906 | TRAK1 | A001-C-108 | Human | Colorectum | FAP | 8.31e-13 | -3.25e-01 | -0.0272 |
| 22906 | TRAK1 | A002-C-205 | Human | Colorectum | FAP | 1.94e-32 | -5.98e-01 | -0.1236 |
| 22906 | TRAK1 | A015-C-005 | Human | Colorectum | FAP | 2.48e-07 | -2.74e-01 | -0.0336 |
| 22906 | TRAK1 | A015-C-006 | Human | Colorectum | FAP | 9.00e-21 | -4.86e-01 | -0.0994 |
| 22906 | TRAK1 | A015-C-106 | Human | Colorectum | FAP | 5.14e-11 | -3.96e-01 | -0.0511 |
| 22906 | TRAK1 | A002-C-114 | Human | Colorectum | FAP | 7.54e-25 | -4.77e-01 | -0.1561 |
| Page: 1 2 3 4 5 6 |
| Tissue | Expression Dynamics | Abbreviation |
| Cervix |  | CC: Cervix cancer |
| HSIL_HPV: HPV-infected high-grade squamous intraepithelial lesions | ||
| N_HPV: HPV-infected normal cervix | ||
| Colorectum (GSE201348) |  | FAP: Familial adenomatous polyposis |
| CRC: Colorectal cancer | ||
| Colorectum (HTA11) |  | AD: Adenomas |
| SER: Sessile serrated lesions | ||
| MSI-H: Microsatellite-high colorectal cancer | ||
| MSS: Microsatellite stable colorectal cancer | ||
| Esophagus |  | ESCC: Esophageal squamous cell carcinoma |
| HGIN: High-grade intraepithelial neoplasias | ||
| LGIN: Low-grade intraepithelial neoplasias | ||
| Liver | 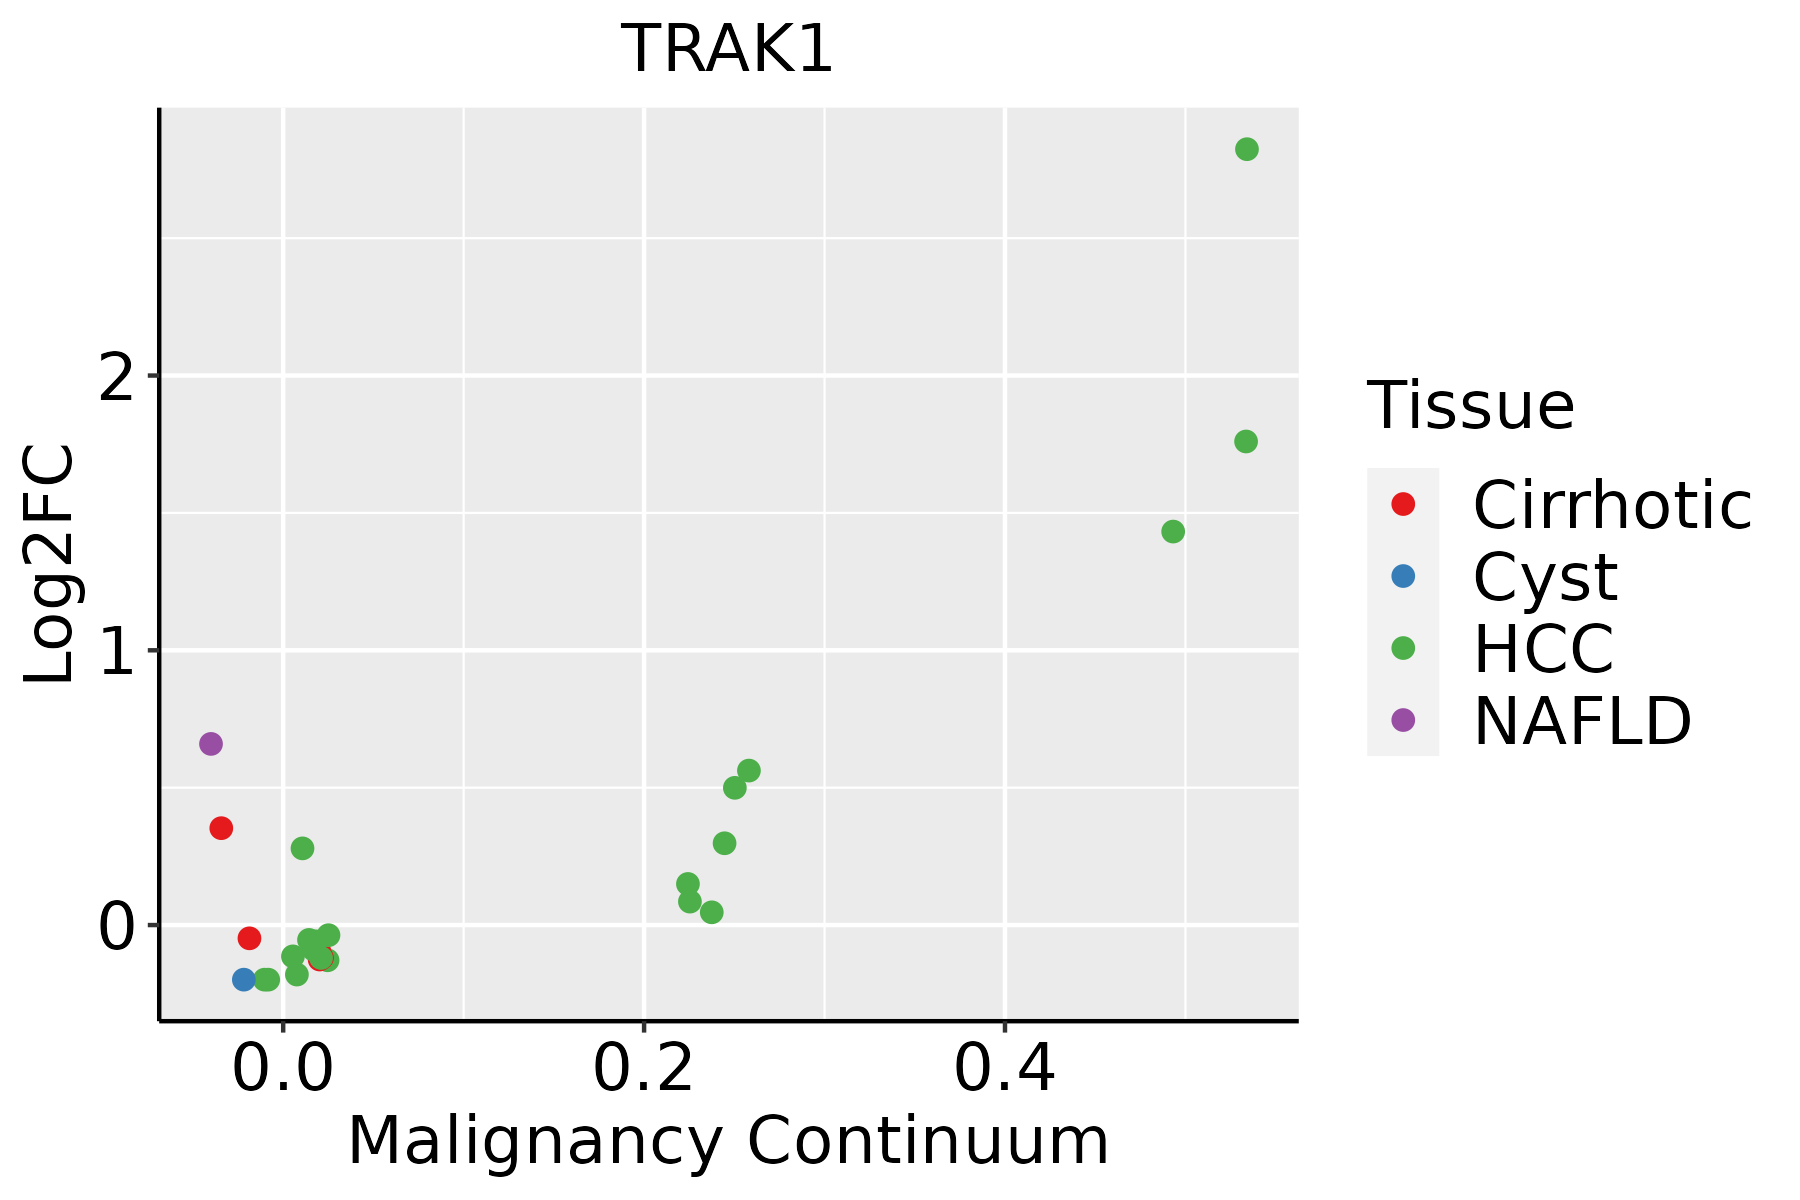 | HCC: Hepatocellular carcinoma |
| NAFLD: Non-alcoholic fatty liver disease | ||
| Prostate | 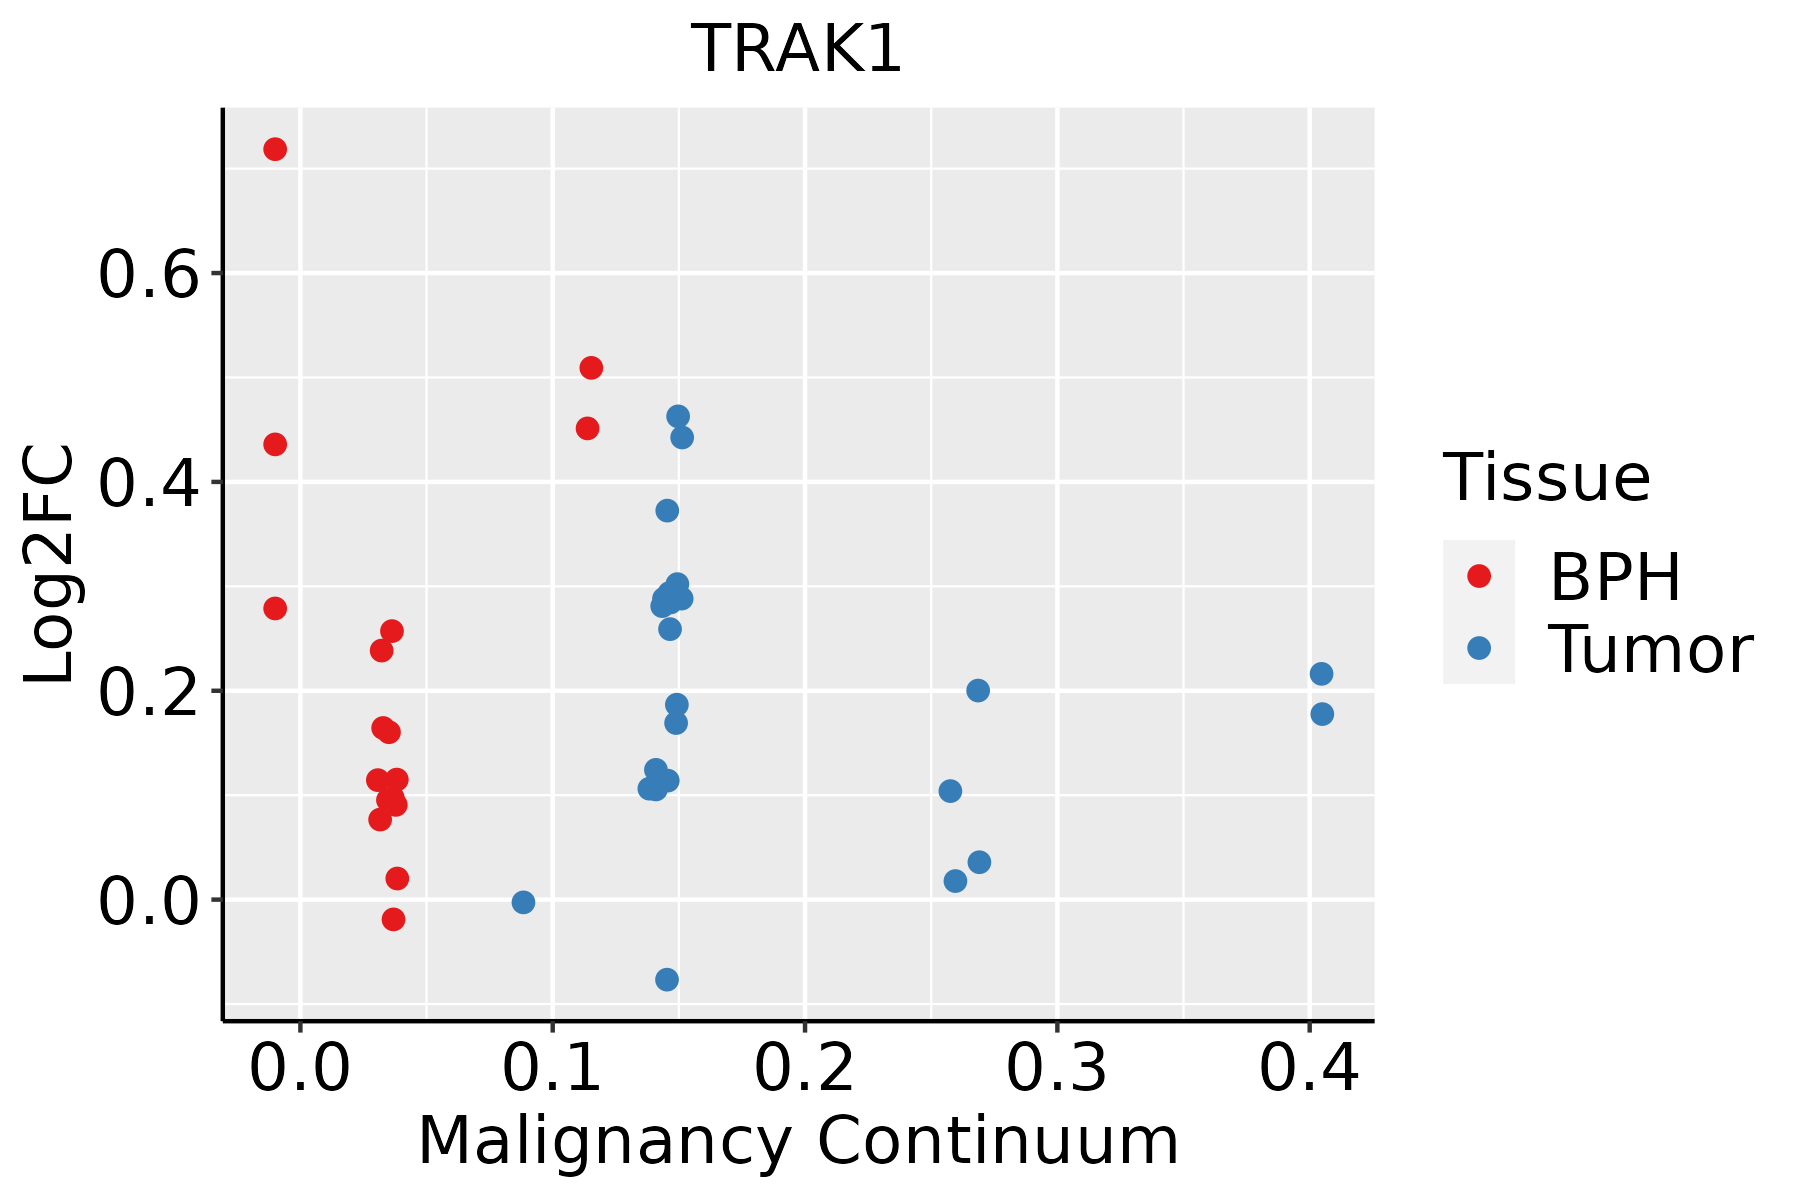 | BPH: Benign Prostatic Hyperplasia |
| ∗log2FC in expression of this searched gene in stem-like cells from each diseased tissue sample relative to stem-like cells in normal samples in each tissue plotted against the malignancy continuum. Samples are colored based on if they are from different disease stage. |
Top |
Malignant transformation related pathway analysis |
| Find out the enriched GO biological processes and KEGG pathways involved in transition from healthy to precancer to cancer |
| Tissue | Disease Stage | Enriched GO biological Processes |
| Colorectum | AD |  |
| Colorectum | SER |  |
| Colorectum | MSS |  |
| Colorectum | MSI-H |  |
| Colorectum | FAP |  |
| ∗Top 15 enriched GO BP terms are showed in the bar plot of each disease state in each tissue. Each row represents a significant GO biological process which is colored according to the -log10(p.adjust). |
| Page: 1 2 3 4 5 6 7 8 9 |
| GO ID | Tissue | Disease Stage | Description | Gene Ratio | Bg Ratio | pvalue | p.adjust | Count |
| GO:00163587 | Cervix | CC | dendrite development | 58/2311 | 243/18723 | 4.52e-07 | 1.76e-05 | 58 |
| GO:000660510 | Cervix | CC | protein targeting | 68/2311 | 314/18723 | 2.17e-06 | 6.55e-05 | 68 |
| GO:00109757 | Cervix | CC | regulation of neuron projection development | 88/2311 | 445/18723 | 4.26e-06 | 1.09e-04 | 88 |
| GO:00107206 | Cervix | CC | positive regulation of cell development | 64/2311 | 298/18723 | 5.69e-06 | 1.41e-04 | 64 |
| GO:00313467 | Cervix | CC | positive regulation of cell projection organization | 72/2311 | 353/18723 | 1.04e-05 | 2.32e-04 | 72 |
| GO:00615647 | Cervix | CC | axon development | 89/2311 | 467/18723 | 1.71e-05 | 3.27e-04 | 89 |
| GO:00516567 | Cervix | CC | establishment of organelle localization | 76/2311 | 390/18723 | 3.17e-05 | 5.21e-04 | 76 |
| GO:00074097 | Cervix | CC | axonogenesis | 78/2311 | 418/18723 | 1.14e-04 | 1.43e-03 | 78 |
| GO:00507705 | Cervix | CC | regulation of axonogenesis | 34/2311 | 154/18723 | 4.87e-04 | 4.76e-03 | 34 |
| GO:00070347 | Cervix | CC | vacuolar transport | 34/2311 | 157/18723 | 7.03e-04 | 6.40e-03 | 34 |
| GO:00307057 | Cervix | CC | cytoskeleton-dependent intracellular transport | 40/2311 | 195/18723 | 7.92e-04 | 6.99e-03 | 40 |
| GO:00519603 | Cervix | CC | regulation of nervous system development | 77/2311 | 443/18723 | 1.13e-03 | 9.30e-03 | 77 |
| GO:00507724 | Cervix | CC | positive regulation of axonogenesis | 20/2311 | 79/18723 | 1.19e-03 | 9.57e-03 | 20 |
| GO:00507676 | Cervix | CC | regulation of neurogenesis | 65/2311 | 364/18723 | 1.33e-03 | 1.05e-02 | 65 |
| GO:00516541 | Cervix | CC | establishment of mitochondrion localization | 10/2311 | 29/18723 | 1.74e-03 | 1.31e-02 | 10 |
| GO:00507694 | Cervix | CC | positive regulation of neurogenesis | 43/2311 | 225/18723 | 2.25e-03 | 1.61e-02 | 43 |
| GO:00488135 | Cervix | CC | dendrite morphogenesis | 30/2311 | 146/18723 | 3.27e-03 | 2.13e-02 | 30 |
| GO:00070416 | Cervix | CC | lysosomal transport | 24/2311 | 114/18723 | 5.81e-03 | 3.33e-02 | 24 |
| GO:00516461 | Cervix | CC | mitochondrion localization | 13/2311 | 50/18723 | 6.42e-03 | 3.58e-02 | 13 |
| GO:00519622 | Cervix | CC | positive regulation of nervous system development | 48/2311 | 272/18723 | 6.60e-03 | 3.65e-02 | 48 |
| Page: 1 2 3 4 5 6 7 8 9 10 11 12 |
| Pathway ID | Tissue | Disease Stage | Description | Gene Ratio | Bg Ratio | pvalue | p.adjust | qvalue | Count |
| Page: 1 |
Top |
Cell-cell communication analysis |
| Identification of potential cell-cell interactions between two cell types and their ligand-receptor pairs for different disease states |
| Ligand | Receptor | LRpair | Pathway | Tissue | Disease Stage |
| Page: 1 |
Top |
Single-cell gene regulatory network inference analysis |
| Find out the significant the regulons (TFs) and the target genes of each regulon across cell types for different disease states |
| TF | Cell Type | Tissue | Disease Stage | Target Gene | RSS | Regulon Activity |
| ∗The dot plots of a searched regulon are shown for all cell subpopulations in each disease state of each tissue based on the regulon specific score inferred using pySCENIC and by calculating the average expression. |
| Page: 1 |
Top |
Somatic mutation of malignant transformation related genes |
| Annotation of somatic variants for genes involved in malignant transformation |
| Hugo Symbol | Variant Class | Variant Classification | dbSNP RS | HGVSc | HGVSp | HGVSp Short | SWISSPROT | BIOTYPE | SIFT | PolyPhen | Tumor Sample Barcode | Tissue | Histology | Sex | Age | Stage | Therapy Types | Drugs | Outcome |
| TRAK1 | SNV | Missense_Mutation | rs756303312 | c.392N>A | p.Arg131His | p.R131H | Q9UPV9 | protein_coding | deleterious(0) | probably_damaging(0.976) | TCGA-A2-A0EO-01 | Breast | breast invasive carcinoma | Female | <65 | I/II | Hormone Therapy | tamoxiphen | SD |
| TRAK1 | SNV | Missense_Mutation | rs766246712 | c.599N>T | p.Ser200Leu | p.S200L | Q9UPV9 | protein_coding | deleterious(0.05) | benign(0.081) | TCGA-E2-A15K-06 | Breast | breast invasive carcinoma | Female | <65 | I/II | Chemotherapy | adriamycin | SD |
| TRAK1 | insertion | Nonsense_Mutation | novel | c.1248_1249insAGTGAAAGACTAACTTGAAGTCTTCCTT | p.Leu418GlufsTer5 | p.L418Efs*5 | Q9UPV9 | protein_coding | TCGA-AO-A0JB-01 | Breast | breast invasive carcinoma | Female | <65 | III/IV | Chemotherapy | cyclophosphamide | SD | ||
| TRAK1 | insertion | Nonsense_Mutation | novel | c.1362_1363insTAAAAACCTTAA | p.Ile454_Gly455insTer | p.I454_G455ins* | Q9UPV9 | protein_coding | TCGA-B6-A0IM-01 | Breast | breast invasive carcinoma | Female | >=65 | I/II | Unknown | Unknown | SD | ||
| TRAK1 | insertion | In_Frame_Ins | novel | c.1363_1364insTACAAATCAGGGTGATTT | p.Gly455delinsValGlnIleArgValIleCys | p.G455delinsVQIRVIC | Q9UPV9 | protein_coding | TCGA-B6-A0IM-01 | Breast | breast invasive carcinoma | Female | >=65 | I/II | Unknown | Unknown | SD | ||
| TRAK1 | deletion | Frame_Shift_Del | novel | c.1530delN | p.Ser511ArgfsTer67 | p.S511Rfs*67 | Q9UPV9 | protein_coding | TCGA-EW-A2FV-01 | Breast | breast invasive carcinoma | Female | <65 | III/IV | Chemotherapy | docetaxel | SD | ||
| TRAK1 | SNV | Missense_Mutation | rs537037086 | c.2240N>A | p.Arg747Gln | p.R747Q | Q9UPV9 | protein_coding | tolerated(0.15) | possibly_damaging(0.522) | TCGA-VS-A94Z-01 | Cervix | cervical & endocervical cancer | Female | <65 | I/II | Chemotherapy | cisplatin | CR |
| TRAK1 | SNV | Missense_Mutation | c.2308N>G | p.Ser770Ala | p.S770A | Q9UPV9 | protein_coding | tolerated(0.86) | benign(0.003) | TCGA-AA-3663-01 | Colorectum | colon adenocarcinoma | Male | <65 | I/II | Unknown | Unknown | SD | |
| TRAK1 | SNV | Missense_Mutation | rs367557305 | c.2120N>T | p.Thr707Met | p.T707M | Q9UPV9 | protein_coding | deleterious(0.01) | probably_damaging(0.993) | TCGA-AA-3947-01 | Colorectum | colon adenocarcinoma | Female | <65 | I/II | Unknown | Unknown | SD |
| TRAK1 | SNV | Missense_Mutation | rs112579771 | c.1672G>A | p.Gly558Ser | p.G558S | Q9UPV9 | protein_coding | tolerated(0.21) | probably_damaging(0.984) | TCGA-AA-3966-01 | Colorectum | colon adenocarcinoma | Female | >=65 | I/II | Unknown | Unknown | SD |
| Page: 1 2 3 4 5 6 7 8 9 10 |
Top |
Related drugs of malignant transformation related genes |
| Identification of chemicals and drugs interact with genes involved in malignant transfromation |
| (DGIdb 4.0) |
| Entrez ID | Symbol | Category | Interaction Types | Drug Claim Name | Drug Name | PMIDs |
| Page: 1 |

Copyright 2023-Present -The University of Texas Health Science Center at Houston |