Schematic overview of the cellular and molecular mechanisms involved in the cancer progression, including the proposed cellular and molecular mechanisms in cancer cells trajectory. AT1: alveolar type 1 cells; AT2: alveolar type 2 cells; AAH: atypical adenomatous hyperplasia; AIS: adenocarcinoma in situ; MIA: minimally invasive adenocarcinoma; IA: invasive adenocarcinoma; EMT: epithelial-mesenchymal transition

Home

Download

Statistics

Help

Contact

Center for Computational Systems Medicine
leaf

Gene summary

leaf

Malignant transformation analysis

leaf

Malignant transformation related pathway analysis

leaf

Cell-cell communication analysis

leaf

Single-cell gene regulatory network inference analysis

leaf

Somatic mutation of malignant transformation related genes

leaf

Related drugs of malignant transformation related genes

Gene: TRAF7

Gene summary for TRAF7

check button Gene summary.

Gene informationSpeciesHuman
Gene symbol

TRAF7

Gene ID

84231

Gene nameTNF receptor associated factor 7
Gene AliasCAFDADD
Cytomap16p13.3
Gene Typeprotein-coding
GO ID

GO:0000027

UniProtAcc

B3KQY7


Top

Malignant transformation analysis

check button Identification of the aberrant gene expression in precancerous and cancerous lesions by comparing the gene expression of stem-like cells in diseased tissues with normal stem cells
check button Malignant transformation involving gene list.
Entrez IDSymbolReplicatesSpeciesOrganTissueAdj P-valueLog2FCMalignancy
84231TRAF7LZE4THumanEsophagusESCC8.85e-164.51e-010.0811
84231TRAF7LZE7THumanEsophagusESCC1.52e-136.48e-010.0667
84231TRAF7LZE8THumanEsophagusESCC1.18e-176.92e-010.067
84231TRAF7LZE20THumanEsophagusESCC7.51e-042.16e-010.0662
84231TRAF7LZE22D1HumanEsophagusHGIN2.03e-029.31e-020.0595
84231TRAF7LZE22THumanEsophagusESCC1.70e-065.04e-010.068
84231TRAF7LZE24THumanEsophagusESCC3.38e-247.55e-010.0596
84231TRAF7LZE21THumanEsophagusESCC3.74e-043.83e-010.0655
84231TRAF7LZE6THumanEsophagusESCC3.35e-034.58e-020.0845
84231TRAF7P1T-EHumanEsophagusESCC1.64e-126.75e-010.0875
84231TRAF7P2T-EHumanEsophagusESCC1.36e-561.06e+000.1177
84231TRAF7P4T-EHumanEsophagusESCC9.82e-459.86e-010.1323
84231TRAF7P5T-EHumanEsophagusESCC1.28e-195.30e-010.1327
84231TRAF7P8T-EHumanEsophagusESCC1.99e-275.90e-010.0889
84231TRAF7P9T-EHumanEsophagusESCC1.52e-173.90e-010.1131
84231TRAF7P10T-EHumanEsophagusESCC3.62e-141.99e-010.116
84231TRAF7P11T-EHumanEsophagusESCC2.83e-168.82e-010.1426
84231TRAF7P12T-EHumanEsophagusESCC1.49e-408.20e-010.1122
84231TRAF7P15T-EHumanEsophagusESCC1.31e-521.33e+000.1149
84231TRAF7P16T-EHumanEsophagusESCC4.44e-225.22e-010.1153
Page: 1 2 3 4 5 6 

check button Transcriptomic changes along malignancy continuum.
TissueExpression DynamicsAbbreviation
EsophagusThe image shows the transcriptomic changes along malignancy continuum.log2FC in expression of this searched gene in stem-like cells from each diseased tissue sample relative to stem-like cells in normal samples in each tissue plotted against the malignancy continuum. Samples are colored based on if they are from different disease stage.ESCC: Esophageal squamous cell carcinoma
HGIN: High-grade intraepithelial neoplasias
LGIN: Low-grade intraepithelial neoplasias
LiverThe image shows the transcriptomic changes along malignancy continuum.log2FC in expression of this searched gene in stem-like cells from each diseased tissue sample relative to stem-like cells in normal samples in each tissue plotted against the malignancy continuum. Samples are colored based on if they are from different disease stage.
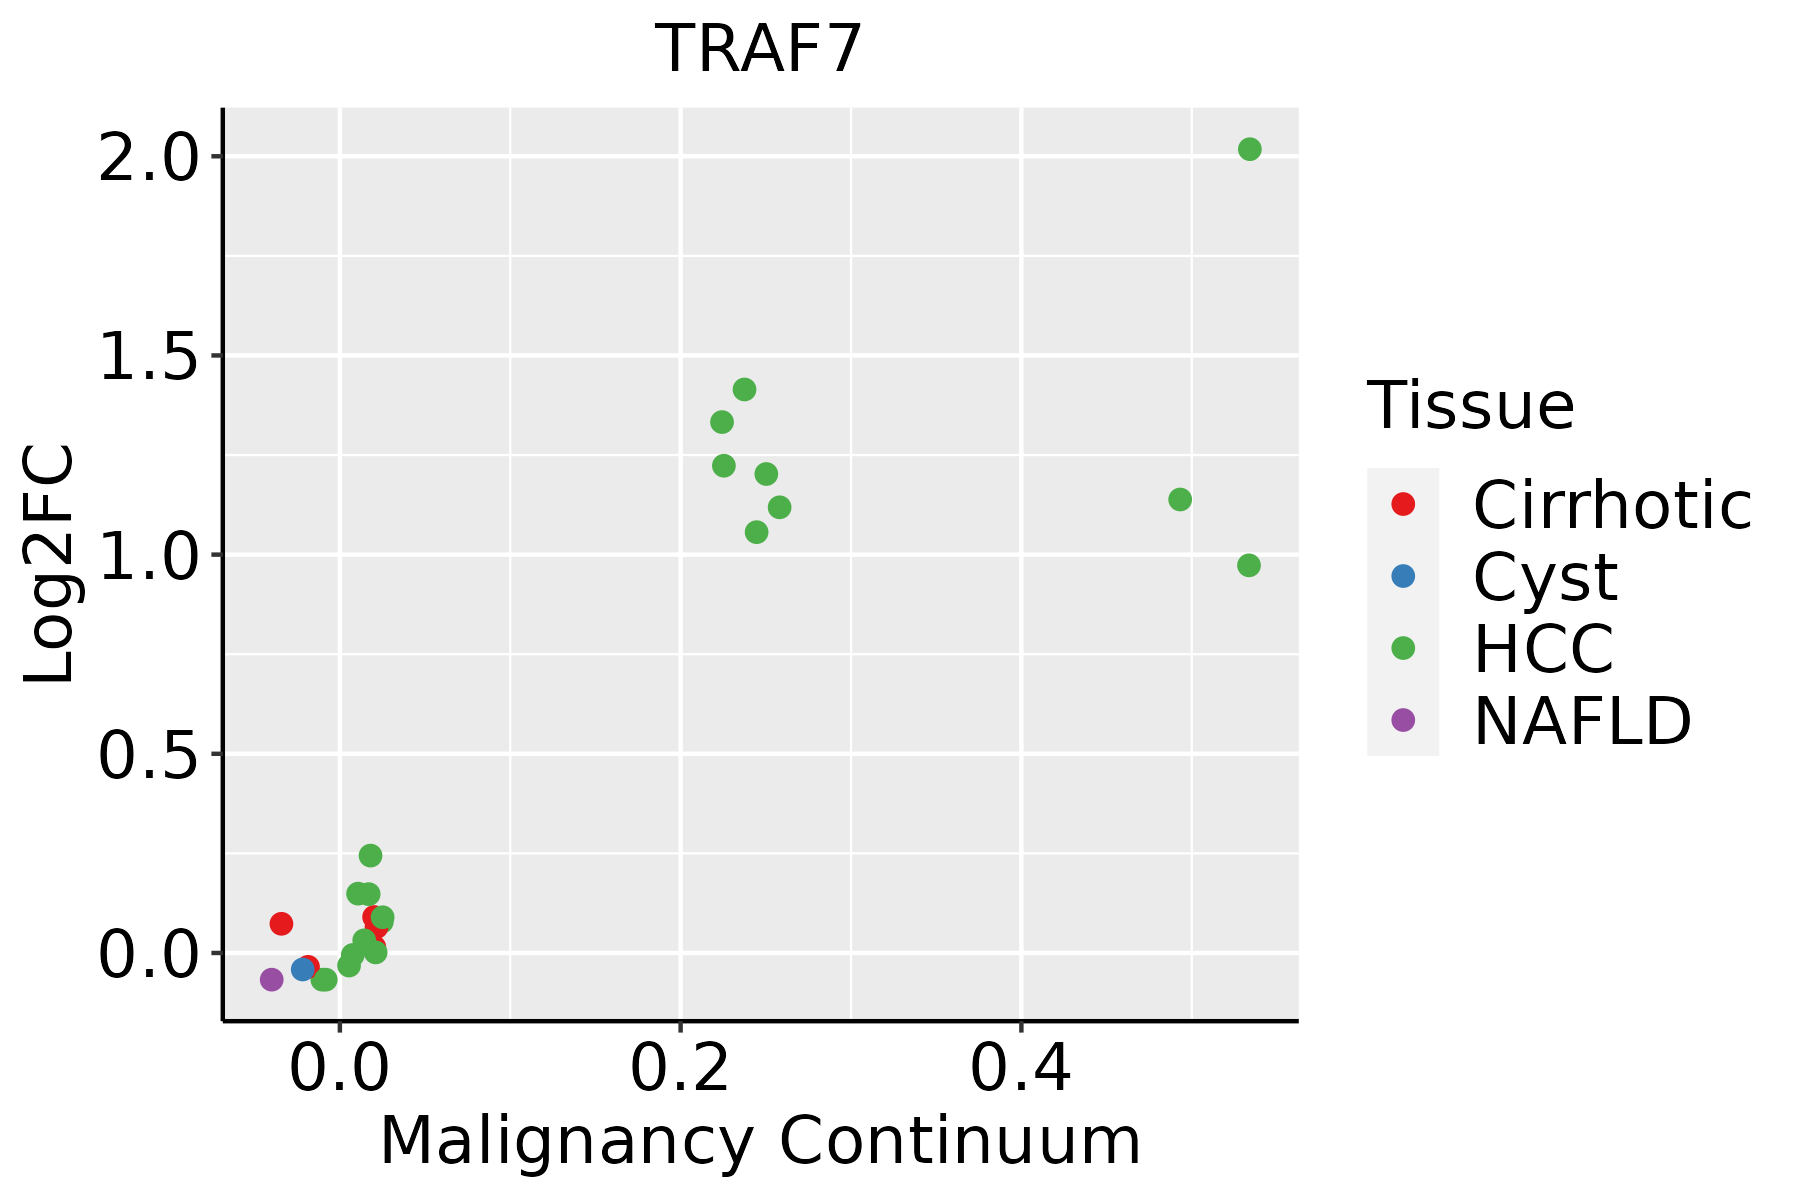
HCC: Hepatocellular carcinoma
NAFLD: Non-alcoholic fatty liver disease
Oral CavityThe image shows the transcriptomic changes along malignancy continuum.log2FC in expression of this searched gene in stem-like cells from each diseased tissue sample relative to stem-like cells in normal samples in each tissue plotted against the malignancy continuum. Samples are colored based on if they are from different disease stage.
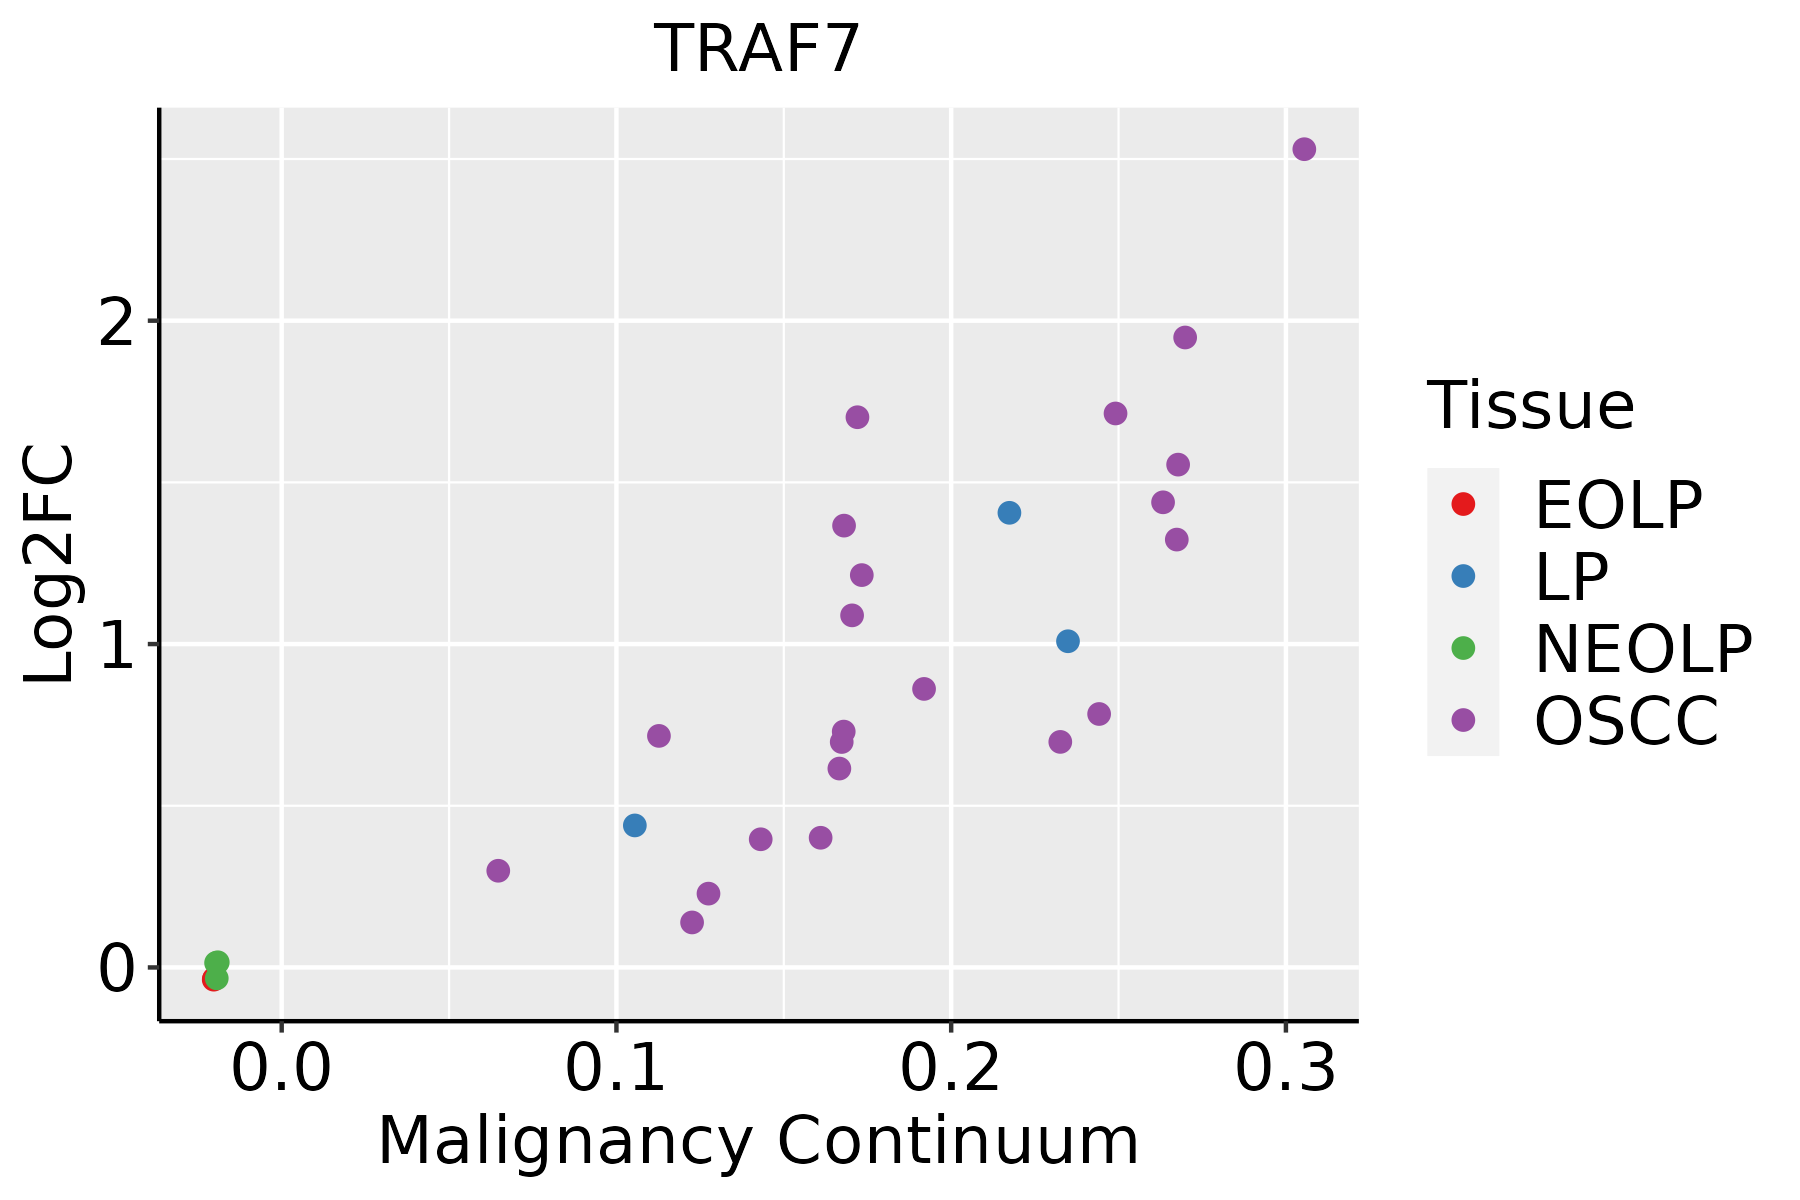
EOLP: Erosive Oral lichen planus
LP: leukoplakia
NEOLP: Non-erosive oral lichen planus
OSCC: Oral squamous cell carcinoma
SkinThe image shows the transcriptomic changes along malignancy continuum.log2FC in expression of this searched gene in stem-like cells from each diseased tissue sample relative to stem-like cells in normal samples in each tissue plotted against the malignancy continuum. Samples are colored based on if they are from different disease stage.AK: Actinic keratosis
cSCC: Cutaneous squamous cell carcinoma
SCCIS:squamous cell carcinoma in situ
∗log2FC in expression of this searched gene in stem-like cells from each diseased tissue sample relative to stem-like cells in normal samples in each tissue plotted against the malignancy continuum. Samples are colored based on if they are from different disease stage.

Top

Malignant transformation related pathway analysis

check buttonFind out the enriched GO biological processes and KEGG pathways involved in transition from healthy to precancer to cancer
check button Figure of enriched GO biological processes.
TissueDisease StageEnriched GO biological Processes
ColorectumADGO analysis - Figure of enriched GO biological processes: Top 15 enriched GO BP terms are showed in the bar plot of each disease state in each tissue. Each row represents a significant GO biological process which is colored according to the -log10(p.adjust).
ColorectumSERGO analysis - Figure of enriched GO biological processes: Top 15 enriched GO BP terms are showed in the bar plot of each disease state in each tissue. Each row represents a significant GO biological process which is colored according to the -log10(p.adjust).
ColorectumMSSGO analysis - Figure of enriched GO biological processes: Top 15 enriched GO BP terms are showed in the bar plot of each disease state in each tissue. Each row represents a significant GO biological process which is colored according to the -log10(p.adjust).
ColorectumMSI-HGO analysis - Figure of enriched GO biological processes: Top 15 enriched GO BP terms are showed in the bar plot of each disease state in each tissue. Each row represents a significant GO biological process which is colored according to the -log10(p.adjust).
ColorectumFAPGO analysis - Figure of enriched GO biological processes: Top 15 enriched GO BP terms are showed in the bar plot of each disease state in each tissue. Each row represents a significant GO biological process which is colored according to the -log10(p.adjust).
∗Top 15 enriched GO BP terms are showed in the bar plot of each disease state in each tissue. Each row represents a significant GO biological process which is colored according to the -log10(p.adjust).
Page: 1 2 3 4 5 6 7 8 9 

check button Enriched GO biological processes.
GO IDTissueDisease StageDescriptionGene RatioBg Ratiopvaluep.adjustCount
GO:002261327EsophagusHGINribonucleoprotein complex biogenesis158/2587463/187232.61e-295.23e-26158
GO:004225426EsophagusHGINribosome biogenesis101/2587299/187238.74e-194.03e-16101
GO:007182627EsophagusHGINribonucleoprotein complex subunit organization84/2587227/187231.34e-185.37e-1684
GO:002261827EsophagusHGINribonucleoprotein complex assembly82/2587220/187232.07e-187.36e-1682
GO:004227326EsophagusHGINribosomal large subunit biogenesis34/258772/187238.82e-121.06e-0934
GO:200123327EsophagusHGINregulation of apoptotic signaling pathway97/2587356/187231.36e-111.57e-0997
GO:004225527EsophagusHGINribosome assembly28/258761/187231.36e-091.07e-0728
GO:200123519EsophagusHGINpositive regulation of apoptotic signaling pathway41/2587126/187236.06e-083.22e-0641
GO:000002726EsophagusHGINribosomal large subunit assembly13/258727/187231.95e-055.24e-0413
GO:0022613111EsophagusESCCribonucleoprotein complex biogenesis365/8552463/187231.74e-491.11e-45365
GO:0042254111EsophagusESCCribosome biogenesis252/8552299/187233.27e-441.04e-40252
GO:2001233111EsophagusESCCregulation of apoptotic signaling pathway256/8552356/187234.11e-241.04e-21256
GO:0071826111EsophagusESCCribonucleoprotein complex subunit organization166/8552227/187232.94e-172.42e-15166
GO:0022618111EsophagusESCCribonucleoprotein complex assembly159/8552220/187238.19e-165.71e-14159
GO:0042273111EsophagusESCCribosomal large subunit biogenesis65/855272/187231.53e-159.82e-1465
GO:2001235110EsophagusESCCpositive regulation of apoptotic signaling pathway92/8552126/187233.91e-101.05e-0892
GO:0042255111EsophagusESCCribosome assembly50/855261/187235.66e-091.17e-0750
GO:00072197EsophagusESCCNotch signaling pathway106/8552172/187231.74e-051.55e-04106
GO:0000027111EsophagusESCCribosomal large subunit assembly22/855227/187231.49e-049.92e-0422
GO:002261322LiverHCCribonucleoprotein complex biogenesis355/7958463/187237.76e-524.92e-48355
Page: 1 2 3 4 

check button Enriched KEGG pathways.
Pathway IDTissueDisease StageDescriptionGene RatioBg Ratiopvaluep.adjustqvalueCount
Page: 1 

Top

Cell-cell communication analysis

check buttonIdentification of potential cell-cell interactions between two cell types and their ligand-receptor pairs for different disease states
LigandReceptorLRpairPathwayTissueDisease Stage
Page: 1 

Top

Single-cell gene regulatory network inference analysis

check buttonFind out the significant the regulons (TFs) and the target genes of each regulon across cell types for different disease states
TFCell TypeTissueDisease StageTarget GeneRSSRegulon Activity
∗The dot plots of a searched regulon are shown for all cell subpopulations in each disease state of each tissue based on the regulon specific score inferred using pySCENIC and by calculating the average expression.
Page: 1 

Top

Somatic mutation of malignant transformation related genes

check buttonAnnotation of somatic variants for genes involved in malignant transformation
Hugo SymbolVariant ClassVariant ClassificationdbSNP RSHGVScHGVSpHGVSp ShortSWISSPROTBIOTYPESIFTPolyPhenTumor Sample BarcodeTissueHistologySexAgeStageTherapy TypesDrugsOutcome
TRAF7SNVMissense_Mutationrs771191963c.623N>Ap.Arg208Glnp.R208QQ6Q0C0protein_codingtolerated(0.6)benign(0.015)TCGA-5L-AAT1-01Breastbreast invasive carcinomaFemale<65III/IVHormone TherapyletrozolSD
TRAF7SNVMissense_Mutationnovelc.1429N>Tp.Ala477Serp.A477SQ6Q0C0protein_codingdeleterious(0.02)probably_damaging(0.979)TCGA-A7-A6VX-01Breastbreast invasive carcinomaFemale>=65I/IIChemotherapydocetaxelCR
TRAF7SNVMissense_Mutationnovelc.746C>Ap.Ala249Aspp.A249DQ6Q0C0protein_codingtolerated(0.65)benign(0.003)TCGA-BH-A0AV-01Breastbreast invasive carcinomaFemale<65I/IIChemotherapytaxotereCR
TRAF7SNVMissense_Mutationrs201037324c.347N>Tp.Pro116Leup.P116LQ6Q0C0protein_codingtolerated(0.14)benign(0.012)TCGA-BH-A0HA-01Breastbreast invasive carcinomaFemale<65I/IIUnknownUnknownSD
TRAF7SNVMissense_Mutationrs757410464c.946C>Tp.Arg316Cysp.R316CQ6Q0C0protein_codingdeleterious(0.01)benign(0.093)TCGA-D8-A1XQ-01Breastbreast invasive carcinomaFemale>=65I/IIUnknownUnknownSD
TRAF7deletionFrame_Shift_Delc.1897_1898delATp.Met633AspfsTer30p.M633Dfs*30Q6Q0C0protein_codingTCGA-A7-A0DA-01Breastbreast invasive carcinomaFemale<65I/IIChemotherapyadriamycinSD
TRAF7SNVMissense_Mutationrs768623972c.652G>Ap.Ala218Thrp.A218TQ6Q0C0protein_codingtolerated(0.6)benign(0)TCGA-2W-A8YY-01Cervixcervical & endocervical cancerFemale<65I/IIChemotherapycisplatinCR
TRAF7SNVMissense_Mutationrs765441523c.853N>Ap.Glu285Lysp.E285KQ6Q0C0protein_codingdeleterious(0.01)possibly_damaging(0.739)TCGA-C5-A7CJ-01Cervixcervical & endocervical cancerFemale<65I/IIChemotherapycisplatinSD
TRAF7SNVMissense_Mutationc.1539N>Cp.Lys513Asnp.K513NQ6Q0C0protein_codingtolerated(0.3)probably_damaging(0.958)TCGA-JX-A3Q0-01Cervixcervical & endocervical cancerFemale<65III/IVUnknownUnknownSD
TRAF7SNVMissense_Mutationc.1921C>Tp.Arg641Cysp.R641CQ6Q0C0protein_codingdeleterious(0)probably_damaging(0.997)TCGA-5M-AAT6-01Colorectumcolon adenocarcinomaFemale<65III/IVUnknownUnknownPD
Page: 1 2 3 4 5 6 7 

Top

Related drugs of malignant transformation related genes

check buttonIdentification of chemicals and drugs interact with genes involved in malignant transfromation
(DGIdb 4.0)
Entrez IDSymbolCategoryInteraction TypesDrug Claim NameDrug NamePMIDs
Page: 1