
|
|||||
|
 | |
| |
| |
| |
| |
| |
|
Gene: TRAF4 |
Gene summary for TRAF4 |
| Gene information | Species | Human | Gene symbol | TRAF4 | Gene ID | 9618 |
| Gene name | TNF receptor associated factor 4 | |
| Gene Alias | CART1 | |
| Cytomap | 17q11.2 | |
| Gene Type | protein-coding | GO ID | GO:0000165 | UniProtAcc | A0A024QZ59 |
Top |
Malignant transformation analysis |
| Identification of the aberrant gene expression in precancerous and cancerous lesions by comparing the gene expression of stem-like cells in diseased tissues with normal stem cells |
| Entrez ID | Symbol | Replicates | Species | Organ | Tissue | Adj P-value | Log2FC | Malignancy |
| 9618 | TRAF4 | LZE4T | Human | Esophagus | ESCC | 1.93e-09 | -2.14e-01 | 0.0811 |
| 9618 | TRAF4 | LZE7T | Human | Esophagus | ESCC | 3.63e-12 | 2.63e-02 | 0.0667 |
| 9618 | TRAF4 | LZE20T | Human | Esophagus | ESCC | 8.85e-07 | -1.93e-02 | 0.0662 |
| 9618 | TRAF4 | LZE24T | Human | Esophagus | ESCC | 3.95e-27 | 1.63e+00 | 0.0596 |
| 9618 | TRAF4 | LZE21T | Human | Esophagus | ESCC | 7.71e-06 | 9.32e-01 | 0.0655 |
| 9618 | TRAF4 | LZE6T | Human | Esophagus | ESCC | 9.89e-05 | -3.59e-01 | 0.0845 |
| 9618 | TRAF4 | P1T-E | Human | Esophagus | ESCC | 2.09e-11 | 1.28e+00 | 0.0875 |
| 9618 | TRAF4 | P2T-E | Human | Esophagus | ESCC | 1.18e-52 | 1.36e+00 | 0.1177 |
| 9618 | TRAF4 | P4T-E | Human | Esophagus | ESCC | 1.83e-28 | 9.39e-01 | 0.1323 |
| 9618 | TRAF4 | P5T-E | Human | Esophagus | ESCC | 5.60e-14 | 1.54e-01 | 0.1327 |
| 9618 | TRAF4 | P8T-E | Human | Esophagus | ESCC | 6.27e-31 | 1.34e+00 | 0.0889 |
| 9618 | TRAF4 | P9T-E | Human | Esophagus | ESCC | 1.23e-11 | 3.48e-01 | 0.1131 |
| 9618 | TRAF4 | P10T-E | Human | Esophagus | ESCC | 5.69e-12 | 4.93e-01 | 0.116 |
| 9618 | TRAF4 | P11T-E | Human | Esophagus | ESCC | 6.71e-05 | 8.64e-01 | 0.1426 |
| 9618 | TRAF4 | P12T-E | Human | Esophagus | ESCC | 1.54e-15 | 7.30e-01 | 0.1122 |
| 9618 | TRAF4 | P15T-E | Human | Esophagus | ESCC | 1.32e-26 | 8.27e-01 | 0.1149 |
| 9618 | TRAF4 | P16T-E | Human | Esophagus | ESCC | 2.23e-32 | 1.18e+00 | 0.1153 |
| 9618 | TRAF4 | P17T-E | Human | Esophagus | ESCC | 1.30e-07 | 6.50e-01 | 0.1278 |
| 9618 | TRAF4 | P20T-E | Human | Esophagus | ESCC | 9.44e-13 | 6.40e-01 | 0.1124 |
| 9618 | TRAF4 | P21T-E | Human | Esophagus | ESCC | 2.16e-42 | 1.28e+00 | 0.1617 |
| Page: 1 2 3 4 5 6 |
| Tissue | Expression Dynamics | Abbreviation |
| Esophagus | 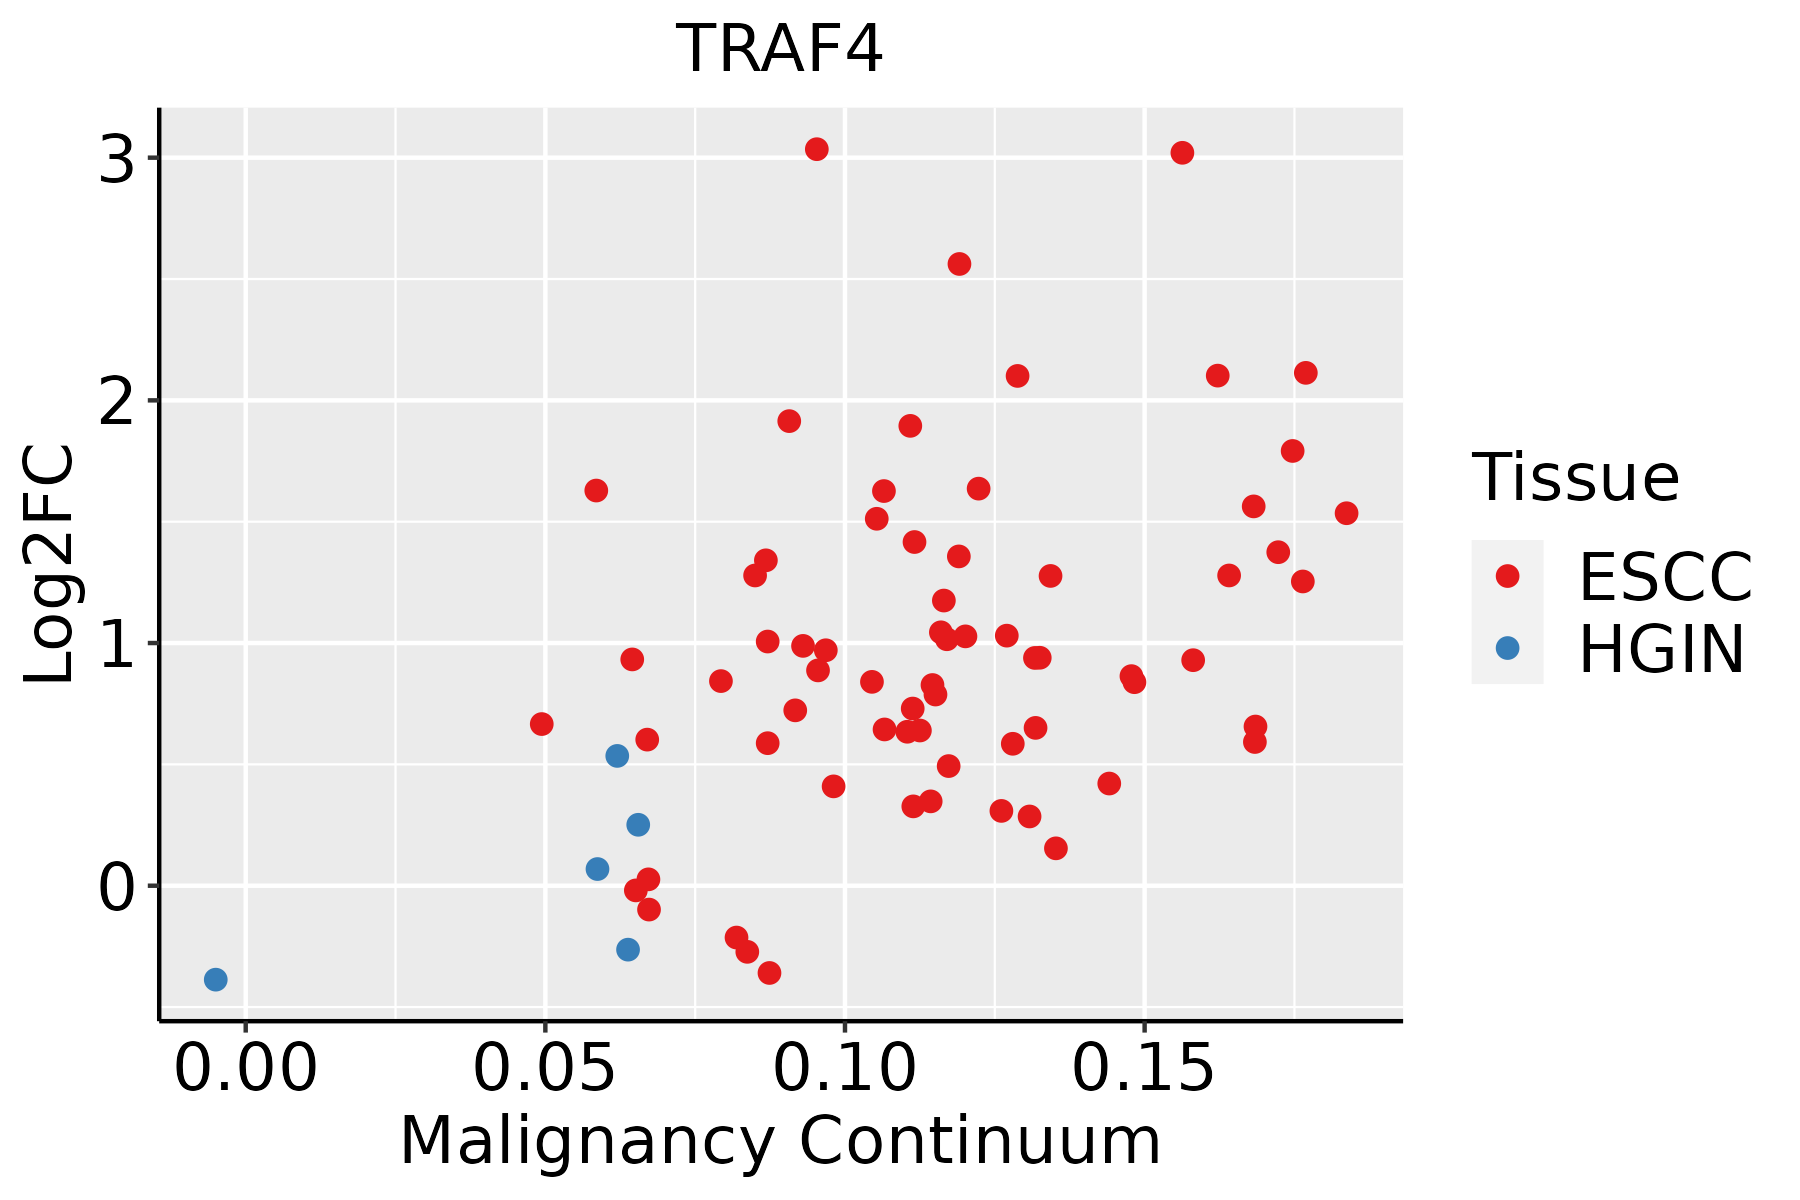 | ESCC: Esophageal squamous cell carcinoma |
| HGIN: High-grade intraepithelial neoplasias | ||
| LGIN: Low-grade intraepithelial neoplasias | ||
| Liver | 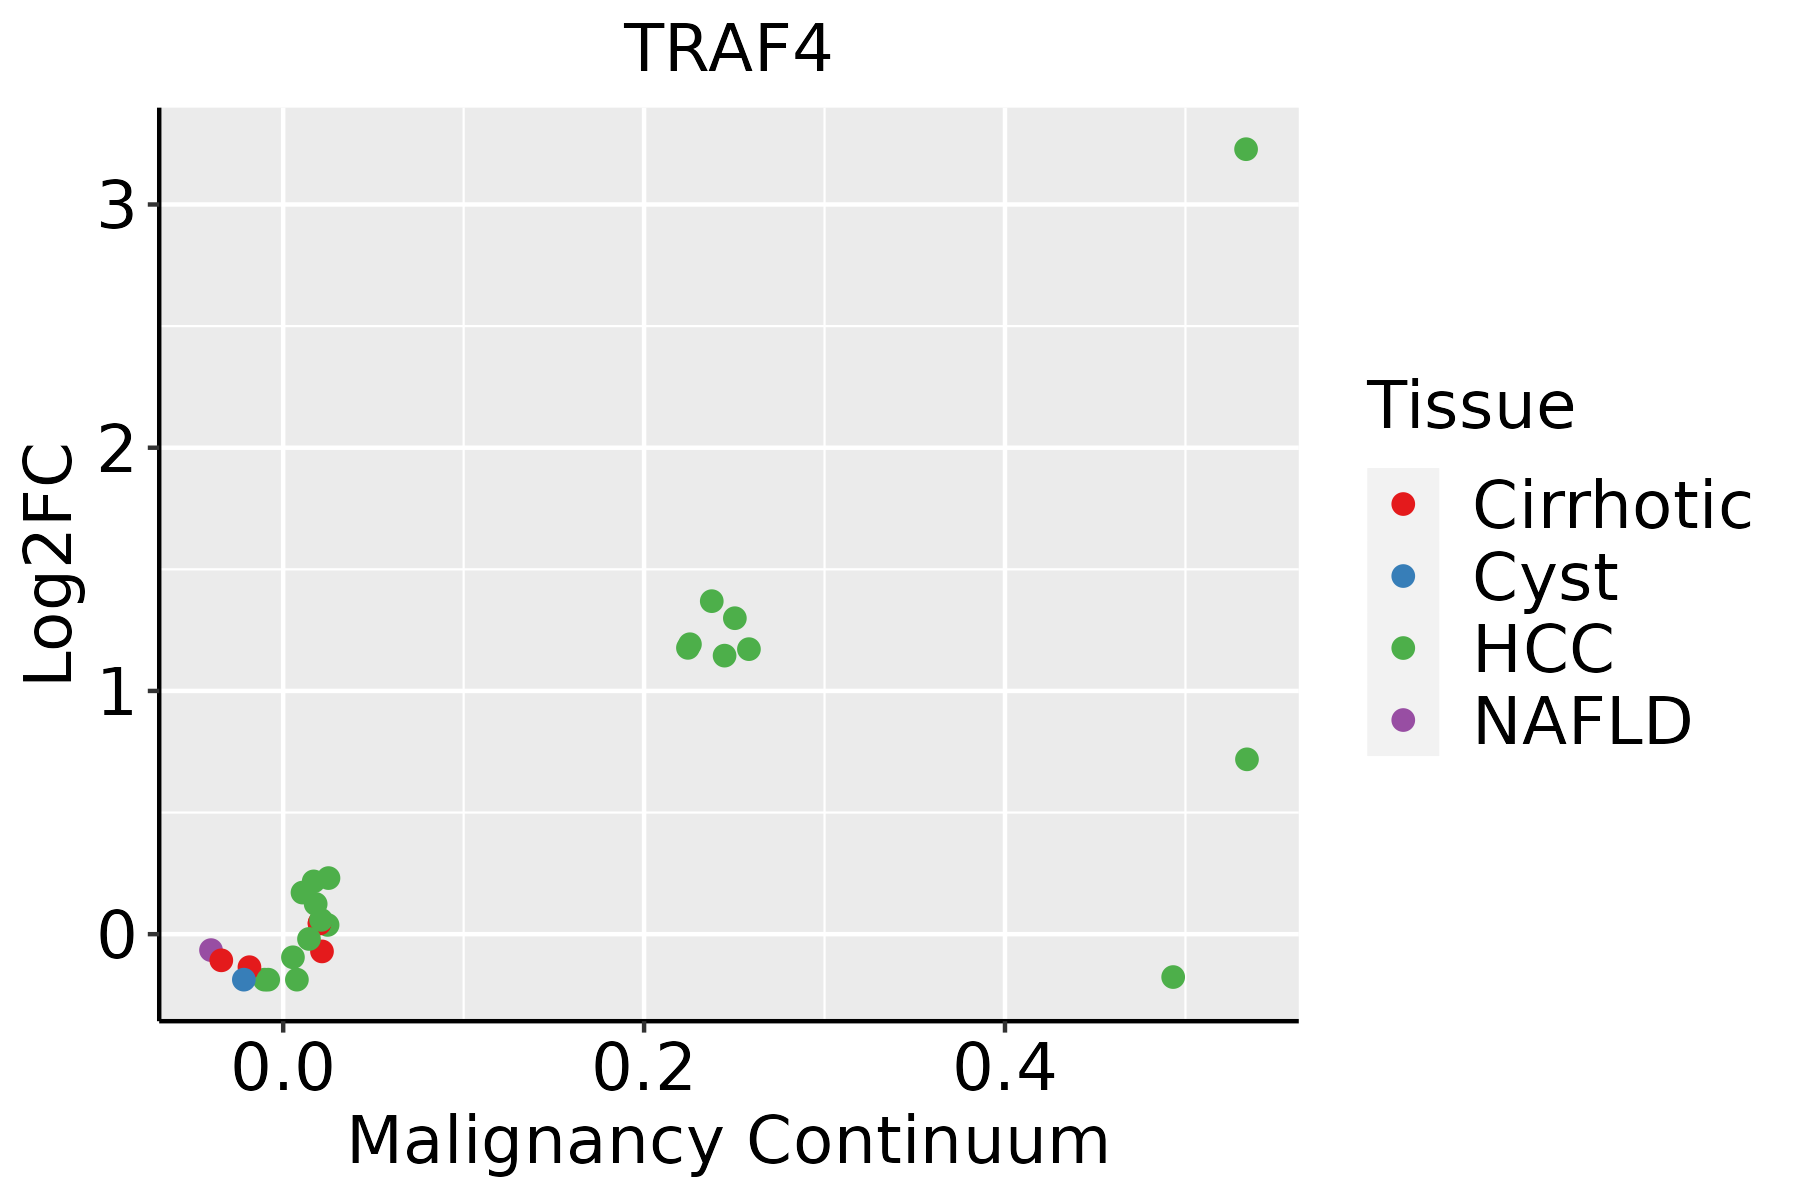 | HCC: Hepatocellular carcinoma |
| NAFLD: Non-alcoholic fatty liver disease | ||
| Oral Cavity | 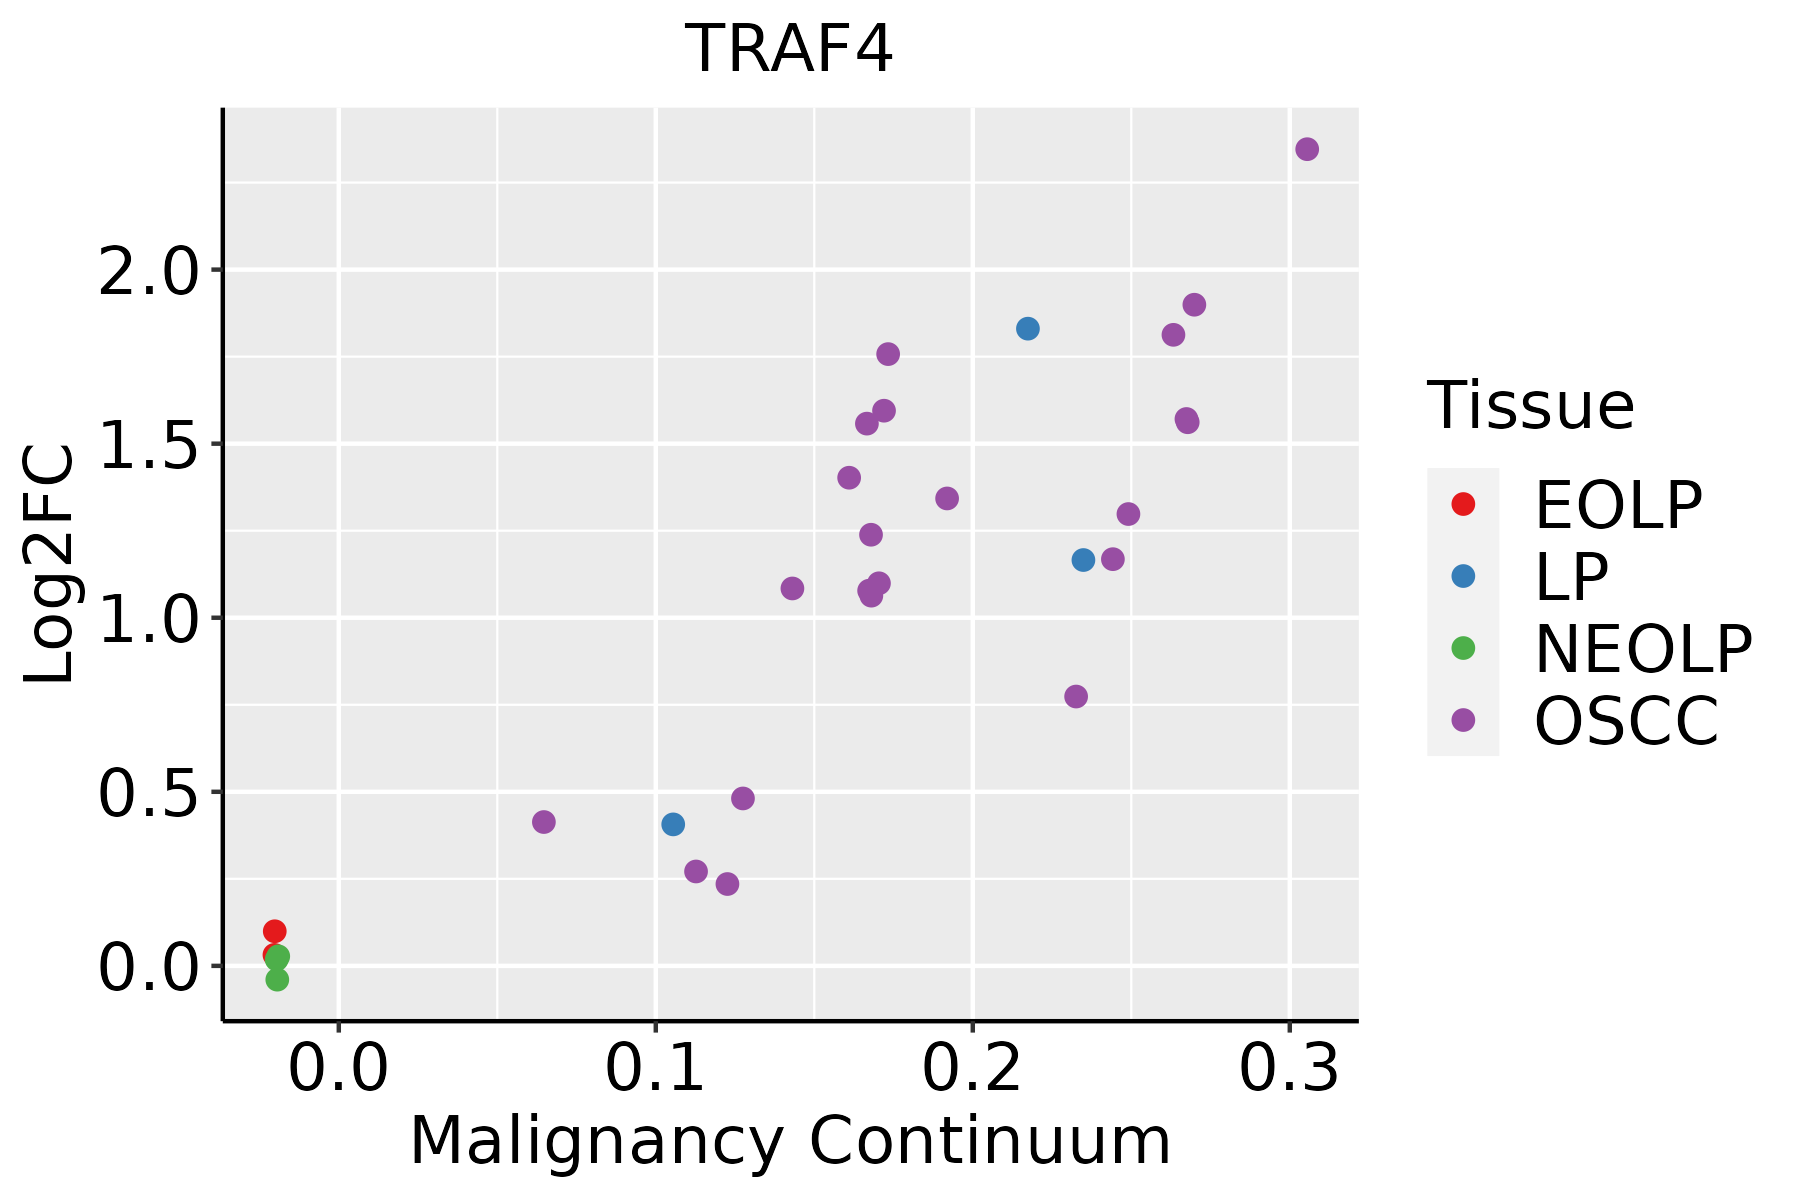 | EOLP: Erosive Oral lichen planus |
| LP: leukoplakia | ||
| NEOLP: Non-erosive oral lichen planus | ||
| OSCC: Oral squamous cell carcinoma | ||
| Prostate | 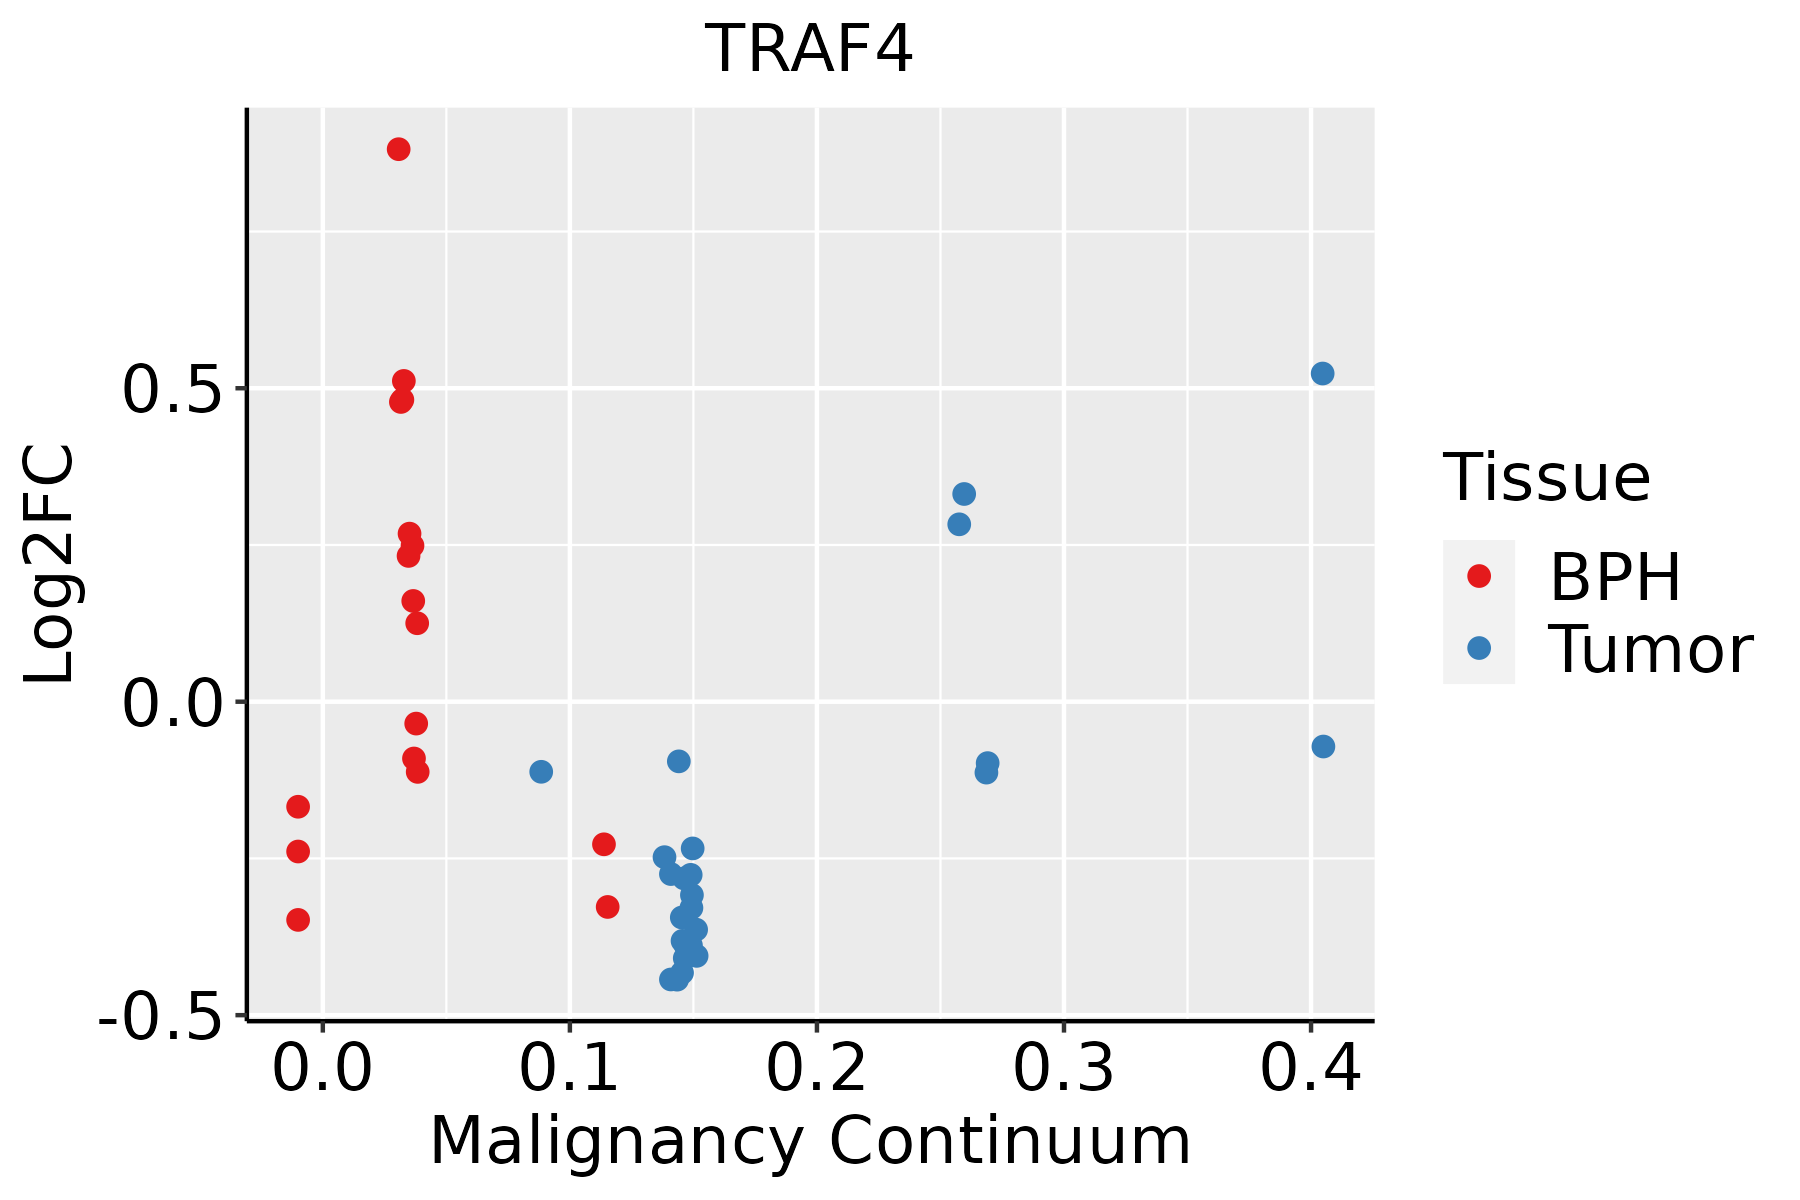 | BPH: Benign Prostatic Hyperplasia |
| Skin | 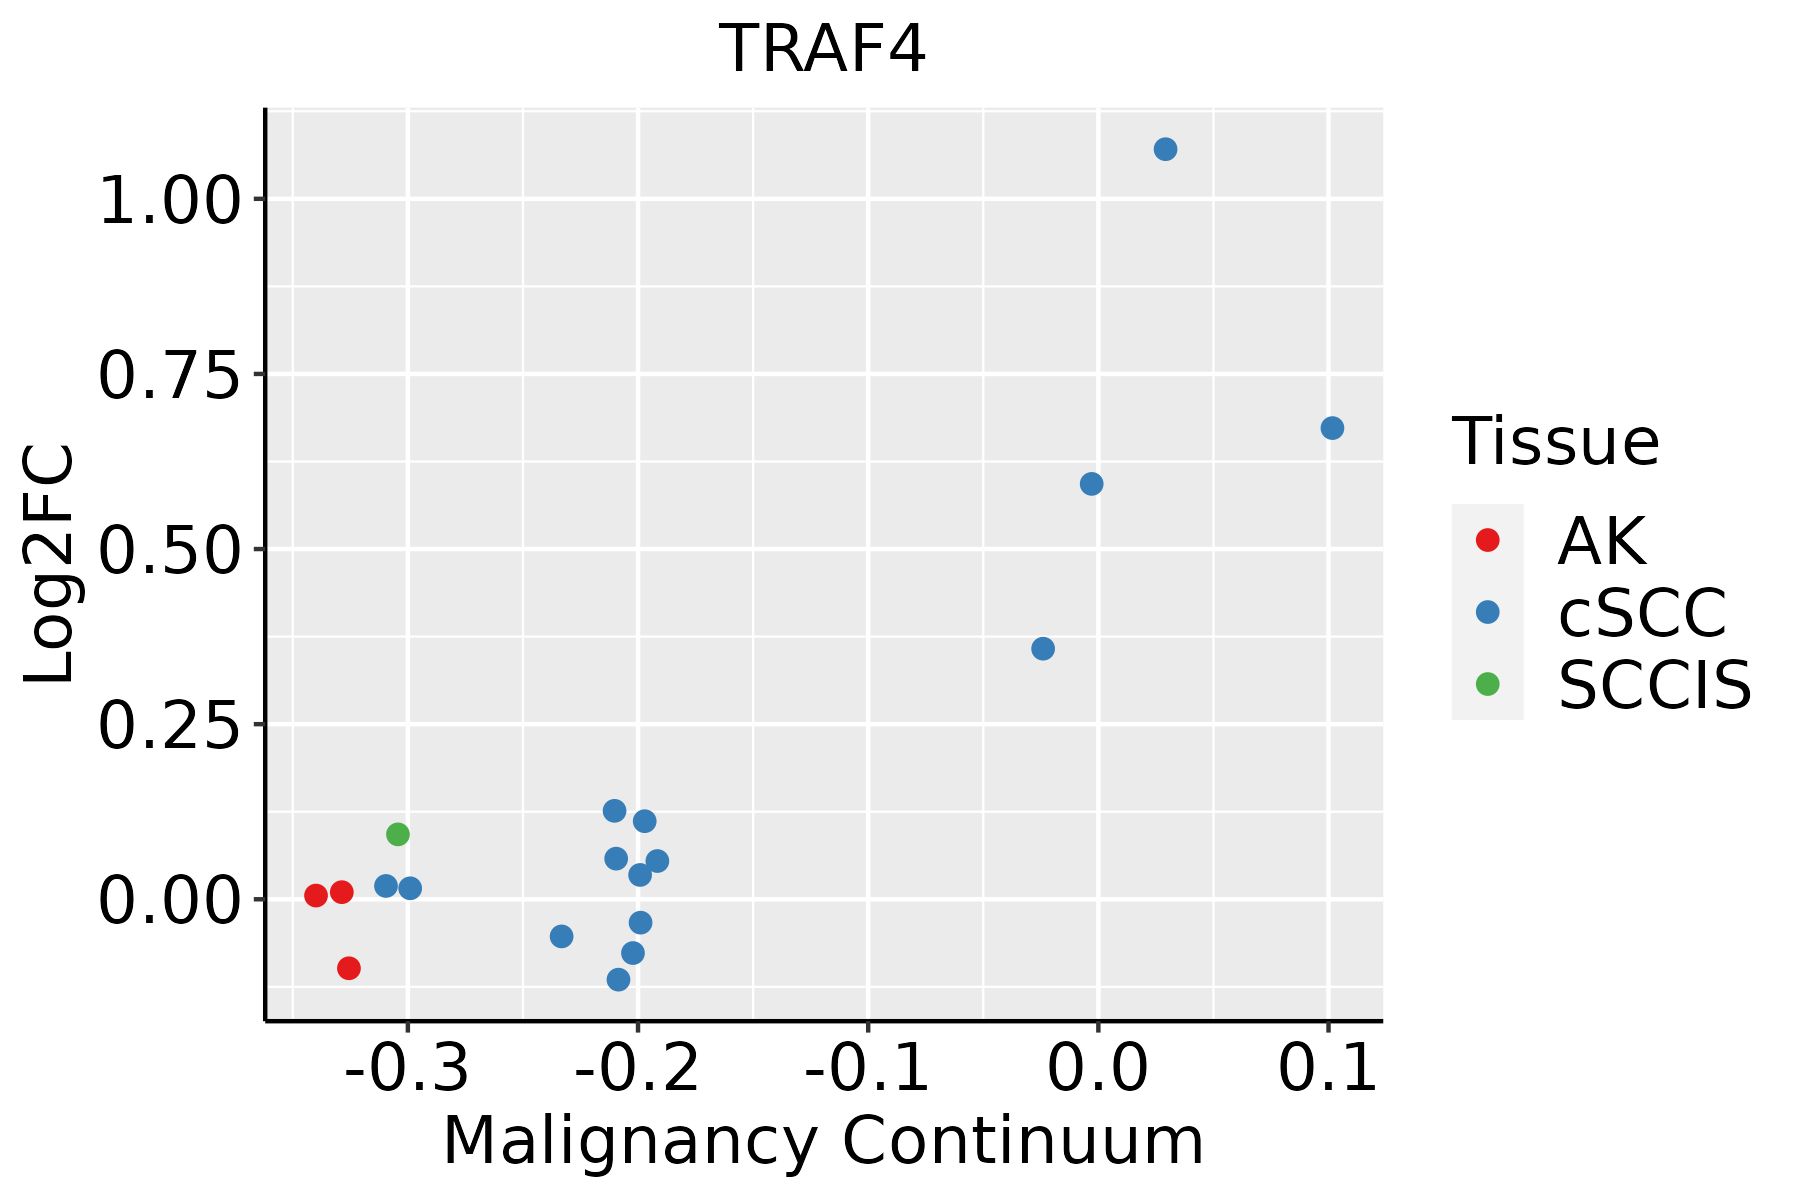 | AK: Actinic keratosis |
| cSCC: Cutaneous squamous cell carcinoma | ||
| SCCIS:squamous cell carcinoma in situ | ||
| Thyroid |  | ATC: Anaplastic thyroid cancer |
| HT: Hashimoto's thyroiditis | ||
| PTC: Papillary thyroid cancer |
| ∗log2FC in expression of this searched gene in stem-like cells from each diseased tissue sample relative to stem-like cells in normal samples in each tissue plotted against the malignancy continuum. Samples are colored based on if they are from different disease stage. |
Top |
Malignant transformation related pathway analysis |
| Find out the enriched GO biological processes and KEGG pathways involved in transition from healthy to precancer to cancer |
| Tissue | Disease Stage | Enriched GO biological Processes |
| Colorectum | AD |  |
| Colorectum | SER |  |
| Colorectum | MSS |  |
| Colorectum | MSI-H |  |
| Colorectum | FAP |  |
| ∗Top 15 enriched GO BP terms are showed in the bar plot of each disease state in each tissue. Each row represents a significant GO biological process which is colored according to the -log10(p.adjust). |
| Page: 1 2 3 4 5 6 7 8 9 |
| GO ID | Tissue | Disease Stage | Description | Gene Ratio | Bg Ratio | pvalue | p.adjust | Count |
| GO:0043122110 | Esophagus | ESCC | regulation of I-kappaB kinase/NF-kappaB signaling | 167/8552 | 249/18723 | 6.11e-12 | 2.32e-10 | 167 |
| GO:000724919 | Esophagus | ESCC | I-kappaB kinase/NF-kappaB signaling | 183/8552 | 281/18723 | 3.02e-11 | 1.01e-09 | 183 |
| GO:003109818 | Esophagus | ESCC | stress-activated protein kinase signaling cascade | 154/8552 | 247/18723 | 8.53e-08 | 1.44e-06 | 154 |
| GO:005140318 | Esophagus | ESCC | stress-activated MAPK cascade | 147/8552 | 239/18723 | 5.43e-07 | 7.18e-06 | 147 |
| GO:004586018 | Esophagus | ESCC | positive regulation of protein kinase activity | 219/8552 | 386/18723 | 6.91e-06 | 6.97e-05 | 219 |
| GO:003367420 | Esophagus | ESCC | positive regulation of kinase activity | 260/8552 | 467/18723 | 7.26e-06 | 7.22e-05 | 260 |
| GO:00303239 | Esophagus | ESCC | respiratory tube development | 112/8552 | 181/18723 | 7.82e-06 | 7.69e-05 | 112 |
| GO:007030217 | Esophagus | ESCC | regulation of stress-activated protein kinase signaling cascade | 119/8552 | 195/18723 | 1.07e-05 | 1.01e-04 | 119 |
| GO:003287217 | Esophagus | ESCC | regulation of stress-activated MAPK cascade | 116/8552 | 192/18723 | 2.63e-05 | 2.21e-04 | 116 |
| GO:00072549 | Esophagus | ESCC | JNK cascade | 102/8552 | 167/18723 | 4.22e-05 | 3.39e-04 | 102 |
| GO:00463289 | Esophagus | ESCC | regulation of JNK cascade | 80/8552 | 133/18723 | 5.35e-04 | 2.95e-03 | 80 |
| GO:00703046 | Esophagus | ESCC | positive regulation of stress-activated protein kinase signaling cascade | 74/8552 | 128/18723 | 3.77e-03 | 1.53e-02 | 74 |
| GO:00380615 | Esophagus | ESCC | NIK/NF-kappaB signaling | 81/8552 | 143/18723 | 5.33e-03 | 2.00e-02 | 81 |
| GO:00328745 | Esophagus | ESCC | positive regulation of stress-activated MAPK cascade | 72/8552 | 126/18723 | 6.24e-03 | 2.29e-02 | 72 |
| GO:00463302 | Esophagus | ESCC | positive regulation of JNK cascade | 52/8552 | 89/18723 | 1.04e-02 | 3.56e-02 | 52 |
| GO:00072494 | Liver | Cirrhotic | I-kappaB kinase/NF-kappaB signaling | 108/4634 | 281/18723 | 2.21e-07 | 5.64e-06 | 108 |
| GO:00431225 | Liver | Cirrhotic | regulation of I-kappaB kinase/NF-kappaB signaling | 95/4634 | 249/18723 | 1.68e-06 | 3.22e-05 | 95 |
| GO:00303232 | Liver | Cirrhotic | respiratory tube development | 66/4634 | 181/18723 | 2.82e-04 | 2.49e-03 | 66 |
| GO:0038061 | Liver | Cirrhotic | NIK/NF-kappaB signaling | 54/4634 | 143/18723 | 3.64e-04 | 3.07e-03 | 54 |
| GO:003109812 | Liver | Cirrhotic | stress-activated protein kinase signaling cascade | 83/4634 | 247/18723 | 1.04e-03 | 7.28e-03 | 83 |
| Page: 1 2 3 4 5 6 |
| Pathway ID | Tissue | Disease Stage | Description | Gene Ratio | Bg Ratio | pvalue | p.adjust | qvalue | Count |
| hsa052229 | Esophagus | ESCC | Small cell lung cancer | 69/4205 | 92/8465 | 5.40e-07 | 3.85e-06 | 1.97e-06 | 69 |
| hsa0465727 | Esophagus | ESCC | IL-17 signaling pathway | 66/4205 | 94/8465 | 3.93e-05 | 1.75e-04 | 8.99e-05 | 66 |
| hsa0522216 | Esophagus | ESCC | Small cell lung cancer | 69/4205 | 92/8465 | 5.40e-07 | 3.85e-06 | 1.97e-06 | 69 |
| hsa0465734 | Esophagus | ESCC | IL-17 signaling pathway | 66/4205 | 94/8465 | 3.93e-05 | 1.75e-04 | 8.99e-05 | 66 |
| hsa052224 | Liver | HCC | Small cell lung cancer | 57/4020 | 92/8465 | 3.54e-03 | 1.12e-02 | 6.22e-03 | 57 |
| hsa0522211 | Liver | HCC | Small cell lung cancer | 57/4020 | 92/8465 | 3.54e-03 | 1.12e-02 | 6.22e-03 | 57 |
| hsa052228 | Oral cavity | OSCC | Small cell lung cancer | 66/3704 | 92/8465 | 4.43e-08 | 3.38e-07 | 1.72e-07 | 66 |
| hsa0465724 | Oral cavity | OSCC | IL-17 signaling pathway | 64/3704 | 94/8465 | 1.48e-06 | 7.87e-06 | 4.01e-06 | 64 |
| hsa0522215 | Oral cavity | OSCC | Small cell lung cancer | 66/3704 | 92/8465 | 4.43e-08 | 3.38e-07 | 1.72e-07 | 66 |
| hsa04657112 | Oral cavity | OSCC | IL-17 signaling pathway | 64/3704 | 94/8465 | 1.48e-06 | 7.87e-06 | 4.01e-06 | 64 |
| hsa0465725 | Oral cavity | LP | IL-17 signaling pathway | 47/2418 | 94/8465 | 8.45e-06 | 6.25e-05 | 4.03e-05 | 47 |
| hsa0522224 | Oral cavity | LP | Small cell lung cancer | 37/2418 | 92/8465 | 1.04e-02 | 3.72e-02 | 2.40e-02 | 37 |
| hsa0465733 | Oral cavity | LP | IL-17 signaling pathway | 47/2418 | 94/8465 | 8.45e-06 | 6.25e-05 | 4.03e-05 | 47 |
| hsa0522234 | Oral cavity | LP | Small cell lung cancer | 37/2418 | 92/8465 | 1.04e-02 | 3.72e-02 | 2.40e-02 | 37 |
| hsa052227 | Prostate | BPH | Small cell lung cancer | 38/1718 | 92/8465 | 3.15e-06 | 2.74e-05 | 1.69e-05 | 38 |
| hsa0465723 | Prostate | BPH | IL-17 signaling pathway | 30/1718 | 94/8465 | 5.14e-03 | 1.73e-02 | 1.07e-02 | 30 |
| hsa0522214 | Prostate | BPH | Small cell lung cancer | 38/1718 | 92/8465 | 3.15e-06 | 2.74e-05 | 1.69e-05 | 38 |
| hsa04657111 | Prostate | BPH | IL-17 signaling pathway | 30/1718 | 94/8465 | 5.14e-03 | 1.73e-02 | 1.07e-02 | 30 |
| hsa0522223 | Prostate | Tumor | Small cell lung cancer | 37/1791 | 92/8465 | 2.38e-05 | 1.83e-04 | 1.13e-04 | 37 |
| hsa0522233 | Prostate | Tumor | Small cell lung cancer | 37/1791 | 92/8465 | 2.38e-05 | 1.83e-04 | 1.13e-04 | 37 |
| Page: 1 |
Top |
Cell-cell communication analysis |
| Identification of potential cell-cell interactions between two cell types and their ligand-receptor pairs for different disease states |
| Ligand | Receptor | LRpair | Pathway | Tissue | Disease Stage |
| Page: 1 |
Top |
Single-cell gene regulatory network inference analysis |
| Find out the significant the regulons (TFs) and the target genes of each regulon across cell types for different disease states |
| TF | Cell Type | Tissue | Disease Stage | Target Gene | RSS | Regulon Activity |
| TRAF4 | pDC | Breast | DCIS | SIPA1L2,LIX1L,IRF7, etc. | 5.31e-02 |  |
| TRAF4 | pDC | Breast | Healthy | SIPA1L2,LIX1L,IRF7, etc. | 3.26e-02 |  |
| TRAF4 | pDC | Breast | IDC | SIPA1L2,LIX1L,IRF7, etc. | 4.97e-02 |  |
| TRAF4 | BMEM | Liver | Cirrhotic | SLC16A10,PLSCR1,PLD4, etc. | 1.95e-03 |  |
| TRAF4 | CD8TEREX | Liver | Cirrhotic | SLC16A10,PLSCR1,PLD4, etc. | -8.88e-16 | |
| TRAF4 | CD8TCM | Liver | Cirrhotic | SLC16A10,PLSCR1,PLD4, etc. | 7.08e-04 | |
| TRAF4 | TH17 | Liver | Cirrhotic | SLC16A10,PLSCR1,PLD4, etc. | 0.00e+00 | |
| TRAF4 | CD8TEXINT | Liver | Cirrhotic | SLC16A10,PLSCR1,PLD4, etc. | 0.00e+00 | |
| TRAF4 | CD8TEFF | Liver | HCC | SLC16A10,PLSCR1,PLD4, etc. | 4.40e-03 |  |
| TRAF4 | BN | Liver | NAFLD | SLC16A10,PLSCR1,PLD4, etc. | 8.23e-02 |  |
| ∗The dot plots of a searched regulon are shown for all cell subpopulations in each disease state of each tissue based on the regulon specific score inferred using pySCENIC and by calculating the average expression. |
| Page: 1 2 |
Top |
Somatic mutation of malignant transformation related genes |
| Annotation of somatic variants for genes involved in malignant transformation |
| Hugo Symbol | Variant Class | Variant Classification | dbSNP RS | HGVSc | HGVSp | HGVSp Short | SWISSPROT | BIOTYPE | SIFT | PolyPhen | Tumor Sample Barcode | Tissue | Histology | Sex | Age | Stage | Therapy Types | Drugs | Outcome |
| TRAF4 | SNV | Missense_Mutation | novel | c.541G>A | p.Ala181Thr | p.A181T | Q9BUZ4 | protein_coding | tolerated(0.32) | benign(0.089) | TCGA-AA-3947-01 | Colorectum | colon adenocarcinoma | Female | <65 | I/II | Unknown | Unknown | SD |
| TRAF4 | SNV | Missense_Mutation | c.1087N>A | p.Leu363Ile | p.L363I | Q9BUZ4 | protein_coding | tolerated(0.17) | benign(0.142) | TCGA-AZ-4615-01 | Colorectum | colon adenocarcinoma | Male | >=65 | III/IV | Chemotherapy | xeloda | PD | |
| TRAF4 | SNV | Missense_Mutation | novel | c.1127N>C | p.Asn376Thr | p.N376T | Q9BUZ4 | protein_coding | tolerated(0.25) | benign(0.023) | TCGA-AJ-A3EK-01 | Endometrium | uterine corpus endometrioid carcinoma | Female | <65 | I/II | Chemotherapy | carboplatin | CR |
| TRAF4 | SNV | Missense_Mutation | c.1018N>T | p.His340Tyr | p.H340Y | Q9BUZ4 | protein_coding | deleterious(0.03) | possibly_damaging(0.602) | TCGA-AJ-A8CT-01 | Endometrium | uterine corpus endometrioid carcinoma | Female | <65 | I/II | Unknown | Unknown | SD | |
| TRAF4 | SNV | Missense_Mutation | novel | c.883N>A | p.Leu295Ile | p.L295I | Q9BUZ4 | protein_coding | deleterious(0.01) | possibly_damaging(0.578) | TCGA-AP-A051-01 | Endometrium | uterine corpus endometrioid carcinoma | Female | >=65 | I/II | Unknown | Unknown | SD |
| TRAF4 | SNV | Missense_Mutation | c.1160N>T | p.Thr387Ile | p.T387I | Q9BUZ4 | protein_coding | deleterious(0) | possibly_damaging(0.8) | TCGA-AP-A059-01 | Endometrium | uterine corpus endometrioid carcinoma | Female | >=65 | I/II | Unknown | Unknown | SD | |
| TRAF4 | SNV | Missense_Mutation | c.1354N>T | p.Arg452Trp | p.R452W | Q9BUZ4 | protein_coding | deleterious(0) | probably_damaging(0.998) | TCGA-AP-A0LD-01 | Endometrium | uterine corpus endometrioid carcinoma | Female | <65 | I/II | Unknown | Unknown | SD | |
| TRAF4 | SNV | Missense_Mutation | rs112254662 | c.347N>A | p.Arg116His | p.R116H | Q9BUZ4 | protein_coding | tolerated(0.1) | probably_damaging(0.921) | TCGA-AP-A1DV-01 | Endometrium | uterine corpus endometrioid carcinoma | Female | <65 | I/II | Unknown | Unknown | SD |
| TRAF4 | SNV | Missense_Mutation | novel | c.775N>T | p.His259Tyr | p.H259Y | Q9BUZ4 | protein_coding | tolerated(0.35) | benign(0.062) | TCGA-AX-A1CE-01 | Endometrium | uterine corpus endometrioid carcinoma | Female | <65 | I/II | Unspecific | Paclitaxel | SD |
| TRAF4 | SNV | Missense_Mutation | c.1343G>T | p.Arg448Leu | p.R448L | Q9BUZ4 | protein_coding | deleterious(0.01) | probably_damaging(0.973) | TCGA-B5-A0JY-01 | Endometrium | uterine corpus endometrioid carcinoma | Female | <65 | III/IV | Chemotherapy | doxorubicin | SD |
| Page: 1 2 3 |
Top |
Related drugs of malignant transformation related genes |
| Identification of chemicals and drugs interact with genes involved in malignant transfromation |
| (DGIdb 4.0) |
| Entrez ID | Symbol | Category | Interaction Types | Drug Claim Name | Drug Name | PMIDs |
| Page: 1 |

Copyright 2023-Present -The University of Texas Health Science Center at Houston |