
|
|||||
|
 | |
| |
| |
| |
| |
| |
|
Gene: TRAF3IP2 |
Gene summary for TRAF3IP2 |
| Gene information | Species | Human | Gene symbol | TRAF3IP2 | Gene ID | 10758 |
| Gene name | TRAF3 interacting protein 2 | |
| Gene Alias | ACT1 | |
| Cytomap | 6q21 | |
| Gene Type | protein-coding | GO ID | GO:0000209 | UniProtAcc | O43734 |
Top |
Malignant transformation analysis |
| Identification of the aberrant gene expression in precancerous and cancerous lesions by comparing the gene expression of stem-like cells in diseased tissues with normal stem cells |
| Entrez ID | Symbol | Replicates | Species | Organ | Tissue | Adj P-value | Log2FC | Malignancy |
| 10758 | TRAF3IP2 | LZE4T | Human | Esophagus | ESCC | 2.64e-09 | 2.16e-01 | 0.0811 |
| 10758 | TRAF3IP2 | LZE7T | Human | Esophagus | ESCC | 3.40e-03 | 1.37e-01 | 0.0667 |
| 10758 | TRAF3IP2 | LZE8T | Human | Esophagus | ESCC | 1.23e-03 | 3.13e-02 | 0.067 |
| 10758 | TRAF3IP2 | LZE24T | Human | Esophagus | ESCC | 1.51e-14 | 1.38e-01 | 0.0596 |
| 10758 | TRAF3IP2 | P2T-E | Human | Esophagus | ESCC | 4.01e-31 | 6.96e-01 | 0.1177 |
| 10758 | TRAF3IP2 | P4T-E | Human | Esophagus | ESCC | 3.37e-09 | 2.10e-01 | 0.1323 |
| 10758 | TRAF3IP2 | P5T-E | Human | Esophagus | ESCC | 3.32e-15 | 2.78e-01 | 0.1327 |
| 10758 | TRAF3IP2 | P8T-E | Human | Esophagus | ESCC | 7.17e-13 | 4.93e-02 | 0.0889 |
| 10758 | TRAF3IP2 | P9T-E | Human | Esophagus | ESCC | 2.31e-05 | 8.68e-03 | 0.1131 |
| 10758 | TRAF3IP2 | P10T-E | Human | Esophagus | ESCC | 1.19e-29 | 6.16e-01 | 0.116 |
| 10758 | TRAF3IP2 | P11T-E | Human | Esophagus | ESCC | 1.38e-04 | 2.81e-01 | 0.1426 |
| 10758 | TRAF3IP2 | P12T-E | Human | Esophagus | ESCC | 2.01e-22 | 5.41e-01 | 0.1122 |
| 10758 | TRAF3IP2 | P15T-E | Human | Esophagus | ESCC | 3.84e-22 | 6.05e-01 | 0.1149 |
| 10758 | TRAF3IP2 | P16T-E | Human | Esophagus | ESCC | 1.87e-19 | 4.29e-01 | 0.1153 |
| 10758 | TRAF3IP2 | P17T-E | Human | Esophagus | ESCC | 3.09e-08 | 1.97e-01 | 0.1278 |
| 10758 | TRAF3IP2 | P20T-E | Human | Esophagus | ESCC | 6.95e-21 | 2.64e-01 | 0.1124 |
| 10758 | TRAF3IP2 | P21T-E | Human | Esophagus | ESCC | 1.40e-37 | 8.32e-01 | 0.1617 |
| 10758 | TRAF3IP2 | P22T-E | Human | Esophagus | ESCC | 4.70e-16 | 1.37e-01 | 0.1236 |
| 10758 | TRAF3IP2 | P23T-E | Human | Esophagus | ESCC | 9.14e-11 | 3.90e-01 | 0.108 |
| 10758 | TRAF3IP2 | P24T-E | Human | Esophagus | ESCC | 9.51e-15 | 1.91e-01 | 0.1287 |
| Page: 1 2 3 4 5 |
| Tissue | Expression Dynamics | Abbreviation |
| Esophagus | 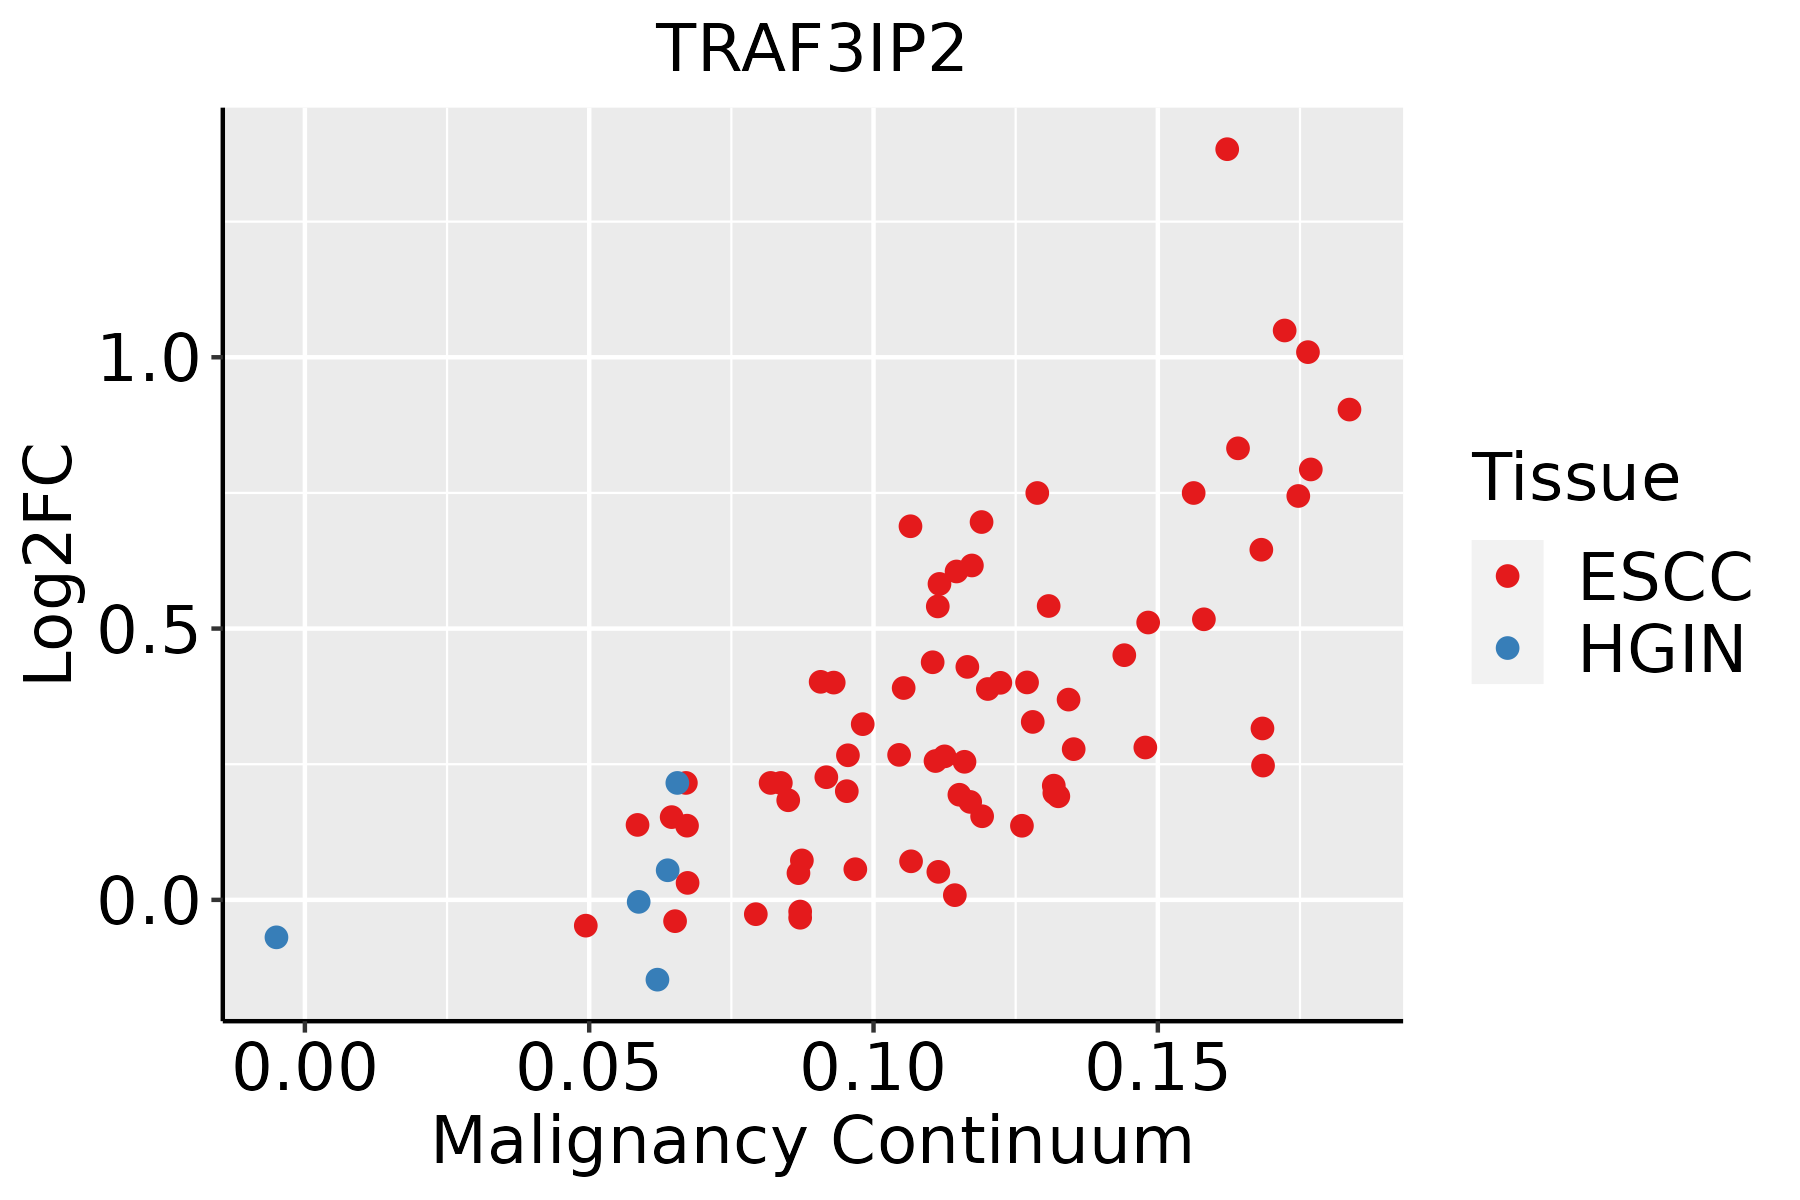 | ESCC: Esophageal squamous cell carcinoma |
| HGIN: High-grade intraepithelial neoplasias | ||
| LGIN: Low-grade intraepithelial neoplasias | ||
| Liver | 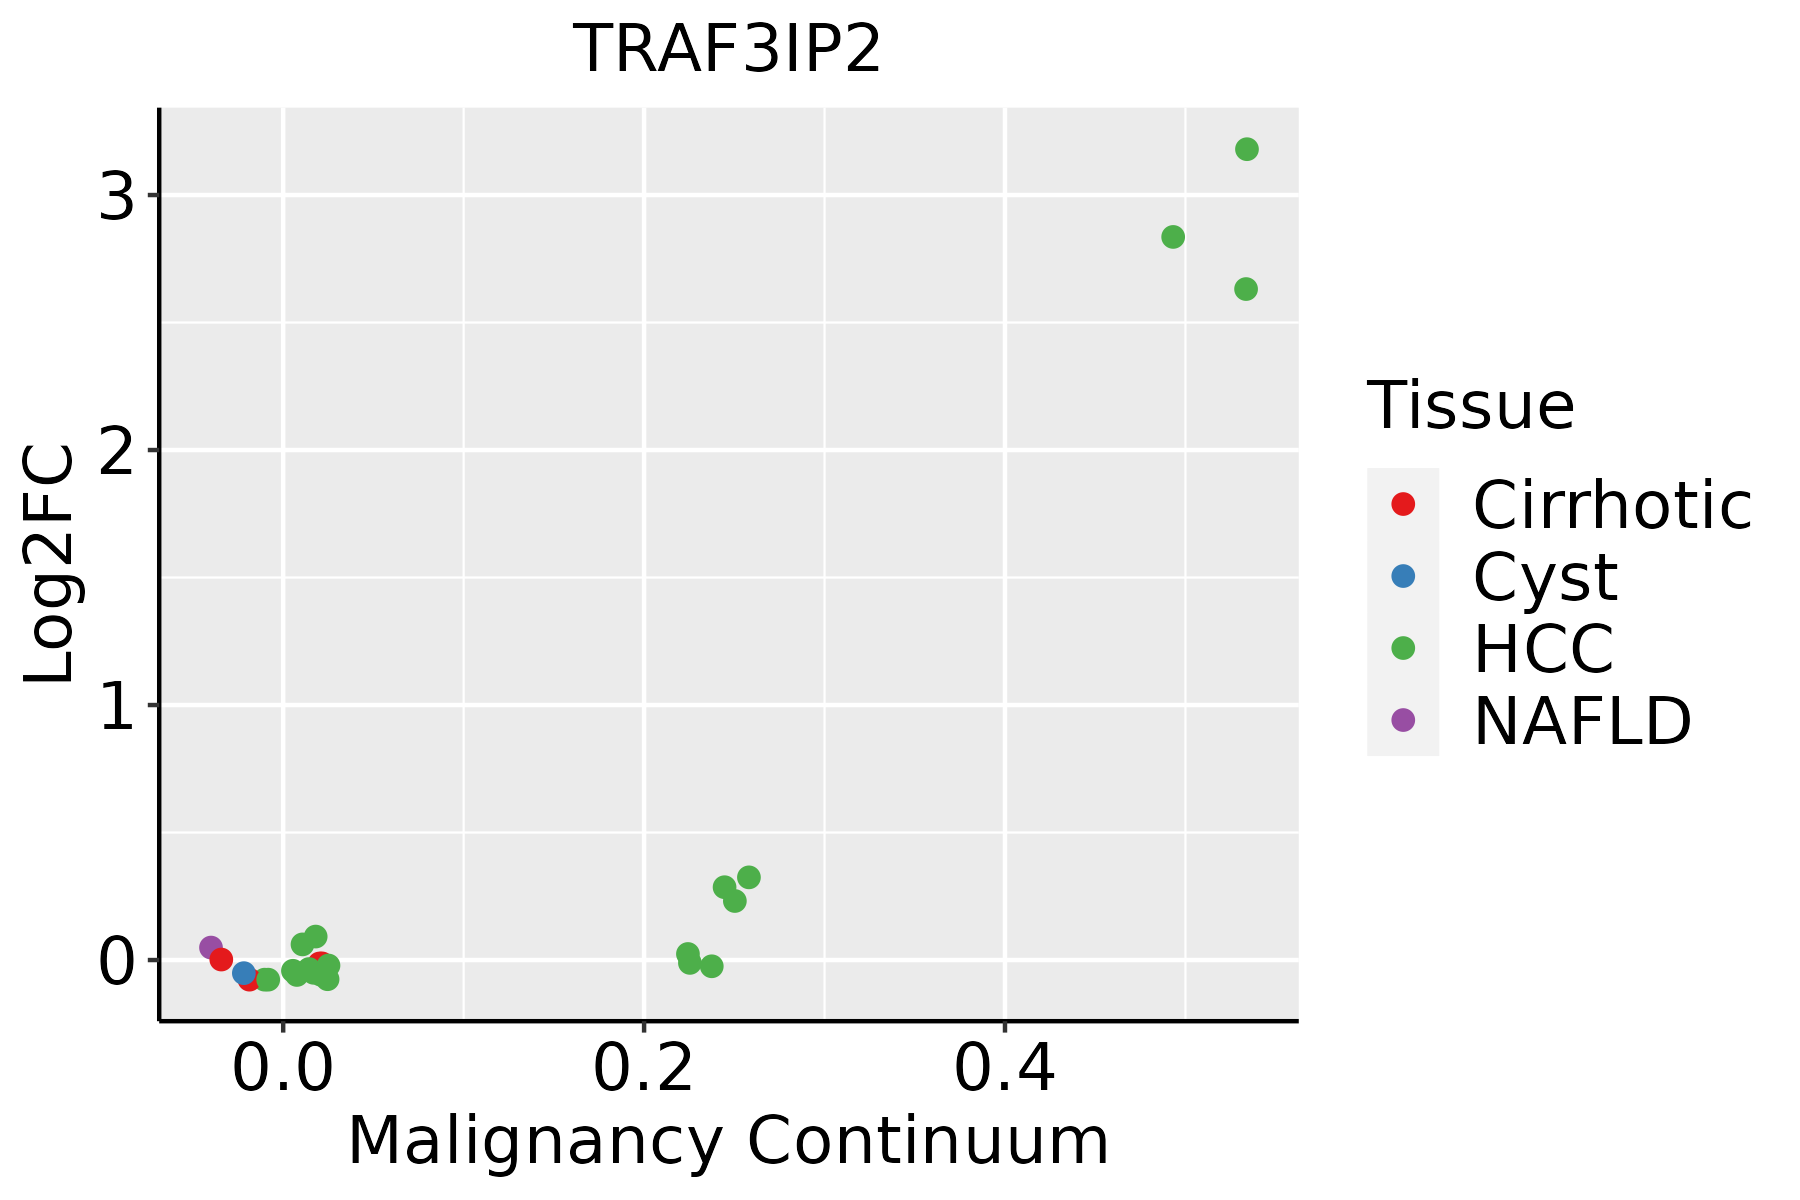 | HCC: Hepatocellular carcinoma |
| NAFLD: Non-alcoholic fatty liver disease | ||
| Oral Cavity | 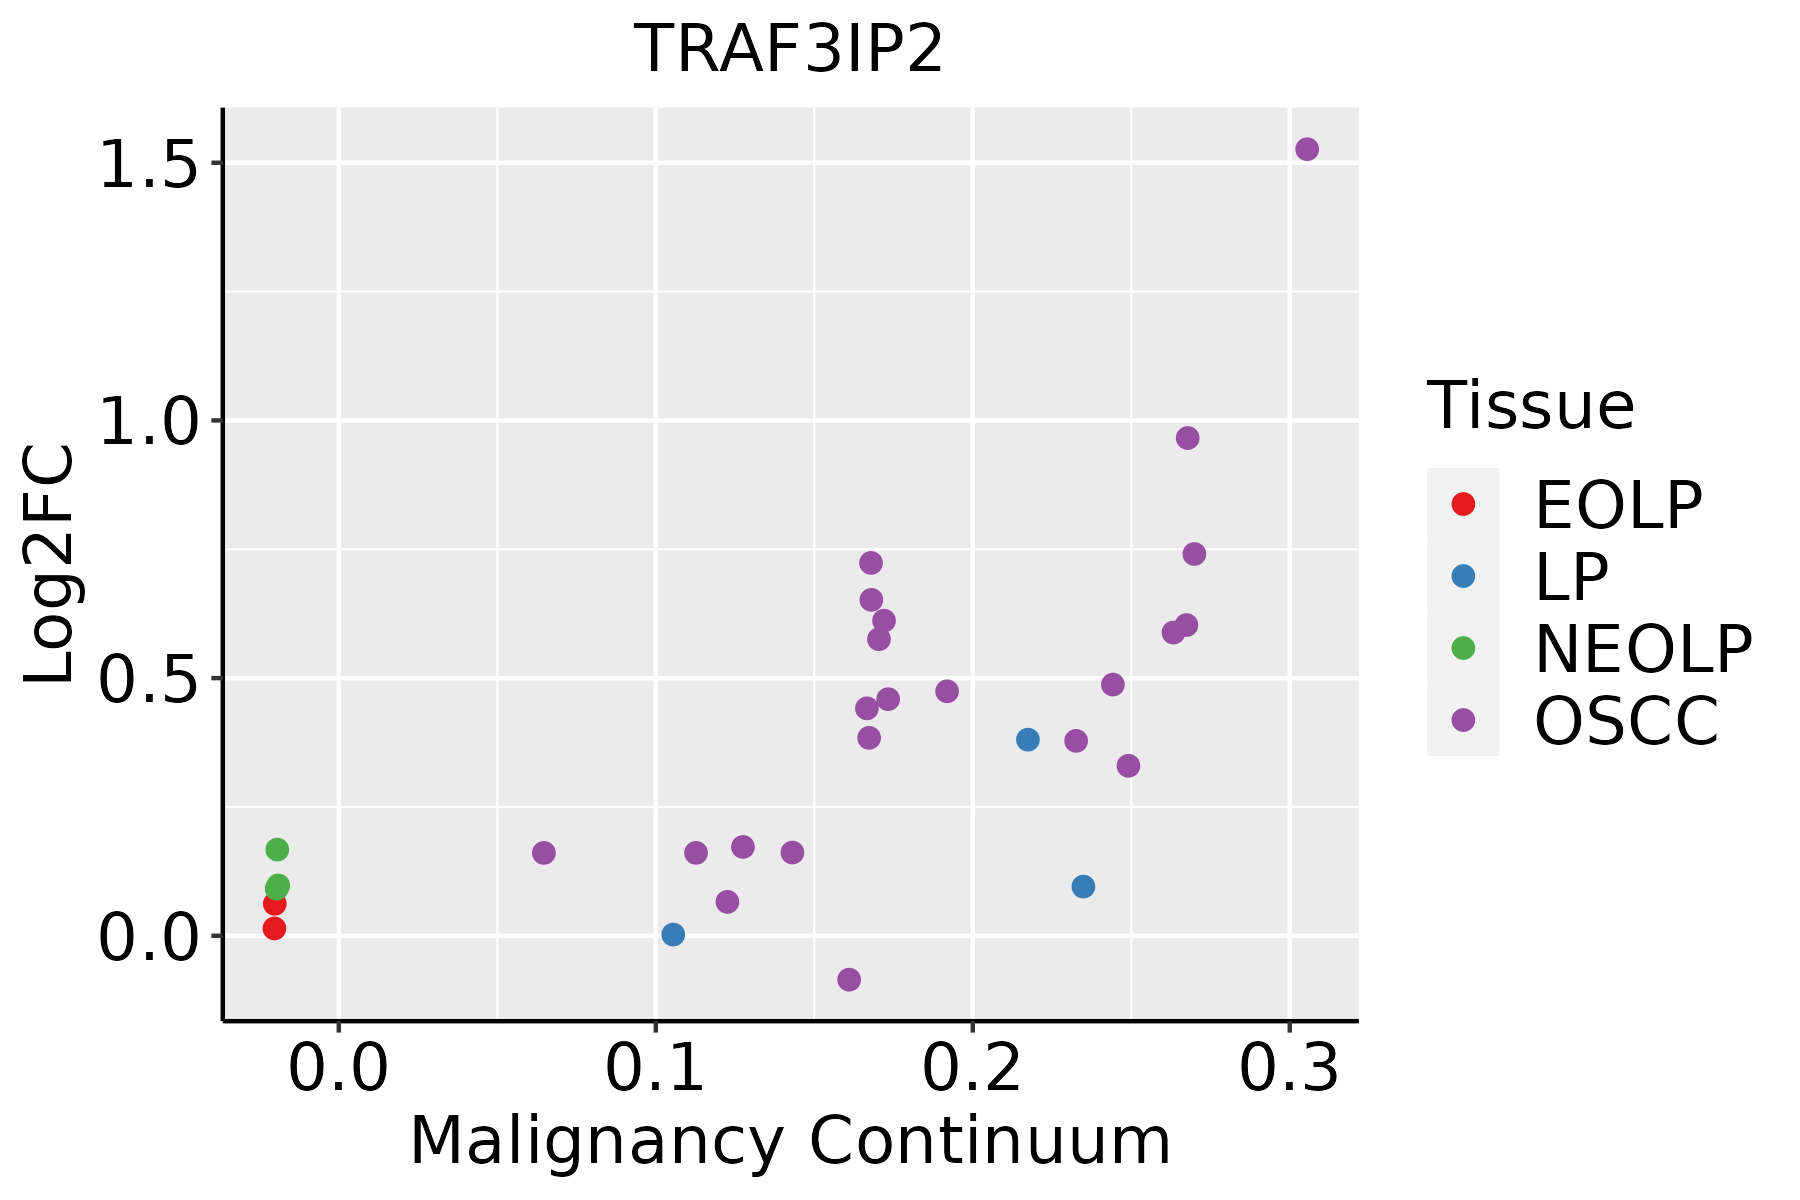 | EOLP: Erosive Oral lichen planus |
| LP: leukoplakia | ||
| NEOLP: Non-erosive oral lichen planus | ||
| OSCC: Oral squamous cell carcinoma | ||
| Skin | 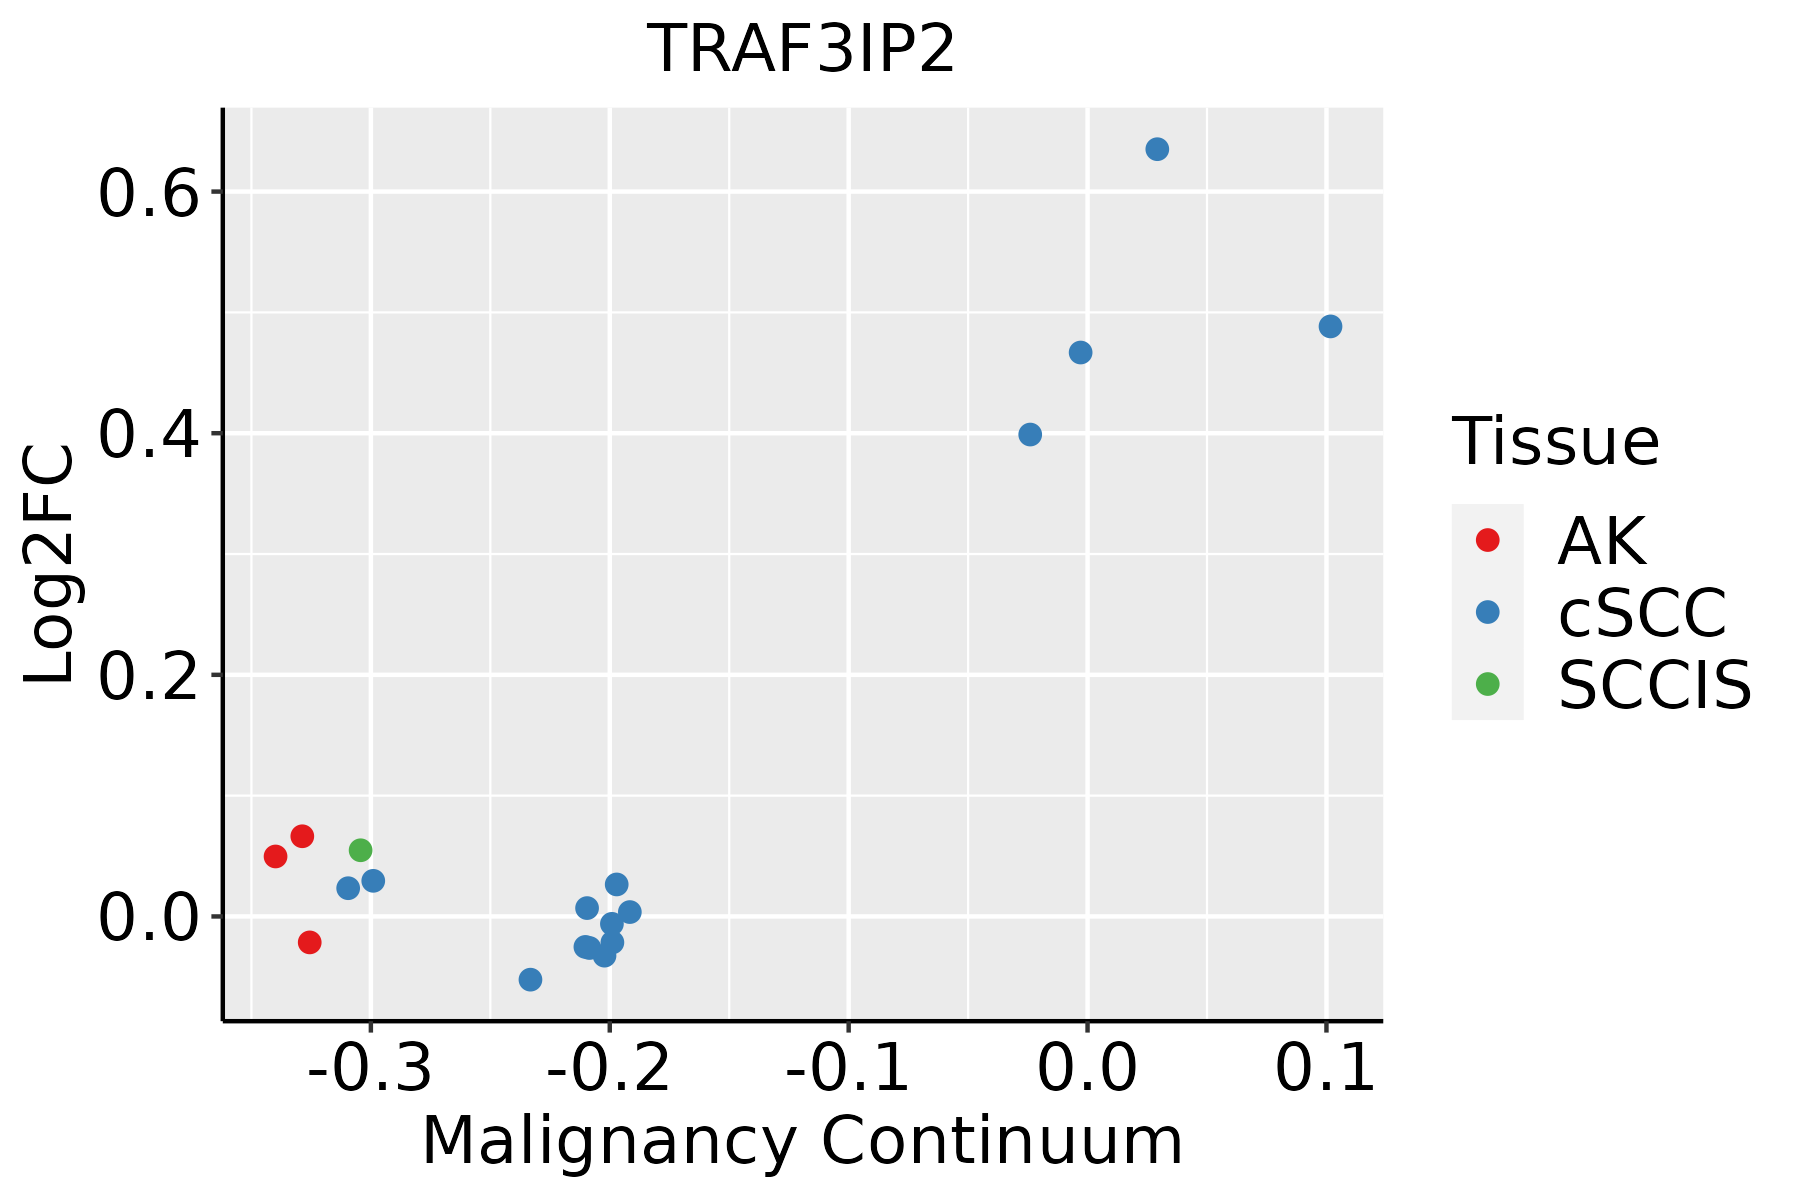 | AK: Actinic keratosis |
| cSCC: Cutaneous squamous cell carcinoma | ||
| SCCIS:squamous cell carcinoma in situ |
| ∗log2FC in expression of this searched gene in stem-like cells from each diseased tissue sample relative to stem-like cells in normal samples in each tissue plotted against the malignancy continuum. Samples are colored based on if they are from different disease stage. |
Top |
Malignant transformation related pathway analysis |
| Find out the enriched GO biological processes and KEGG pathways involved in transition from healthy to precancer to cancer |
| Tissue | Disease Stage | Enriched GO biological Processes |
| Colorectum | AD |  |
| Colorectum | SER |  |
| Colorectum | MSS |  |
| Colorectum | MSI-H |  |
| Colorectum | FAP |  |
| ∗Top 15 enriched GO BP terms are showed in the bar plot of each disease state in each tissue. Each row represents a significant GO biological process which is colored according to the -log10(p.adjust). |
| Page: 1 2 3 4 5 6 7 8 9 |
| GO ID | Tissue | Disease Stage | Description | Gene Ratio | Bg Ratio | pvalue | p.adjust | Count |
| GO:0072594110 | Esophagus | ESCC | establishment of protein localization to organelle | 311/8552 | 422/18723 | 3.02e-32 | 2.13e-29 | 311 |
| GO:0006913110 | Esophagus | ESCC | nucleocytoplasmic transport | 230/8552 | 301/18723 | 6.04e-28 | 2.02e-25 | 230 |
| GO:0051169110 | Esophagus | ESCC | nuclear transport | 230/8552 | 301/18723 | 6.04e-28 | 2.02e-25 | 230 |
| GO:1903311110 | Esophagus | ESCC | regulation of mRNA metabolic process | 210/8552 | 288/18723 | 3.25e-21 | 5.56e-19 | 210 |
| GO:0006401110 | Esophagus | ESCC | RNA catabolic process | 204/8552 | 278/18723 | 3.39e-21 | 5.66e-19 | 204 |
| GO:003450418 | Esophagus | ESCC | protein localization to nucleus | 211/8552 | 290/18723 | 4.06e-21 | 6.60e-19 | 211 |
| GO:0034655110 | Esophagus | ESCC | nucleobase-containing compound catabolic process | 272/8552 | 407/18723 | 2.92e-18 | 2.90e-16 | 272 |
| GO:0006402110 | Esophagus | ESCC | mRNA catabolic process | 170/8552 | 232/18723 | 8.70e-18 | 8.00e-16 | 170 |
| GO:000020917 | Esophagus | ESCC | protein polyubiquitination | 170/8552 | 236/18723 | 1.40e-16 | 1.09e-14 | 170 |
| GO:004670018 | Esophagus | ESCC | heterocycle catabolic process | 286/8552 | 445/18723 | 1.12e-15 | 7.47e-14 | 286 |
| GO:004427019 | Esophagus | ESCC | cellular nitrogen compound catabolic process | 288/8552 | 451/18723 | 3.03e-15 | 1.79e-13 | 288 |
| GO:001703818 | Esophagus | ESCC | protein import | 149/8552 | 206/18723 | 5.90e-15 | 3.31e-13 | 149 |
| GO:001943918 | Esophagus | ESCC | aromatic compound catabolic process | 295/8552 | 467/18723 | 1.09e-14 | 5.98e-13 | 295 |
| GO:000961518 | Esophagus | ESCC | response to virus | 238/8552 | 367/18723 | 6.65e-14 | 3.32e-12 | 238 |
| GO:190136118 | Esophagus | ESCC | organic cyclic compound catabolic process | 307/8552 | 495/18723 | 9.99e-14 | 4.80e-12 | 307 |
| GO:004312318 | Esophagus | ESCC | positive regulation of I-kappaB kinase/NF-kappaB signaling | 132/8552 | 186/18723 | 2.07e-12 | 8.58e-11 | 132 |
| GO:0043122110 | Esophagus | ESCC | regulation of I-kappaB kinase/NF-kappaB signaling | 167/8552 | 249/18723 | 6.11e-12 | 2.32e-10 | 167 |
| GO:000724919 | Esophagus | ESCC | I-kappaB kinase/NF-kappaB signaling | 183/8552 | 281/18723 | 3.02e-11 | 1.01e-09 | 183 |
| GO:0009895111 | Esophagus | ESCC | negative regulation of catabolic process | 201/8552 | 320/18723 | 3.88e-10 | 1.05e-08 | 201 |
| GO:00516075 | Esophagus | ESCC | defense response to virus | 171/8552 | 265/18723 | 3.91e-10 | 1.05e-08 | 171 |
| Page: 1 2 3 4 5 6 7 8 9 10 |
| Pathway ID | Tissue | Disease Stage | Description | Gene Ratio | Bg Ratio | pvalue | p.adjust | qvalue | Count |
| hsa0421829 | Esophagus | ESCC | Cellular senescence | 119/4205 | 156/8465 | 5.89e-12 | 9.40e-11 | 4.81e-11 | 119 |
| hsa0465727 | Esophagus | ESCC | IL-17 signaling pathway | 66/4205 | 94/8465 | 3.93e-05 | 1.75e-04 | 8.99e-05 | 66 |
| hsa0421838 | Esophagus | ESCC | Cellular senescence | 119/4205 | 156/8465 | 5.89e-12 | 9.40e-11 | 4.81e-11 | 119 |
| hsa0465734 | Esophagus | ESCC | IL-17 signaling pathway | 66/4205 | 94/8465 | 3.93e-05 | 1.75e-04 | 8.99e-05 | 66 |
| hsa0421822 | Liver | HCC | Cellular senescence | 102/4020 | 156/8465 | 4.18e-06 | 3.59e-05 | 2.00e-05 | 102 |
| hsa0421832 | Liver | HCC | Cellular senescence | 102/4020 | 156/8465 | 4.18e-06 | 3.59e-05 | 2.00e-05 | 102 |
| hsa0421820 | Oral cavity | OSCC | Cellular senescence | 112/3704 | 156/8465 | 8.04e-13 | 1.42e-11 | 7.21e-12 | 112 |
| hsa0465724 | Oral cavity | OSCC | IL-17 signaling pathway | 64/3704 | 94/8465 | 1.48e-06 | 7.87e-06 | 4.01e-06 | 64 |
| hsa04218110 | Oral cavity | OSCC | Cellular senescence | 112/3704 | 156/8465 | 8.04e-13 | 1.42e-11 | 7.21e-12 | 112 |
| hsa04657112 | Oral cavity | OSCC | IL-17 signaling pathway | 64/3704 | 94/8465 | 1.48e-06 | 7.87e-06 | 4.01e-06 | 64 |
| Page: 1 |
Top |
Cell-cell communication analysis |
| Identification of potential cell-cell interactions between two cell types and their ligand-receptor pairs for different disease states |
| Ligand | Receptor | LRpair | Pathway | Tissue | Disease Stage |
| Page: 1 |
Top |
Single-cell gene regulatory network inference analysis |
| Find out the significant the regulons (TFs) and the target genes of each regulon across cell types for different disease states |
| TF | Cell Type | Tissue | Disease Stage | Target Gene | RSS | Regulon Activity |
| ∗The dot plots of a searched regulon are shown for all cell subpopulations in each disease state of each tissue based on the regulon specific score inferred using pySCENIC and by calculating the average expression. |
| Page: 1 |
Top |
Somatic mutation of malignant transformation related genes |
| Annotation of somatic variants for genes involved in malignant transformation |
| Hugo Symbol | Variant Class | Variant Classification | dbSNP RS | HGVSc | HGVSp | HGVSp Short | SWISSPROT | BIOTYPE | SIFT | PolyPhen | Tumor Sample Barcode | Tissue | Histology | Sex | Age | Stage | Therapy Types | Drugs | Outcome |
| TRAF3IP2 | SNV | Missense_Mutation | novel | c.301N>C | p.Glu101Gln | p.E101Q | O43734 | protein_coding | tolerated(0.06) | possibly_damaging(0.69) | TCGA-JW-A5VL-01 | Cervix | cervical & endocervical cancer | Female | <65 | I/II | Unknown | Unknown | SD |
| TRAF3IP2 | SNV | Missense_Mutation | rs376682410 | c.277C>T | p.Arg93Cys | p.R93C | O43734 | protein_coding | deleterious(0.01) | benign(0.003) | TCGA-AA-A01R-01 | Colorectum | colon adenocarcinoma | Male | <65 | III/IV | Chemotherapy | 5-fluorouracil | PD |
| TRAF3IP2 | SNV | Missense_Mutation | c.73N>A | p.Pro25Thr | p.P25T | O43734 | protein_coding | deleterious_low_confidence(0) | benign(0.338) | TCGA-AZ-6598-01 | Colorectum | colon adenocarcinoma | Female | >=65 | I/II | Unknown | Unknown | SD | |
| TRAF3IP2 | SNV | Missense_Mutation | novel | c.1226N>G | p.Leu409Trp | p.L409W | O43734 | protein_coding | deleterious(0) | probably_damaging(0.994) | TCGA-G4-6304-01 | Colorectum | colon adenocarcinoma | Female | >=65 | I/II | Chemotherapy | fluorouracil | PD |
| TRAF3IP2 | SNV | Missense_Mutation | novel | c.1224N>T | p.Glu408Asp | p.E408D | O43734 | protein_coding | deleterious(0.01) | probably_damaging(0.991) | TCGA-G4-6304-01 | Colorectum | colon adenocarcinoma | Female | >=65 | I/II | Chemotherapy | fluorouracil | PD |
| TRAF3IP2 | SNV | Missense_Mutation | c.1295T>C | p.Leu432Ser | p.L432S | O43734 | protein_coding | tolerated(0.12) | benign(0.018) | TCGA-G4-6628-01 | Colorectum | colon adenocarcinoma | Male | >=65 | I/II | Unknown | Unknown | SD | |
| TRAF3IP2 | SNV | Missense_Mutation | novel | c.202N>T | p.Asp68Tyr | p.D68Y | O43734 | protein_coding | deleterious_low_confidence(0) | benign(0.303) | TCGA-AG-A002-01 | Colorectum | rectum adenocarcinoma | Male | <65 | I/II | Unknown | Unknown | SD |
| TRAF3IP2 | SNV | Missense_Mutation | c.1596N>T | p.Trp532Cys | p.W532C | O43734 | protein_coding | deleterious(0) | probably_damaging(1) | TCGA-AG-A020-01 | Colorectum | rectum adenocarcinoma | Female | <65 | III/IV | Chemotherapy | folinic | CR | |
| TRAF3IP2 | SNV | Missense_Mutation | novel | c.1337N>T | p.Arg446Ile | p.R446I | O43734 | protein_coding | tolerated(0.09) | benign(0.185) | TCGA-EI-6917-01 | Colorectum | rectum adenocarcinoma | Male | <65 | III/IV | Chemotherapy | 5fluorouracil+oxaciplatina+l-folinian | SD |
| TRAF3IP2 | SNV | Missense_Mutation | c.1558N>G | p.Leu520Val | p.L520V | O43734 | protein_coding | deleterious(0.04) | probably_damaging(0.998) | TCGA-F5-6813-01 | Colorectum | rectum adenocarcinoma | Male | >=65 | III/IV | Unknown | Unknown | PD |
| Page: 1 2 3 4 5 |
Top |
Related drugs of malignant transformation related genes |
| Identification of chemicals and drugs interact with genes involved in malignant transfromation |
| (DGIdb 4.0) |
| Entrez ID | Symbol | Category | Interaction Types | Drug Claim Name | Drug Name | PMIDs |
| 10758 | TRAF3IP2 | TRANSCRIPTION FACTOR, KINASE | nevirapine | NEVIRAPINE |
| Page: 1 |

Copyright 2023-Present -The University of Texas Health Science Center at Houston |