
|
|||||
|
 | |
| |
| |
| |
| |
| |
|
Gene: TRAF1 |
Gene summary for TRAF1 |
| Gene information | Species | Human | Gene symbol | TRAF1 | Gene ID | 7185 |
| Gene name | TNF receptor associated factor 1 | |
| Gene Alias | EBI6 | |
| Cytomap | 9q33.2 | |
| Gene Type | protein-coding | GO ID | GO:0000165 | UniProtAcc | Q13077 |
Top |
Malignant transformation analysis |
| Identification of the aberrant gene expression in precancerous and cancerous lesions by comparing the gene expression of stem-like cells in diseased tissues with normal stem cells |
| Entrez ID | Symbol | Replicates | Species | Organ | Tissue | Adj P-value | Log2FC | Malignancy |
| 7185 | TRAF1 | LZE4T | Human | Esophagus | ESCC | 1.20e-04 | 1.96e-01 | 0.0811 |
| 7185 | TRAF1 | LZE20T | Human | Esophagus | ESCC | 4.98e-02 | 1.69e-01 | 0.0662 |
| 7185 | TRAF1 | LZE6T | Human | Esophagus | ESCC | 4.35e-10 | 5.23e-01 | 0.0845 |
| 7185 | TRAF1 | P2T-E | Human | Esophagus | ESCC | 6.17e-07 | 2.95e-01 | 0.1177 |
| 7185 | TRAF1 | P11T-E | Human | Esophagus | ESCC | 6.27e-12 | 8.20e-01 | 0.1426 |
| 7185 | TRAF1 | P19T-E | Human | Esophagus | ESCC | 5.57e-05 | 5.39e-01 | 0.1662 |
| 7185 | TRAF1 | P24T-E | Human | Esophagus | ESCC | 4.91e-05 | 2.60e-01 | 0.1287 |
| 7185 | TRAF1 | P32T-E | Human | Esophagus | ESCC | 1.38e-07 | 3.14e-01 | 0.1666 |
| 7185 | TRAF1 | P36T-E | Human | Esophagus | ESCC | 2.82e-02 | 1.22e-01 | 0.1187 |
| 7185 | TRAF1 | P37T-E | Human | Esophagus | ESCC | 1.24e-21 | 4.72e-01 | 0.1371 |
| 7185 | TRAF1 | P52T-E | Human | Esophagus | ESCC | 2.90e-43 | 1.53e+00 | 0.1555 |
| 7185 | TRAF1 | P83T-E | Human | Esophagus | ESCC | 8.81e-14 | 8.24e-01 | 0.1738 |
| 7185 | TRAF1 | P126T-E | Human | Esophagus | ESCC | 8.75e-03 | 3.00e-01 | 0.1125 |
| 7185 | TRAF1 | P130T-E | Human | Esophagus | ESCC | 3.43e-03 | 1.97e-01 | 0.1676 |
| Page: 1 |
| Tissue | Expression Dynamics | Abbreviation |
| Esophagus | 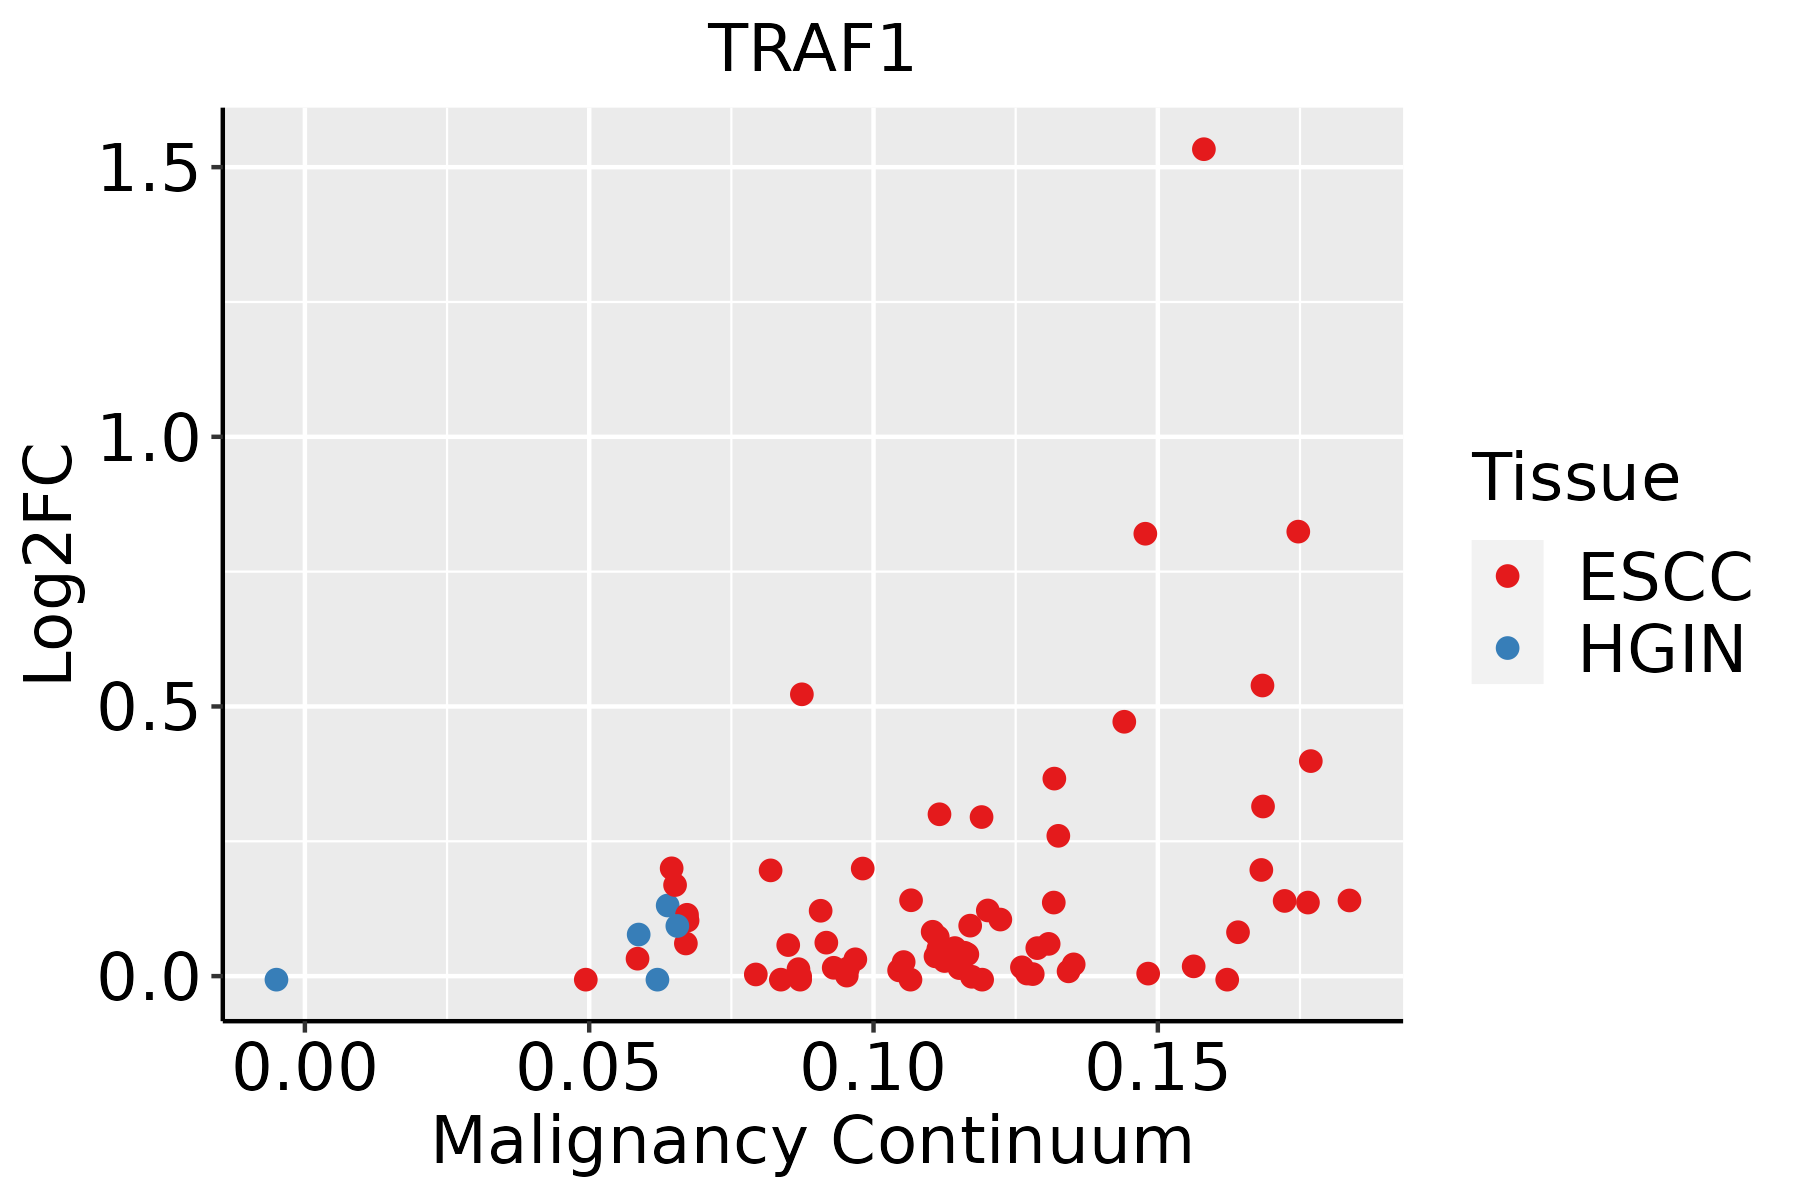 | ESCC: Esophageal squamous cell carcinoma |
| HGIN: High-grade intraepithelial neoplasias | ||
| LGIN: Low-grade intraepithelial neoplasias |
| ∗log2FC in expression of this searched gene in stem-like cells from each diseased tissue sample relative to stem-like cells in normal samples in each tissue plotted against the malignancy continuum. Samples are colored based on if they are from different disease stage. |
Top |
Malignant transformation related pathway analysis |
| Find out the enriched GO biological processes and KEGG pathways involved in transition from healthy to precancer to cancer |
| Tissue | Disease Stage | Enriched GO biological Processes |
| Colorectum | AD |  |
| Colorectum | SER |  |
| Colorectum | MSS |  |
| Colorectum | MSI-H |  |
| Colorectum | FAP |  |
| ∗Top 15 enriched GO BP terms are showed in the bar plot of each disease state in each tissue. Each row represents a significant GO biological process which is colored according to the -log10(p.adjust). |
| Page: 1 2 3 4 5 6 7 8 9 |
| GO ID | Tissue | Disease Stage | Description | Gene Ratio | Bg Ratio | pvalue | p.adjust | Count |
| GO:2001233111 | Esophagus | ESCC | regulation of apoptotic signaling pathway | 256/8552 | 356/18723 | 4.11e-24 | 1.04e-21 | 256 |
| GO:000020917 | Esophagus | ESCC | protein polyubiquitination | 170/8552 | 236/18723 | 1.40e-16 | 1.09e-14 | 170 |
| GO:0097191111 | Esophagus | ESCC | extrinsic apoptotic signaling pathway | 159/8552 | 219/18723 | 4.12e-16 | 2.94e-14 | 159 |
| GO:2001236111 | Esophagus | ESCC | regulation of extrinsic apoptotic signaling pathway | 111/8552 | 151/18723 | 2.97e-12 | 1.18e-10 | 111 |
| GO:0043122110 | Esophagus | ESCC | regulation of I-kappaB kinase/NF-kappaB signaling | 167/8552 | 249/18723 | 6.11e-12 | 2.32e-10 | 167 |
| GO:000724919 | Esophagus | ESCC | I-kappaB kinase/NF-kappaB signaling | 183/8552 | 281/18723 | 3.02e-11 | 1.01e-09 | 183 |
| GO:003109818 | Esophagus | ESCC | stress-activated protein kinase signaling cascade | 154/8552 | 247/18723 | 8.53e-08 | 1.44e-06 | 154 |
| GO:007053413 | Esophagus | ESCC | protein K63-linked ubiquitination | 44/8552 | 56/18723 | 4.84e-07 | 6.50e-06 | 44 |
| GO:00510908 | Esophagus | ESCC | regulation of DNA-binding transcription factor activity | 252/8552 | 440/18723 | 5.22e-07 | 6.97e-06 | 252 |
| GO:005140318 | Esophagus | ESCC | stress-activated MAPK cascade | 147/8552 | 239/18723 | 5.43e-07 | 7.18e-06 | 147 |
| GO:00510918 | Esophagus | ESCC | positive regulation of DNA-binding transcription factor activity | 155/8552 | 260/18723 | 3.83e-06 | 4.14e-05 | 155 |
| GO:003320914 | Esophagus | ESCC | tumor necrosis factor-mediated signaling pathway | 67/8552 | 99/18723 | 7.87e-06 | 7.72e-05 | 67 |
| GO:007030217 | Esophagus | ESCC | regulation of stress-activated protein kinase signaling cascade | 119/8552 | 195/18723 | 1.07e-05 | 1.01e-04 | 119 |
| GO:003461220 | Esophagus | ESCC | response to tumor necrosis factor | 149/8552 | 253/18723 | 1.47e-05 | 1.33e-04 | 149 |
| GO:003287217 | Esophagus | ESCC | regulation of stress-activated MAPK cascade | 116/8552 | 192/18723 | 2.63e-05 | 2.21e-04 | 116 |
| GO:00072549 | Esophagus | ESCC | JNK cascade | 102/8552 | 167/18723 | 4.22e-05 | 3.39e-04 | 102 |
| GO:007135620 | Esophagus | ESCC | cellular response to tumor necrosis factor | 132/8552 | 229/18723 | 1.69e-04 | 1.11e-03 | 132 |
| GO:00510926 | Esophagus | ESCC | positive regulation of NF-kappaB transcription factor activity | 91/8552 | 152/18723 | 2.91e-04 | 1.75e-03 | 91 |
| GO:00463289 | Esophagus | ESCC | regulation of JNK cascade | 80/8552 | 133/18723 | 5.35e-04 | 2.95e-03 | 80 |
| GO:00703046 | Esophagus | ESCC | positive regulation of stress-activated protein kinase signaling cascade | 74/8552 | 128/18723 | 3.77e-03 | 1.53e-02 | 74 |
| Page: 1 2 |
| Pathway ID | Tissue | Disease Stage | Description | Gene Ratio | Bg Ratio | pvalue | p.adjust | qvalue | Count |
| hsa0466810 | Esophagus | ESCC | TNF signaling pathway | 89/4205 | 114/8465 | 3.36e-10 | 4.01e-09 | 2.06e-09 | 89 |
| hsa0421027 | Esophagus | ESCC | Apoptosis | 102/4205 | 136/8465 | 1.05e-09 | 1.21e-08 | 6.21e-09 | 102 |
| hsa0520325 | Esophagus | ESCC | Viral carcinogenesis | 137/4205 | 204/8465 | 2.47e-07 | 1.88e-06 | 9.62e-07 | 137 |
| hsa052229 | Esophagus | ESCC | Small cell lung cancer | 69/4205 | 92/8465 | 5.40e-07 | 3.85e-06 | 1.97e-06 | 69 |
| hsa040645 | Esophagus | ESCC | NF-kappa B signaling pathway | 67/4205 | 104/8465 | 1.62e-03 | 4.89e-03 | 2.50e-03 | 67 |
| hsa052028 | Esophagus | ESCC | Transcriptional misregulation in cancer | 116/4205 | 193/8465 | 2.08e-03 | 5.95e-03 | 3.05e-03 | 116 |
| hsa0466817 | Esophagus | ESCC | TNF signaling pathway | 89/4205 | 114/8465 | 3.36e-10 | 4.01e-09 | 2.06e-09 | 89 |
| hsa0421037 | Esophagus | ESCC | Apoptosis | 102/4205 | 136/8465 | 1.05e-09 | 1.21e-08 | 6.21e-09 | 102 |
| hsa0520335 | Esophagus | ESCC | Viral carcinogenesis | 137/4205 | 204/8465 | 2.47e-07 | 1.88e-06 | 9.62e-07 | 137 |
| hsa0522216 | Esophagus | ESCC | Small cell lung cancer | 69/4205 | 92/8465 | 5.40e-07 | 3.85e-06 | 1.97e-06 | 69 |
| hsa0406412 | Esophagus | ESCC | NF-kappa B signaling pathway | 67/4205 | 104/8465 | 1.62e-03 | 4.89e-03 | 2.50e-03 | 67 |
| hsa0520213 | Esophagus | ESCC | Transcriptional misregulation in cancer | 116/4205 | 193/8465 | 2.08e-03 | 5.95e-03 | 3.05e-03 | 116 |
| Page: 1 |
Top |
Cell-cell communication analysis |
| Identification of potential cell-cell interactions between two cell types and their ligand-receptor pairs for different disease states |
| Ligand | Receptor | LRpair | Pathway | Tissue | Disease Stage |
| Page: 1 |
Top |
Single-cell gene regulatory network inference analysis |
| Find out the significant the regulons (TFs) and the target genes of each regulon across cell types for different disease states |
| TF | Cell Type | Tissue | Disease Stage | Target Gene | RSS | Regulon Activity |
| ∗The dot plots of a searched regulon are shown for all cell subpopulations in each disease state of each tissue based on the regulon specific score inferred using pySCENIC and by calculating the average expression. |
| Page: 1 |
Top |
Somatic mutation of malignant transformation related genes |
| Annotation of somatic variants for genes involved in malignant transformation |
| Hugo Symbol | Variant Class | Variant Classification | dbSNP RS | HGVSc | HGVSp | HGVSp Short | SWISSPROT | BIOTYPE | SIFT | PolyPhen | Tumor Sample Barcode | Tissue | Histology | Sex | Age | Stage | Therapy Types | Drugs | Outcome |
| TRAF1 | SNV | Missense_Mutation | c.1006C>G | p.Leu336Val | p.L336V | Q13077 | protein_coding | deleterious(0) | benign(0.117) | TCGA-B6-A0IJ-01 | Breast | breast invasive carcinoma | Female | <65 | I/II | Unknown | Unknown | SD | |
| TRAF1 | SNV | Missense_Mutation | c.538N>T | p.His180Tyr | p.H180Y | Q13077 | protein_coding | deleterious(0.04) | benign(0.007) | TCGA-BH-A0HF-01 | Breast | breast invasive carcinoma | Female | >=65 | I/II | Hormone Therapy | arimidex | SD | |
| TRAF1 | SNV | Missense_Mutation | novel | c.247N>A | p.Glu83Lys | p.E83K | Q13077 | protein_coding | tolerated(1) | benign(0) | TCGA-LD-A74U-01 | Breast | breast invasive carcinoma | Female | >=65 | III/IV | Chemotherapy | taxotere | SD |
| TRAF1 | SNV | Missense_Mutation | rs757877072 | c.266N>T | p.Pro89Leu | p.P89L | Q13077 | protein_coding | tolerated(0.2) | benign(0.065) | TCGA-DG-A2KH-01 | Cervix | cervical & endocervical cancer | Female | <65 | I/II | Unknown | Unknown | SD |
| TRAF1 | SNV | Missense_Mutation | novel | c.190N>C | p.Ser64Pro | p.S64P | Q13077 | protein_coding | tolerated(0.25) | benign(0) | TCGA-AA-3663-01 | Colorectum | colon adenocarcinoma | Male | <65 | I/II | Unknown | Unknown | SD |
| TRAF1 | SNV | Missense_Mutation | novel | c.956G>A | p.Arg319Lys | p.R319K | Q13077 | protein_coding | tolerated(0.16) | benign(0) | TCGA-AA-3852-01 | Colorectum | colon adenocarcinoma | Male | >=65 | I/II | Unknown | Unknown | PD |
| TRAF1 | SNV | Missense_Mutation | novel | c.954G>T | p.Lys318Asn | p.K318N | Q13077 | protein_coding | deleterious(0) | possibly_damaging(0.81) | TCGA-AA-3852-01 | Colorectum | colon adenocarcinoma | Male | >=65 | I/II | Unknown | Unknown | PD |
| TRAF1 | SNV | Missense_Mutation | rs759221945 | c.209G>A | p.Arg70His | p.R70H | Q13077 | protein_coding | tolerated(0.57) | benign(0) | TCGA-AA-3984-01 | Colorectum | colon adenocarcinoma | Female | <65 | I/II | Unknown | Unknown | SD |
| TRAF1 | SNV | Missense_Mutation | rs560261396 | c.583C>T | p.Arg195Cys | p.R195C | Q13077 | protein_coding | tolerated(0.19) | benign(0) | TCGA-AZ-6598-01 | Colorectum | colon adenocarcinoma | Female | >=65 | I/II | Unknown | Unknown | SD |
| TRAF1 | SNV | Missense_Mutation | c.225N>T | p.Glu75Asp | p.E75D | Q13077 | protein_coding | tolerated(0.18) | benign(0.1) | TCGA-CM-5868-01 | Colorectum | colon adenocarcinoma | Female | <65 | I/II | Chemotherapy | fluorouracil | SD |
| Page: 1 2 3 4 |
Top |
Related drugs of malignant transformation related genes |
| Identification of chemicals and drugs interact with genes involved in malignant transfromation |
| (DGIdb 4.0) |
| Entrez ID | Symbol | Category | Interaction Types | Drug Claim Name | Drug Name | PMIDs |
| 7185 | TRAF1 | NA | adalimumab | ADALIMUMAB | 23007924 | |
| 7185 | TRAF1 | NA | infliximab | INFLIXIMAB | 23007924 | |
| 7185 | TRAF1 | NA | Tumor necrosis factor alpha (TNF-alpha) inhibitors | 23007924 | ||
| 7185 | TRAF1 | NA | etanercept | ETANERCEPT | 23007924 |
| Page: 1 |

Copyright 2023-Present -The University of Texas Health Science Center at Houston |