
|
|||||
|
 | |
| |
| |
| |
| |
| |
|
Gene: TRABD2A |
Gene summary for TRABD2A |
| Gene information | Species | Human | Gene symbol | TRABD2A | Gene ID | 129293 |
| Gene name | TraB domain containing 2A | |
| Gene Alias | C2orf89 | |
| Cytomap | 2p11.2 | |
| Gene Type | protein-coding | GO ID | GO:0006464 | UniProtAcc | Q86V40 |
Top |
Malignant transformation analysis |
| Identification of the aberrant gene expression in precancerous and cancerous lesions by comparing the gene expression of stem-like cells in diseased tissues with normal stem cells |
| Entrez ID | Symbol | Replicates | Species | Organ | Tissue | Adj P-value | Log2FC | Malignancy |
| 129293 | TRABD2A | HTA11_347_2000001011 | Human | Colorectum | AD | 4.27e-32 | 1.36e+00 | -0.1954 |
| 129293 | TRABD2A | HTA11_411_2000001011 | Human | Colorectum | SER | 3.58e-02 | 1.94e-01 | -0.2602 |
| 129293 | TRABD2A | HTA11_83_2000001011 | Human | Colorectum | SER | 1.60e-06 | 7.04e-01 | -0.1526 |
| 129293 | TRABD2A | HTA11_1391_2000001011 | Human | Colorectum | AD | 1.63e-04 | 5.56e-01 | -0.059 |
| 129293 | TRABD2A | HTA11_2992_2000001011 | Human | Colorectum | SER | 9.15e-05 | 4.07e-01 | -0.1706 |
| 129293 | TRABD2A | HTA11_9341_2000001011 | Human | Colorectum | SER | 1.89e-08 | 8.05e-01 | -0.00410000000000005 |
| 129293 | TRABD2A | HTA11_7862_2000001011 | Human | Colorectum | AD | 2.10e-23 | 1.08e+00 | -0.0179 |
| 129293 | TRABD2A | HTA11_8622_2000001021 | Human | Colorectum | SER | 2.16e-04 | 7.05e-01 | 0.0528 |
| 129293 | TRABD2A | HTA11_7663_2000001011 | Human | Colorectum | SER | 1.63e-15 | 9.77e-01 | 0.0131 |
| 129293 | TRABD2A | HTA11_10623_2000001011 | Human | Colorectum | AD | 1.47e-12 | 9.50e-01 | -0.0177 |
| 129293 | TRABD2A | HTA11_6801_2000001011 | Human | Colorectum | SER | 1.69e-07 | 1.06e+00 | 0.0171 |
| 129293 | TRABD2A | HTA11_7469_2000001011 | Human | Colorectum | AD | 1.03e-15 | 1.15e+00 | -0.0124 |
| 129293 | TRABD2A | HTA11_6818_2000001021 | Human | Colorectum | AD | 1.97e-07 | 7.24e-01 | 0.0588 |
| 129293 | TRABD2A | HTA11_99999970781_79442 | Human | Colorectum | MSS | 6.13e-05 | 5.28e-01 | 0.294 |
| 129293 | TRABD2A | HTA11_99999965104_69814 | Human | Colorectum | MSS | 1.13e-07 | 6.47e-01 | 0.281 |
| 129293 | TRABD2A | HTA11_99999974143_84620 | Human | Colorectum | MSS | 5.53e-05 | -3.99e-01 | 0.3005 |
| 129293 | TRABD2A | F007 | Human | Colorectum | FAP | 6.24e-26 | -9.62e-01 | 0.1176 |
| 129293 | TRABD2A | A002-C-010 | Human | Colorectum | FAP | 1.22e-21 | -7.08e-01 | 0.242 |
| 129293 | TRABD2A | A001-C-207 | Human | Colorectum | FAP | 5.07e-16 | -6.16e-01 | 0.1278 |
| 129293 | TRABD2A | A015-C-203 | Human | Colorectum | FAP | 5.93e-39 | -6.89e-01 | -0.1294 |
| Page: 1 2 3 |
| Tissue | Expression Dynamics | Abbreviation |
| Colorectum (GSE201348) |  | FAP: Familial adenomatous polyposis |
| CRC: Colorectal cancer | ||
| Colorectum (HTA11) |  | AD: Adenomas |
| SER: Sessile serrated lesions | ||
| MSI-H: Microsatellite-high colorectal cancer | ||
| MSS: Microsatellite stable colorectal cancer | ||
| Liver | 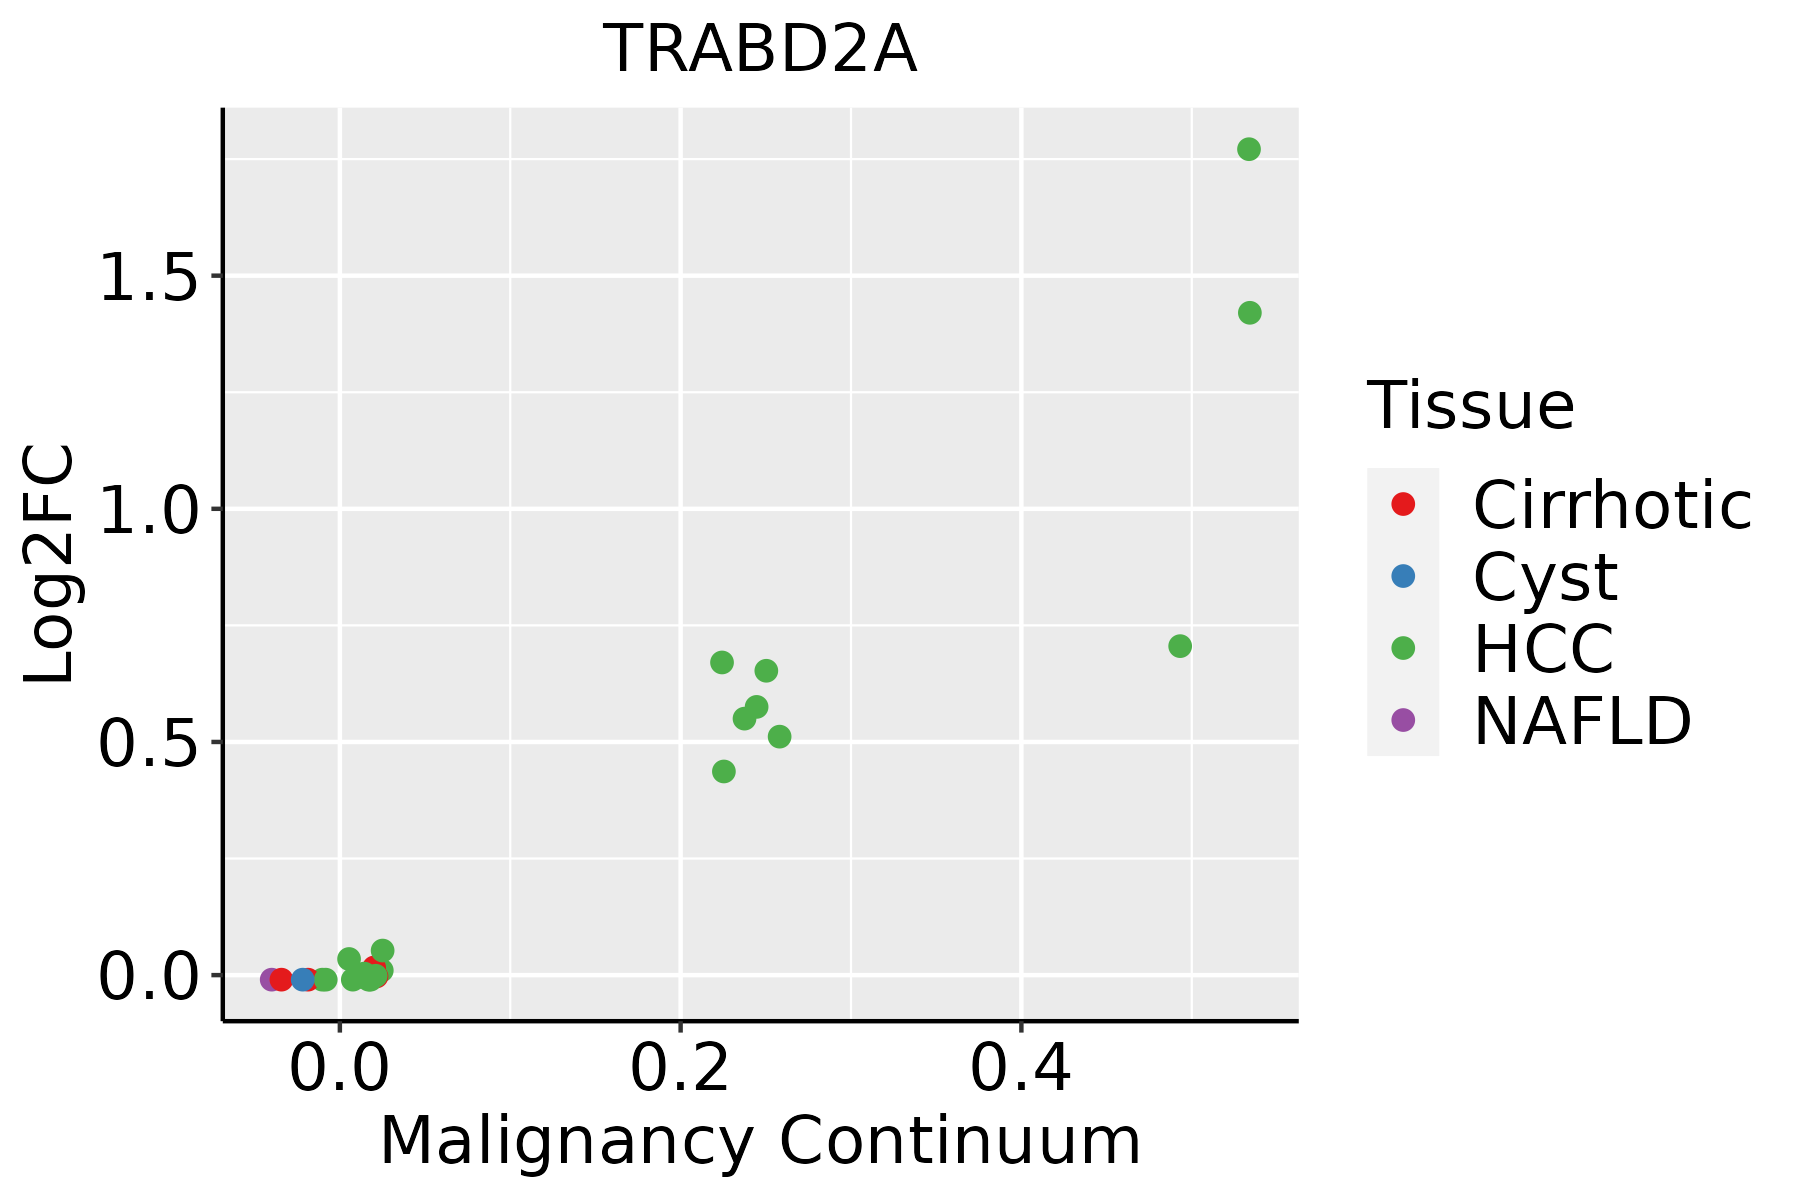 | HCC: Hepatocellular carcinoma |
| NAFLD: Non-alcoholic fatty liver disease | ||
| Oral Cavity | 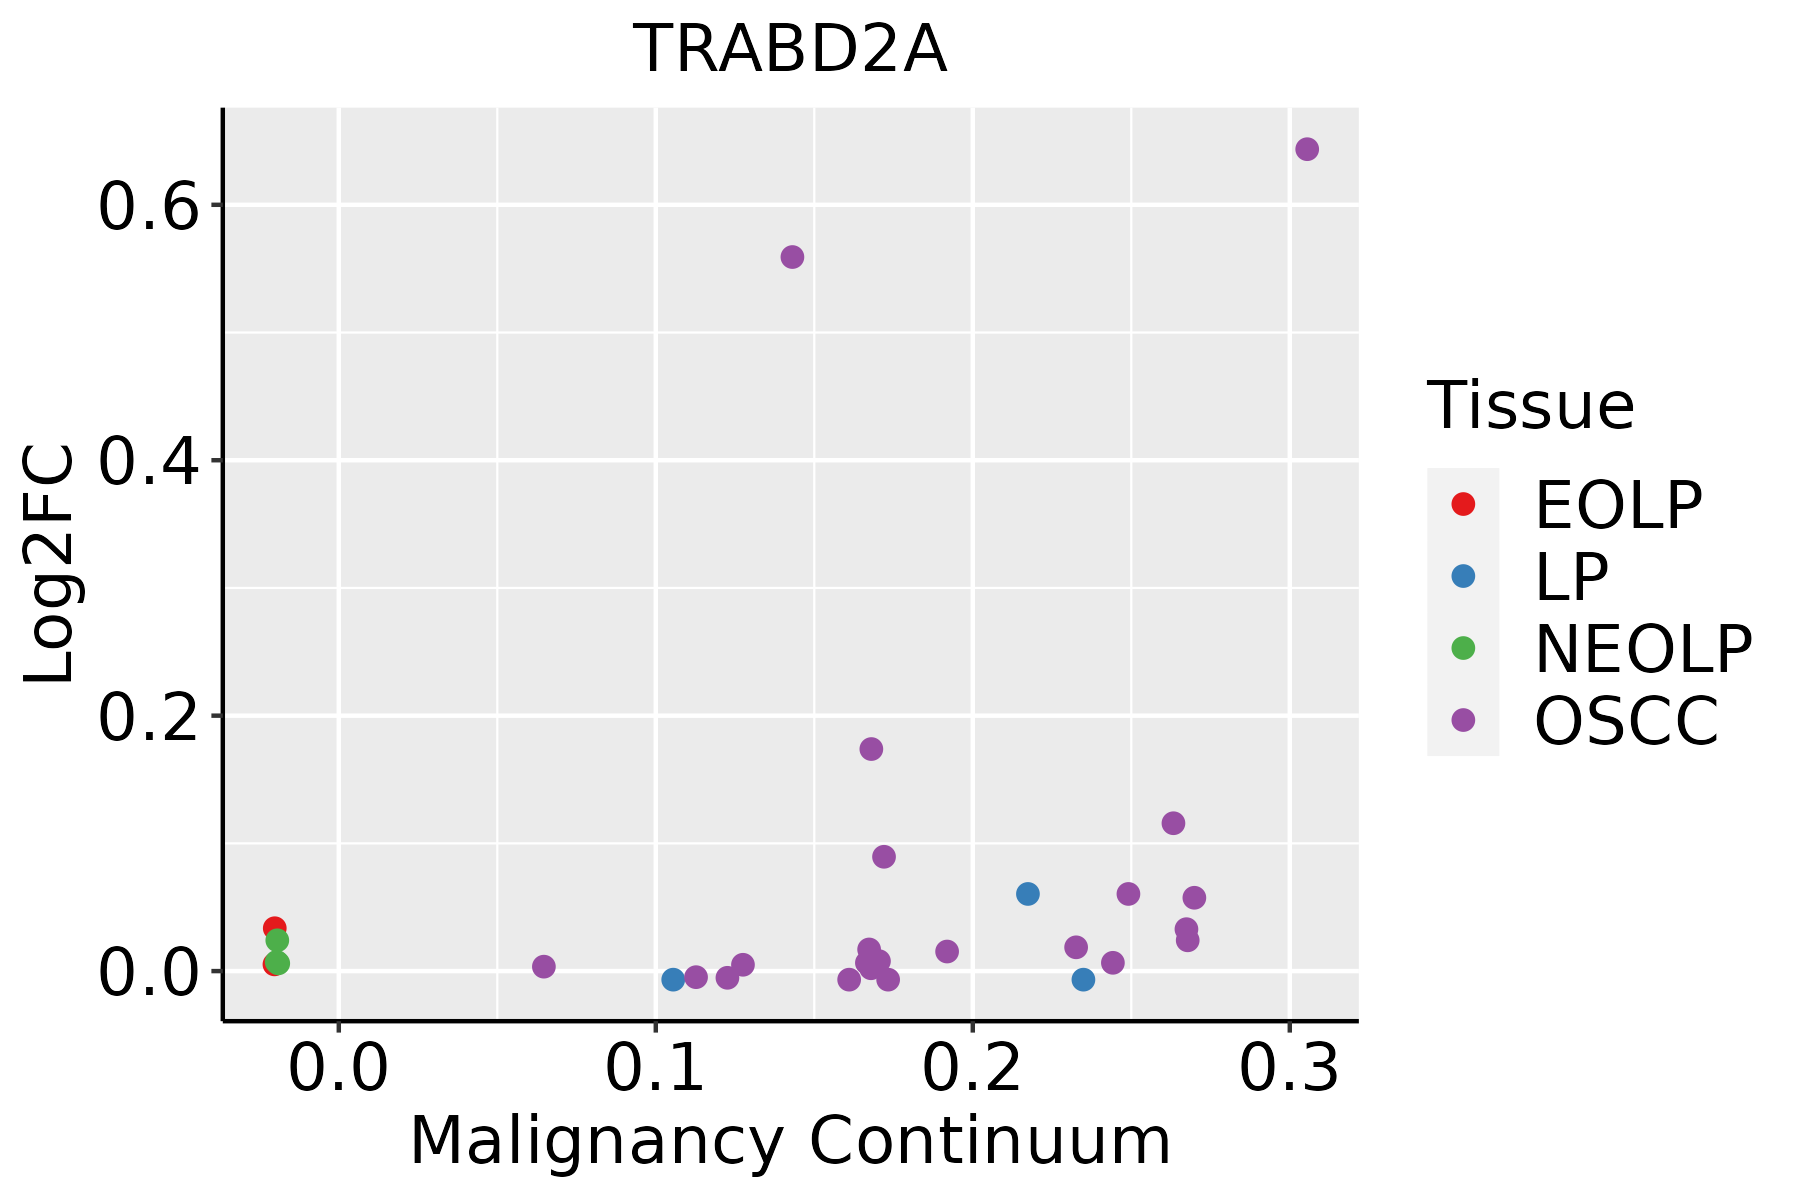 | EOLP: Erosive Oral lichen planus |
| LP: leukoplakia | ||
| NEOLP: Non-erosive oral lichen planus | ||
| OSCC: Oral squamous cell carcinoma |
| ∗log2FC in expression of this searched gene in stem-like cells from each diseased tissue sample relative to stem-like cells in normal samples in each tissue plotted against the malignancy continuum. Samples are colored based on if they are from different disease stage. |
Top |
Malignant transformation related pathway analysis |
| Find out the enriched GO biological processes and KEGG pathways involved in transition from healthy to precancer to cancer |
| Tissue | Disease Stage | Enriched GO biological Processes |
| Colorectum | AD |  |
| Colorectum | SER |  |
| Colorectum | MSS |  |
| Colorectum | MSI-H |  |
| Colorectum | FAP |  |
| ∗Top 15 enriched GO BP terms are showed in the bar plot of each disease state in each tissue. Each row represents a significant GO biological process which is colored according to the -log10(p.adjust). |
| Page: 1 2 3 4 5 6 7 8 9 |
| GO ID | Tissue | Disease Stage | Description | Gene Ratio | Bg Ratio | pvalue | p.adjust | Count |
| GO:0043254 | Colorectum | AD | regulation of protein-containing complex assembly | 148/3918 | 428/18723 | 2.64e-11 | 3.18e-09 | 148 |
| GO:0031334 | Colorectum | AD | positive regulation of protein-containing complex assembly | 91/3918 | 237/18723 | 4.78e-10 | 3.99e-08 | 91 |
| GO:0030111 | Colorectum | AD | regulation of Wnt signaling pathway | 102/3918 | 328/18723 | 8.51e-06 | 2.03e-04 | 102 |
| GO:0016055 | Colorectum | AD | Wnt signaling pathway | 130/3918 | 444/18723 | 1.60e-05 | 3.37e-04 | 130 |
| GO:0198738 | Colorectum | AD | cell-cell signaling by wnt | 130/3918 | 446/18723 | 2.02e-05 | 4.10e-04 | 130 |
| GO:00432541 | Colorectum | SER | regulation of protein-containing complex assembly | 119/2897 | 428/18723 | 3.34e-11 | 5.86e-09 | 119 |
| GO:00313341 | Colorectum | SER | positive regulation of protein-containing complex assembly | 73/2897 | 237/18723 | 1.89e-09 | 1.84e-07 | 73 |
| GO:00160551 | Colorectum | SER | Wnt signaling pathway | 97/2897 | 444/18723 | 2.02e-04 | 3.68e-03 | 97 |
| GO:01987381 | Colorectum | SER | cell-cell signaling by wnt | 97/2897 | 446/18723 | 2.39e-04 | 4.11e-03 | 97 |
| GO:00301111 | Colorectum | SER | regulation of Wnt signaling pathway | 75/2897 | 328/18723 | 2.47e-04 | 4.20e-03 | 75 |
| GO:00432542 | Colorectum | MSS | regulation of protein-containing complex assembly | 130/3467 | 428/18723 | 1.38e-09 | 1.03e-07 | 130 |
| GO:00313342 | Colorectum | MSS | positive regulation of protein-containing complex assembly | 82/3467 | 237/18723 | 2.49e-09 | 1.75e-07 | 82 |
| GO:00301112 | Colorectum | MSS | regulation of Wnt signaling pathway | 98/3467 | 328/18723 | 3.37e-07 | 1.36e-05 | 98 |
| GO:00160552 | Colorectum | MSS | Wnt signaling pathway | 124/3467 | 444/18723 | 6.06e-07 | 2.26e-05 | 124 |
| GO:01987382 | Colorectum | MSS | cell-cell signaling by wnt | 124/3467 | 446/18723 | 7.83e-07 | 2.77e-05 | 124 |
| GO:0030178 | Colorectum | MSS | negative regulation of Wnt signaling pathway | 48/3467 | 170/18723 | 1.23e-03 | 1.18e-02 | 48 |
| GO:00160553 | Colorectum | FAP | Wnt signaling pathway | 104/2622 | 444/18723 | 4.92e-08 | 3.92e-06 | 104 |
| GO:00432544 | Colorectum | FAP | regulation of protein-containing complex assembly | 101/2622 | 428/18723 | 5.18e-08 | 4.07e-06 | 101 |
| GO:01987383 | Colorectum | FAP | cell-cell signaling by wnt | 104/2622 | 446/18723 | 6.26e-08 | 4.54e-06 | 104 |
| GO:00301113 | Colorectum | FAP | regulation of Wnt signaling pathway | 81/2622 | 328/18723 | 1.44e-07 | 9.03e-06 | 81 |
| Page: 1 2 |
| Pathway ID | Tissue | Disease Stage | Description | Gene Ratio | Bg Ratio | pvalue | p.adjust | qvalue | Count |
| Page: 1 |
Top |
Cell-cell communication analysis |
| Identification of potential cell-cell interactions between two cell types and their ligand-receptor pairs for different disease states |
| Ligand | Receptor | LRpair | Pathway | Tissue | Disease Stage |
| Page: 1 |
Top |
Single-cell gene regulatory network inference analysis |
| Find out the significant the regulons (TFs) and the target genes of each regulon across cell types for different disease states |
| TF | Cell Type | Tissue | Disease Stage | Target Gene | RSS | Regulon Activity |
| ∗The dot plots of a searched regulon are shown for all cell subpopulations in each disease state of each tissue based on the regulon specific score inferred using pySCENIC and by calculating the average expression. |
| Page: 1 |
Top |
Somatic mutation of malignant transformation related genes |
| Annotation of somatic variants for genes involved in malignant transformation |
| Hugo Symbol | Variant Class | Variant Classification | dbSNP RS | HGVSc | HGVSp | HGVSp Short | SWISSPROT | BIOTYPE | SIFT | PolyPhen | Tumor Sample Barcode | Tissue | Histology | Sex | Age | Stage | Therapy Types | Drugs | Outcome |
| TRABD2A | SNV | Missense_Mutation | novel | c.165C>G | p.Phe55Leu | p.F55L | Q86V40 | protein_coding | tolerated(0.7) | benign(0.08) | TCGA-5L-AAT1-01 | Breast | breast invasive carcinoma | Female | <65 | III/IV | Hormone Therapy | letrozol | SD |
| TRABD2A | SNV | Missense_Mutation | novel | c.1261N>G | p.Lys421Glu | p.K421E | Q86V40 | protein_coding | deleterious(0.03) | benign(0.131) | TCGA-A7-A6VX-01 | Breast | breast invasive carcinoma | Female | >=65 | I/II | Chemotherapy | docetaxel | CR |
| TRABD2A | SNV | Missense_Mutation | rs745429009 | c.1246G>A | p.Glu416Lys | p.E416K | Q86V40 | protein_coding | tolerated(0.08) | benign(0.06) | TCGA-BH-A0B4-01 | Breast | breast invasive carcinoma | Male | >=65 | III/IV | Hormone Therapy | tamoxiphen | SD |
| TRABD2A | SNV | Missense_Mutation | rs747516201 | c.1297N>T | p.Arg433Trp | p.R433W | Q86V40 | protein_coding | deleterious_low_confidence(0) | possibly_damaging(0.63) | TCGA-BH-A0HK-01 | Breast | breast invasive carcinoma | Female | >=65 | I/II | Hormone Therapy | arimidex | SD |
| TRABD2A | SNV | Missense_Mutation | c.1128N>G | p.Ile376Met | p.I376M | Q86V40 | protein_coding | tolerated_low_confidence(0.25) | benign(0.048) | TCGA-BH-A0HP-01 | Breast | breast invasive carcinoma | Female | >=65 | III/IV | Chemotherapy | doxorubicin | SD | |
| TRABD2A | SNV | Missense_Mutation | rs766579273 | c.562N>G | p.Leu188Val | p.L188V | Q86V40 | protein_coding | deleterious(0) | probably_damaging(0.992) | TCGA-E2-A14N-01 | Breast | breast invasive carcinoma | Female | <65 | I/II | Chemotherapy | cyclophosphamide | SD |
| TRABD2A | SNV | Missense_Mutation | c.976N>A | p.Phe326Ile | p.F326I | Q86V40 | protein_coding | deleterious(0) | possibly_damaging(0.629) | TCGA-E2-A14W-01 | Breast | breast invasive carcinoma | Male | >=65 | I/II | Chemotherapy | cytoxan | SD | |
| TRABD2A | insertion | Frame_Shift_Ins | novel | c.136_137insGTTCAAC | p.Thr46SerfsTer5 | p.T46Sfs*5 | Q86V40 | protein_coding | TCGA-AR-A0U0-01 | Breast | breast invasive carcinoma | Female | >=65 | I/II | Unknown | Unknown | SD | ||
| TRABD2A | deletion | Frame_Shift_Del | novel | c.971delN | p.Phe324SerfsTer27 | p.F324Sfs*27 | Q86V40 | protein_coding | TCGA-EW-A2FV-01 | Breast | breast invasive carcinoma | Female | <65 | III/IV | Chemotherapy | docetaxel | SD | ||
| TRABD2A | SNV | Missense_Mutation | rs757790660 | c.1259N>A | p.Arg420Gln | p.R420Q | Q86V40 | protein_coding | tolerated(0.07) | benign(0) | TCGA-MY-A913-01 | Cervix | cervical & endocervical cancer | Female | <65 | I/II | Chemotherapy | cisplatin | CR |
| Page: 1 2 3 4 5 6 |
Top |
Related drugs of malignant transformation related genes |
| Identification of chemicals and drugs interact with genes involved in malignant transfromation |
| (DGIdb 4.0) |
| Entrez ID | Symbol | Category | Interaction Types | Drug Claim Name | Drug Name | PMIDs |
| Page: 1 |

Copyright 2023-Present -The University of Texas Health Science Center at Houston |