
|
|||||
|
 | |
| |
| |
| |
| |
| |
|
Gene: TRABD |
Gene summary for TRABD |
| Gene information | Species | Human | Gene symbol | TRABD | Gene ID | 80305 |
| Gene name | TraB domain containing | |
| Gene Alias | LP6054 | |
| Cytomap | 22q13.33 | |
| Gene Type | protein-coding | GO ID | NA | UniProtAcc | Q9H4I3 |
Top |
Malignant transformation analysis |
| Identification of the aberrant gene expression in precancerous and cancerous lesions by comparing the gene expression of stem-like cells in diseased tissues with normal stem cells |
| Entrez ID | Symbol | Replicates | Species | Organ | Tissue | Adj P-value | Log2FC | Malignancy |
| 80305 | TRABD | LZE4T | Human | Esophagus | ESCC | 1.45e-15 | 5.79e-01 | 0.0811 |
| 80305 | TRABD | LZE5T | Human | Esophagus | ESCC | 2.64e-03 | 1.57e-01 | 0.0514 |
| 80305 | TRABD | LZE7T | Human | Esophagus | ESCC | 2.46e-19 | 7.06e-01 | 0.0667 |
| 80305 | TRABD | LZE8T | Human | Esophagus | ESCC | 2.02e-12 | 4.91e-01 | 0.067 |
| 80305 | TRABD | LZE20T | Human | Esophagus | ESCC | 7.58e-03 | 1.30e-01 | 0.0662 |
| 80305 | TRABD | LZE22T | Human | Esophagus | ESCC | 3.93e-04 | 4.34e-01 | 0.068 |
| 80305 | TRABD | LZE24T | Human | Esophagus | ESCC | 2.23e-20 | 6.95e-01 | 0.0596 |
| 80305 | TRABD | LZE21T | Human | Esophagus | ESCC | 1.10e-04 | 3.58e-01 | 0.0655 |
| 80305 | TRABD | LZE6T | Human | Esophagus | ESCC | 9.68e-09 | 4.64e-01 | 0.0845 |
| 80305 | TRABD | P1T-E | Human | Esophagus | ESCC | 7.69e-17 | 7.58e-01 | 0.0875 |
| 80305 | TRABD | P2T-E | Human | Esophagus | ESCC | 3.63e-40 | 6.37e-01 | 0.1177 |
| 80305 | TRABD | P4T-E | Human | Esophagus | ESCC | 1.96e-28 | 7.15e-01 | 0.1323 |
| 80305 | TRABD | P5T-E | Human | Esophagus | ESCC | 1.66e-32 | 6.47e-01 | 0.1327 |
| 80305 | TRABD | P8T-E | Human | Esophagus | ESCC | 3.16e-33 | 5.75e-01 | 0.0889 |
| 80305 | TRABD | P9T-E | Human | Esophagus | ESCC | 6.85e-29 | 6.78e-01 | 0.1131 |
| 80305 | TRABD | P10T-E | Human | Esophagus | ESCC | 7.65e-30 | 6.21e-01 | 0.116 |
| 80305 | TRABD | P11T-E | Human | Esophagus | ESCC | 1.79e-22 | 1.04e+00 | 0.1426 |
| 80305 | TRABD | P12T-E | Human | Esophagus | ESCC | 3.79e-32 | 7.12e-01 | 0.1122 |
| 80305 | TRABD | P15T-E | Human | Esophagus | ESCC | 1.76e-45 | 9.77e-01 | 0.1149 |
| 80305 | TRABD | P16T-E | Human | Esophagus | ESCC | 1.80e-41 | 7.74e-01 | 0.1153 |
| Page: 1 2 3 4 5 6 |
| Tissue | Expression Dynamics | Abbreviation |
| Esophagus | 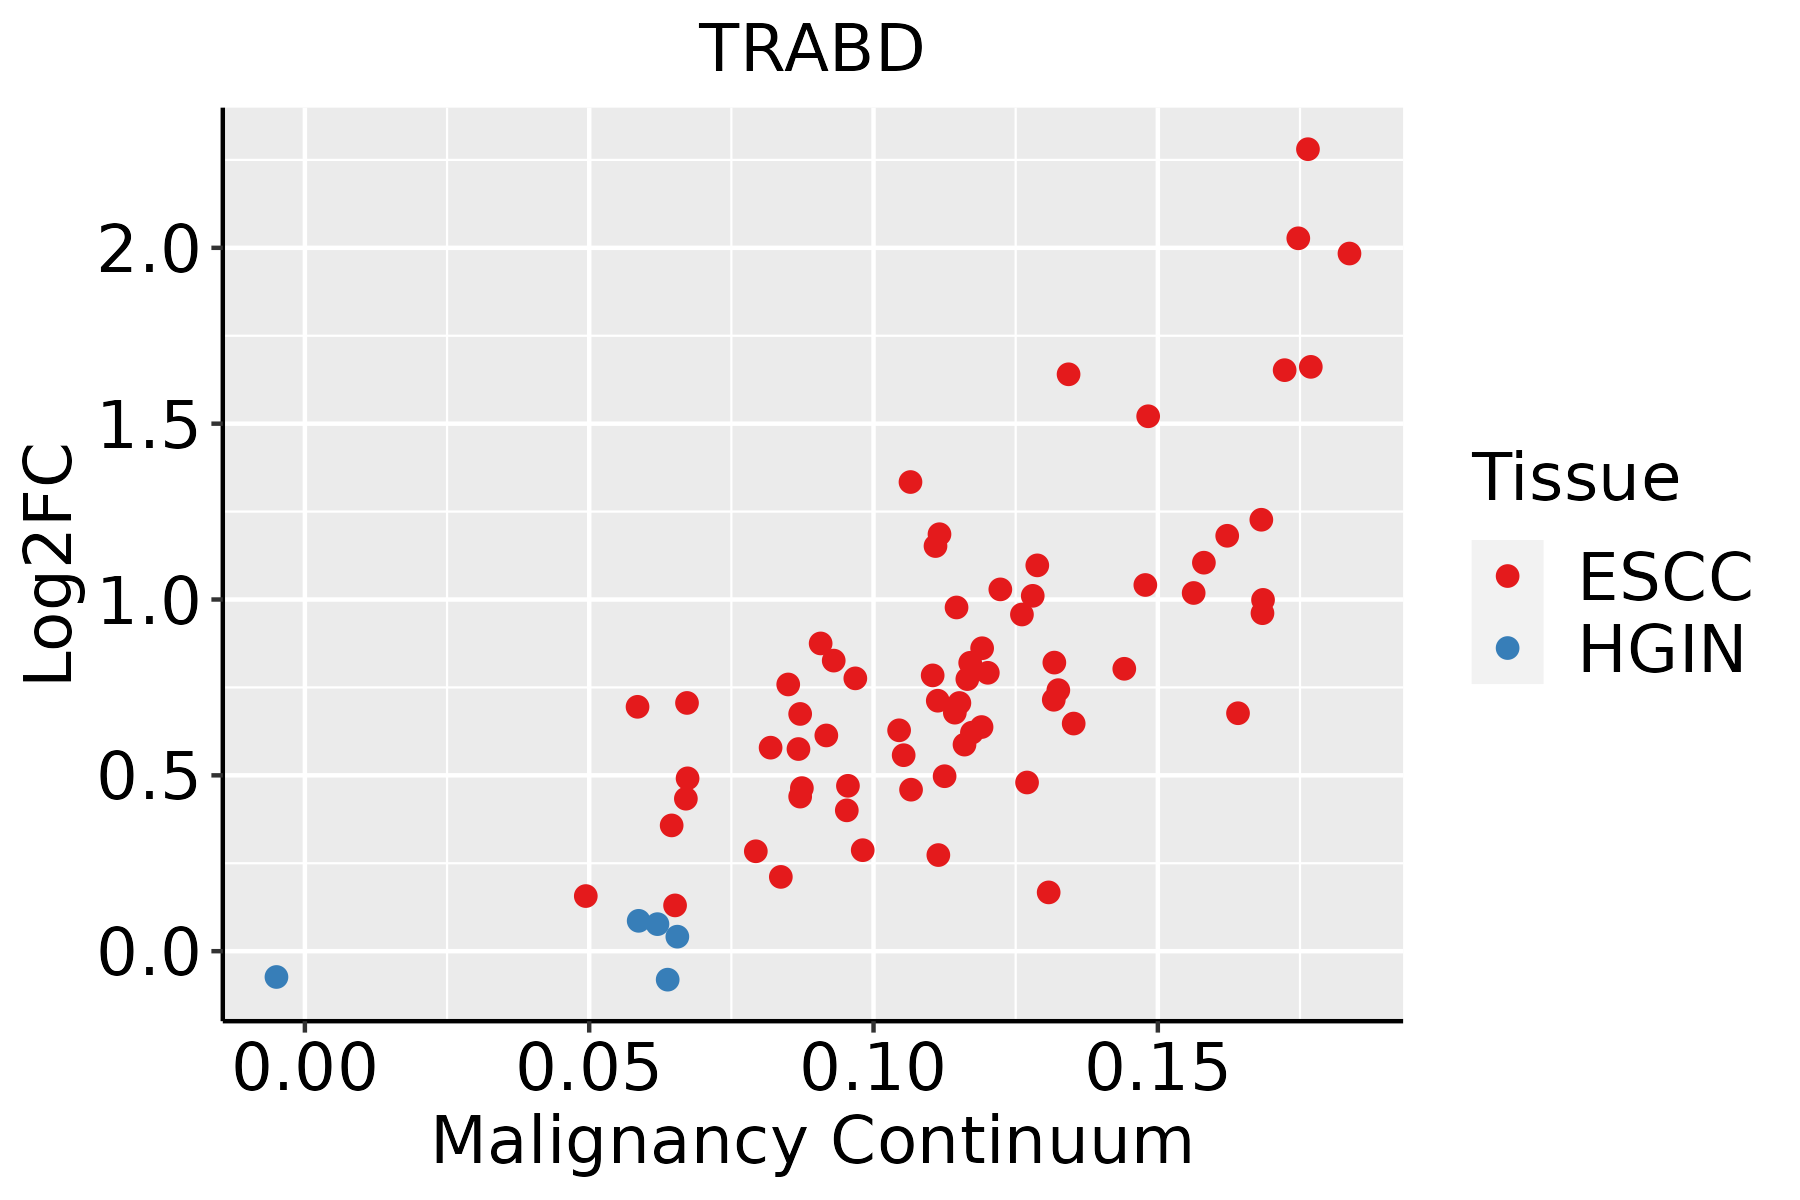 | ESCC: Esophageal squamous cell carcinoma |
| HGIN: High-grade intraepithelial neoplasias | ||
| LGIN: Low-grade intraepithelial neoplasias | ||
| Liver | 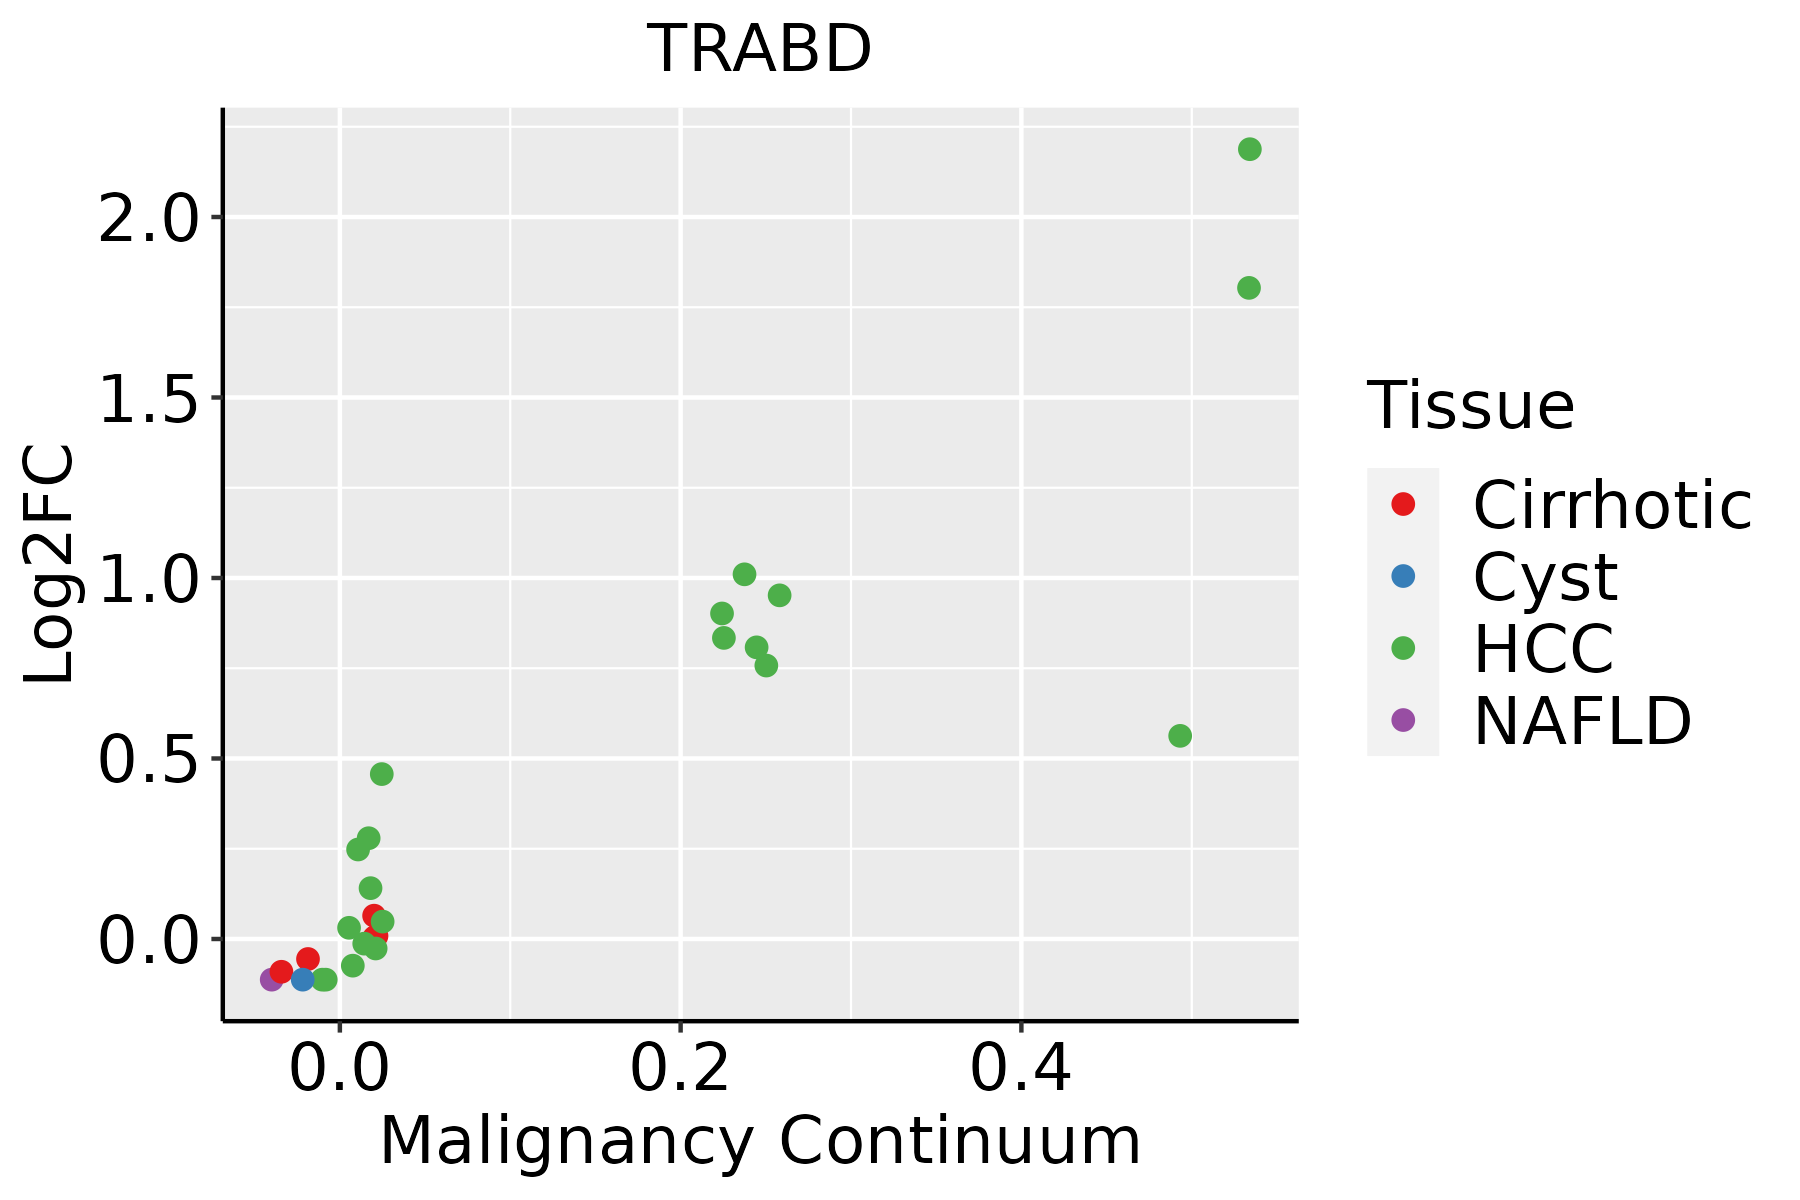 | HCC: Hepatocellular carcinoma |
| NAFLD: Non-alcoholic fatty liver disease | ||
| Oral Cavity | 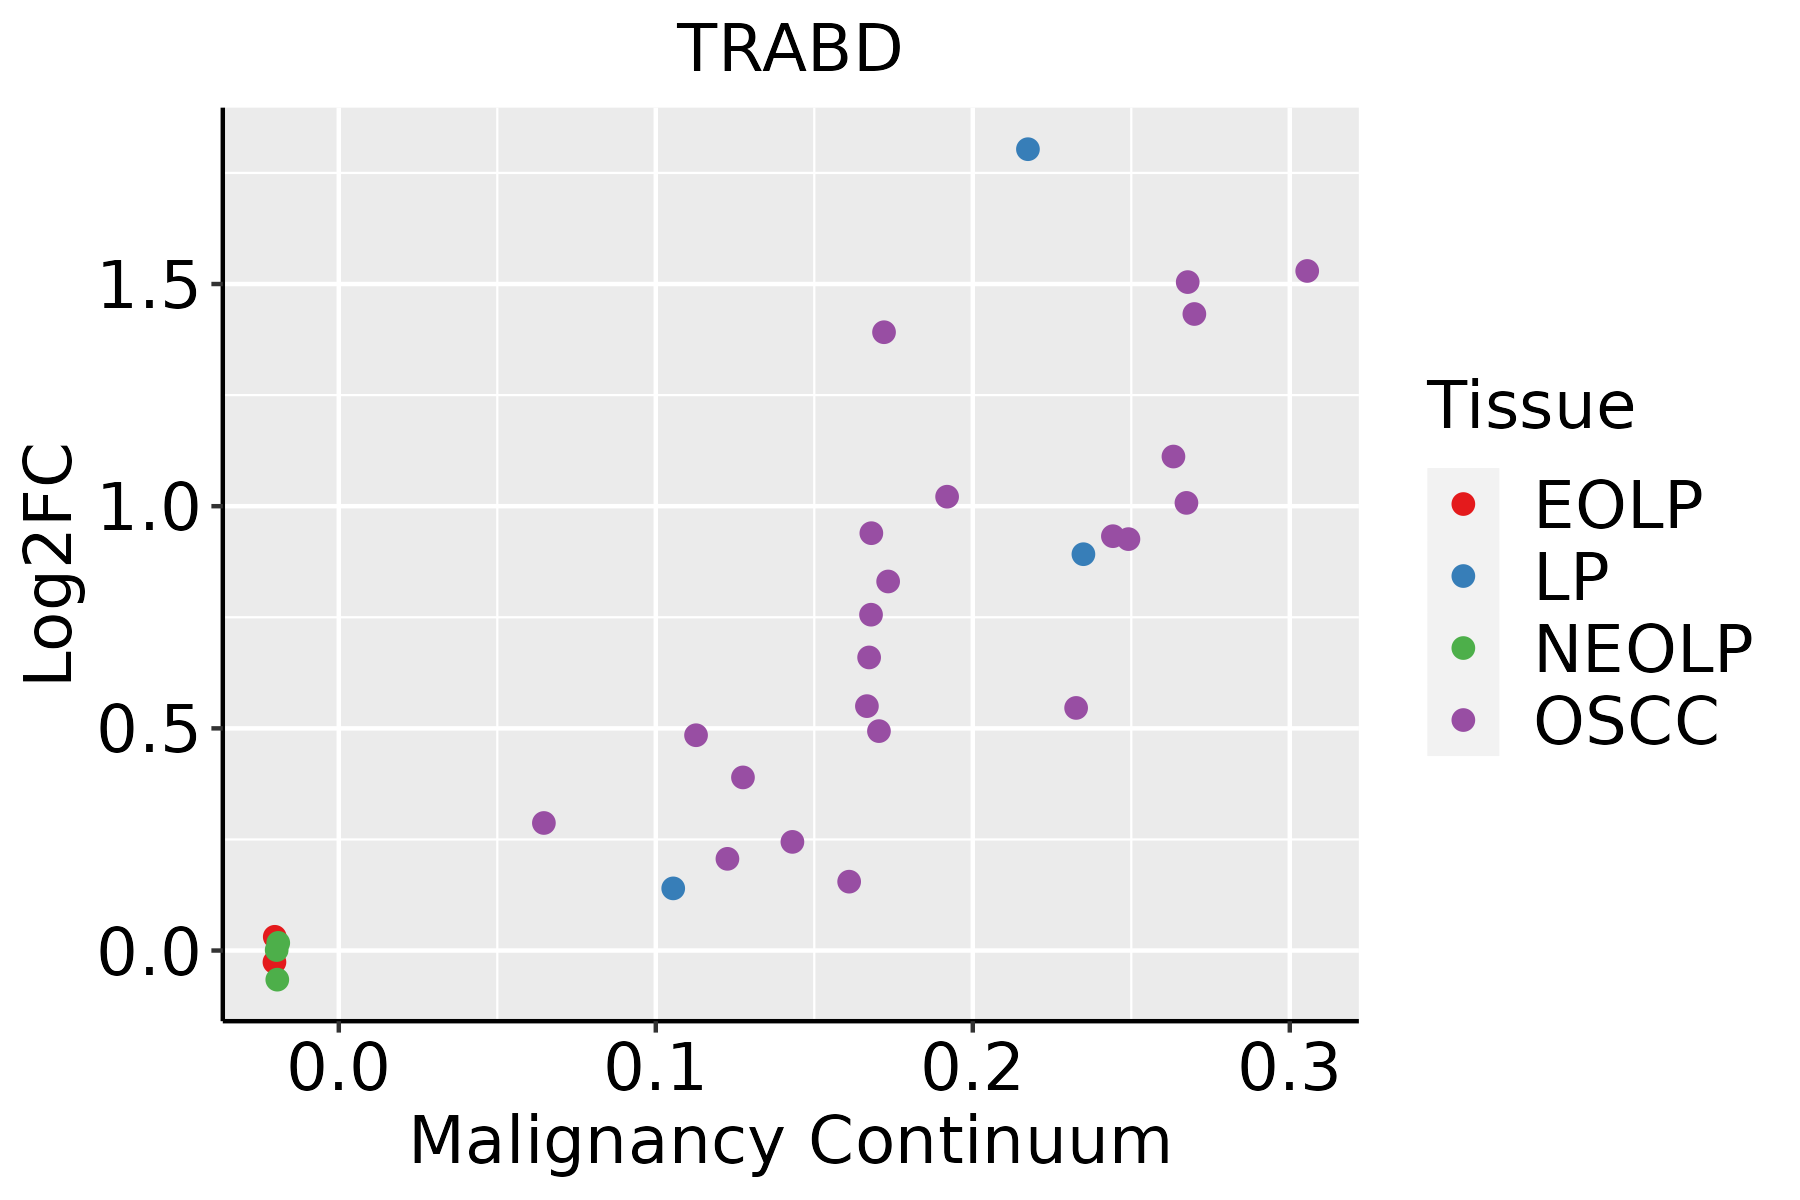 | EOLP: Erosive Oral lichen planus |
| LP: leukoplakia | ||
| NEOLP: Non-erosive oral lichen planus | ||
| OSCC: Oral squamous cell carcinoma | ||
| Skin | 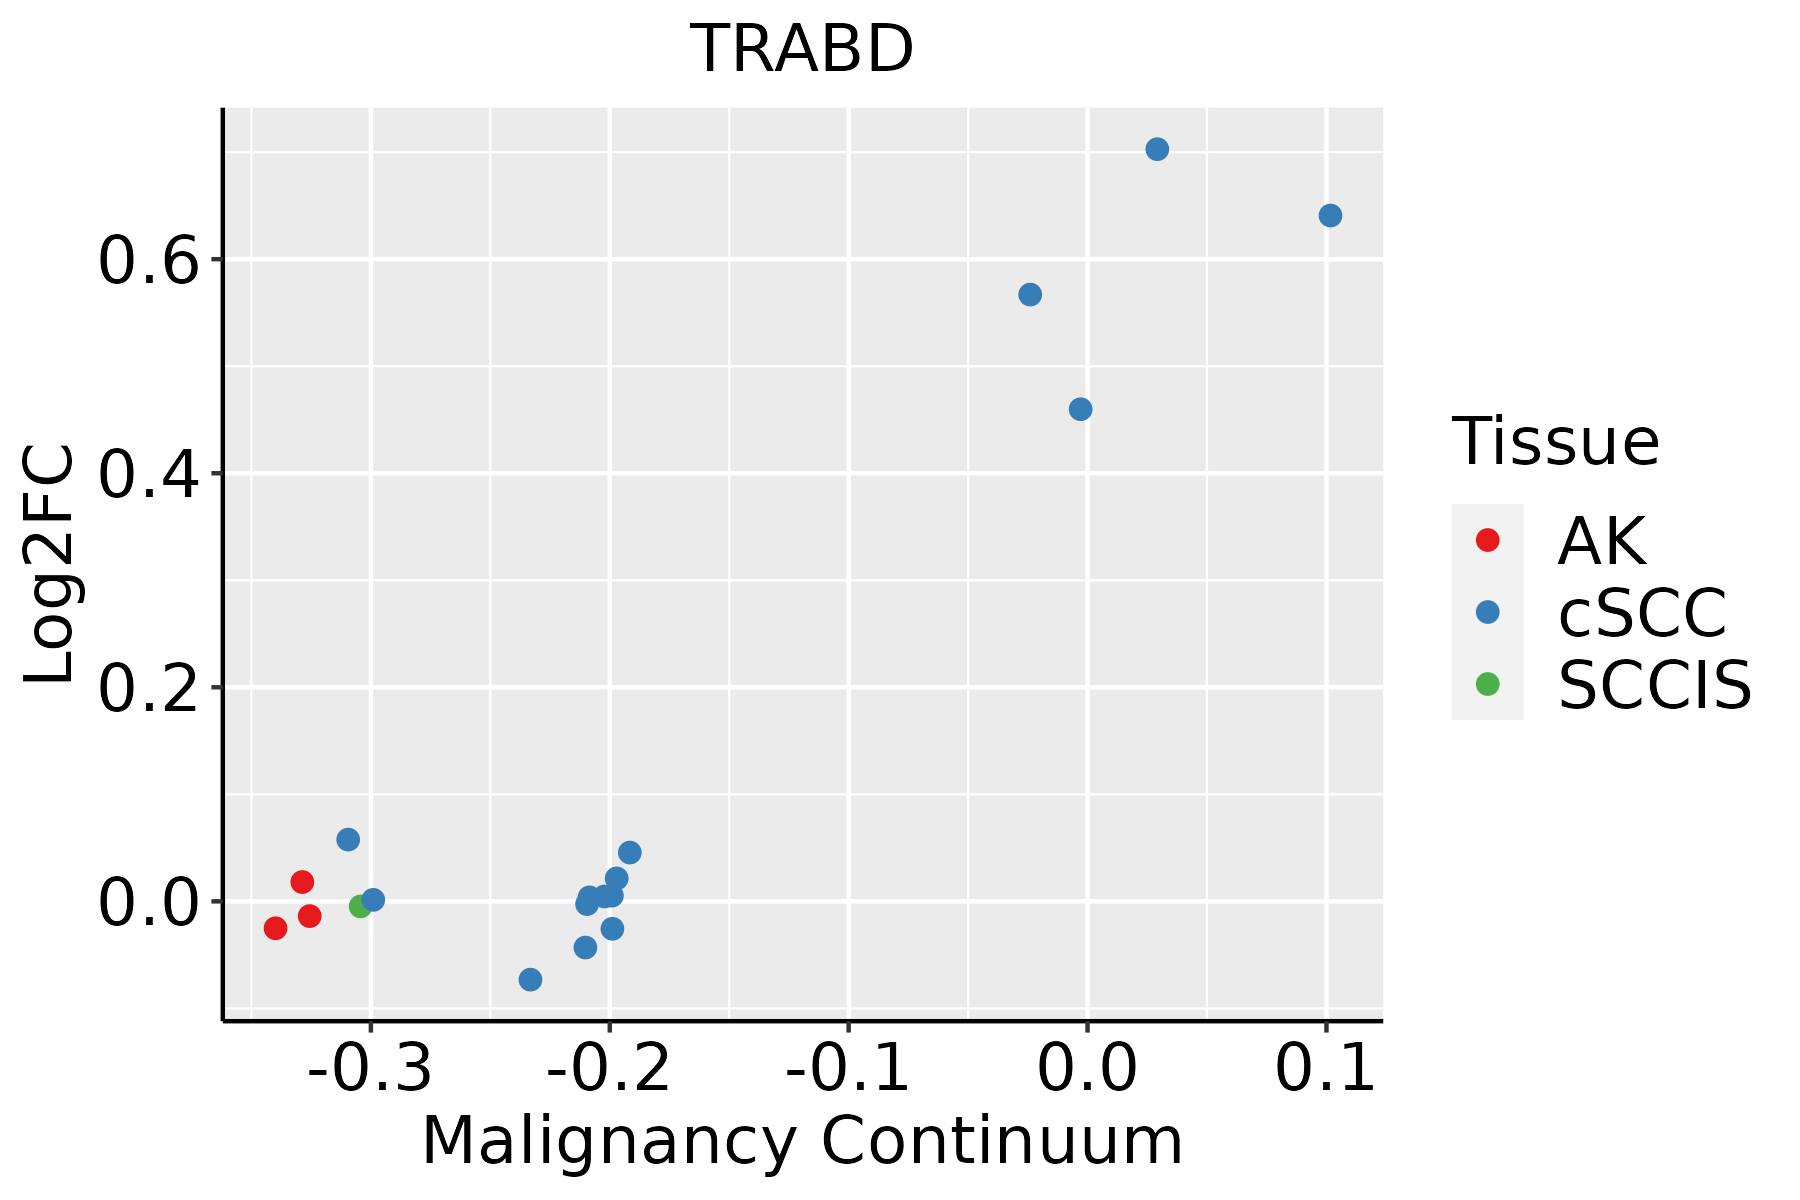 | AK: Actinic keratosis |
| cSCC: Cutaneous squamous cell carcinoma | ||
| SCCIS:squamous cell carcinoma in situ | ||
| Thyroid |  | ATC: Anaplastic thyroid cancer |
| HT: Hashimoto's thyroiditis | ||
| PTC: Papillary thyroid cancer |
| ∗log2FC in expression of this searched gene in stem-like cells from each diseased tissue sample relative to stem-like cells in normal samples in each tissue plotted against the malignancy continuum. Samples are colored based on if they are from different disease stage. |
Top |
Malignant transformation related pathway analysis |
| Find out the enriched GO biological processes and KEGG pathways involved in transition from healthy to precancer to cancer |
| Tissue | Disease Stage | Enriched GO biological Processes |
| Colorectum | AD |  |
| Colorectum | SER |  |
| Colorectum | MSS |  |
| Colorectum | MSI-H |  |
| Colorectum | FAP |  |
| ∗Top 15 enriched GO BP terms are showed in the bar plot of each disease state in each tissue. Each row represents a significant GO biological process which is colored according to the -log10(p.adjust). |
| Page: 1 2 3 4 5 6 7 8 9 |
| GO ID | Tissue | Disease Stage | Description | Gene Ratio | Bg Ratio | pvalue | p.adjust | Count |
| GO:0043254 | Colorectum | AD | regulation of protein-containing complex assembly | 148/3918 | 428/18723 | 2.64e-11 | 3.18e-09 | 148 |
| GO:0031334 | Colorectum | AD | positive regulation of protein-containing complex assembly | 91/3918 | 237/18723 | 4.78e-10 | 3.99e-08 | 91 |
| GO:0030111 | Colorectum | AD | regulation of Wnt signaling pathway | 102/3918 | 328/18723 | 8.51e-06 | 2.03e-04 | 102 |
| GO:0016055 | Colorectum | AD | Wnt signaling pathway | 130/3918 | 444/18723 | 1.60e-05 | 3.37e-04 | 130 |
| GO:0198738 | Colorectum | AD | cell-cell signaling by wnt | 130/3918 | 446/18723 | 2.02e-05 | 4.10e-04 | 130 |
| GO:00432541 | Colorectum | SER | regulation of protein-containing complex assembly | 119/2897 | 428/18723 | 3.34e-11 | 5.86e-09 | 119 |
| GO:00313341 | Colorectum | SER | positive regulation of protein-containing complex assembly | 73/2897 | 237/18723 | 1.89e-09 | 1.84e-07 | 73 |
| GO:00160551 | Colorectum | SER | Wnt signaling pathway | 97/2897 | 444/18723 | 2.02e-04 | 3.68e-03 | 97 |
| GO:01987381 | Colorectum | SER | cell-cell signaling by wnt | 97/2897 | 446/18723 | 2.39e-04 | 4.11e-03 | 97 |
| GO:00301111 | Colorectum | SER | regulation of Wnt signaling pathway | 75/2897 | 328/18723 | 2.47e-04 | 4.20e-03 | 75 |
| GO:00432542 | Colorectum | MSS | regulation of protein-containing complex assembly | 130/3467 | 428/18723 | 1.38e-09 | 1.03e-07 | 130 |
| GO:00313342 | Colorectum | MSS | positive regulation of protein-containing complex assembly | 82/3467 | 237/18723 | 2.49e-09 | 1.75e-07 | 82 |
| GO:00301112 | Colorectum | MSS | regulation of Wnt signaling pathway | 98/3467 | 328/18723 | 3.37e-07 | 1.36e-05 | 98 |
| GO:00160552 | Colorectum | MSS | Wnt signaling pathway | 124/3467 | 444/18723 | 6.06e-07 | 2.26e-05 | 124 |
| GO:01987382 | Colorectum | MSS | cell-cell signaling by wnt | 124/3467 | 446/18723 | 7.83e-07 | 2.77e-05 | 124 |
| GO:0030178 | Colorectum | MSS | negative regulation of Wnt signaling pathway | 48/3467 | 170/18723 | 1.23e-03 | 1.18e-02 | 48 |
| GO:00160553 | Colorectum | FAP | Wnt signaling pathway | 104/2622 | 444/18723 | 4.92e-08 | 3.92e-06 | 104 |
| GO:00432544 | Colorectum | FAP | regulation of protein-containing complex assembly | 101/2622 | 428/18723 | 5.18e-08 | 4.07e-06 | 101 |
| GO:01987383 | Colorectum | FAP | cell-cell signaling by wnt | 104/2622 | 446/18723 | 6.26e-08 | 4.54e-06 | 104 |
| GO:00301113 | Colorectum | FAP | regulation of Wnt signaling pathway | 81/2622 | 328/18723 | 1.44e-07 | 9.03e-06 | 81 |
| Page: 1 2 |
| Pathway ID | Tissue | Disease Stage | Description | Gene Ratio | Bg Ratio | pvalue | p.adjust | qvalue | Count |
| Page: 1 |
Top |
Cell-cell communication analysis |
| Identification of potential cell-cell interactions between two cell types and their ligand-receptor pairs for different disease states |
| Ligand | Receptor | LRpair | Pathway | Tissue | Disease Stage |
| Page: 1 |
Top |
Single-cell gene regulatory network inference analysis |
| Find out the significant the regulons (TFs) and the target genes of each regulon across cell types for different disease states |
| TF | Cell Type | Tissue | Disease Stage | Target Gene | RSS | Regulon Activity |
| ∗The dot plots of a searched regulon are shown for all cell subpopulations in each disease state of each tissue based on the regulon specific score inferred using pySCENIC and by calculating the average expression. |
| Page: 1 |
Top |
Somatic mutation of malignant transformation related genes |
| Annotation of somatic variants for genes involved in malignant transformation |
| Hugo Symbol | Variant Class | Variant Classification | dbSNP RS | HGVSc | HGVSp | HGVSp Short | SWISSPROT | BIOTYPE | SIFT | PolyPhen | Tumor Sample Barcode | Tissue | Histology | Sex | Age | Stage | Therapy Types | Drugs | Outcome |
| TRABD | SNV | Missense_Mutation | c.205N>T | p.Ala69Ser | p.A69S | protein_coding | tolerated(0.13) | benign(0.053) | TCGA-A2-A0T0-01 | Breast | breast invasive carcinoma | Female | <65 | I/II | Chemotherapy | taxotere | SD | ||
| TRABD | SNV | Missense_Mutation | c.703N>A | p.Asp235Asn | p.D235N | protein_coding | deleterious(0.01) | probably_damaging(0.994) | TCGA-2W-A8YY-01 | Cervix | cervical & endocervical cancer | Female | <65 | I/II | Chemotherapy | cisplatin | CR | ||
| TRABD | SNV | Missense_Mutation | rs374922285 | c.862N>A | p.Val288Ile | p.V288I | protein_coding | tolerated(0.32) | benign(0.005) | TCGA-A6-5657-01 | Colorectum | colon adenocarcinoma | Male | >=65 | III/IV | Ancillary | leucovorin | SD | |
| TRABD | SNV | Missense_Mutation | novel | c.370C>T | p.Arg124Trp | p.R124W | protein_coding | deleterious(0) | possibly_damaging(0.663) | TCGA-AD-5900-01 | Colorectum | colon adenocarcinoma | Male | >=65 | I/II | Unknown | Unknown | SD | |
| TRABD | SNV | Missense_Mutation | c.886G>A | p.Val296Met | p.V296M | protein_coding | deleterious(0.01) | probably_damaging(0.986) | TCGA-AM-5821-01 | Colorectum | colon adenocarcinoma | Female | >=65 | I/II | Unknown | Unknown | SD | ||
| TRABD | SNV | Missense_Mutation | c.707N>C | p.Leu236Pro | p.L236P | protein_coding | deleterious(0) | probably_damaging(0.964) | TCGA-CM-6674-01 | Colorectum | colon adenocarcinoma | Male | <65 | I/II | Unknown | Unknown | SD | ||
| TRABD | SNV | Missense_Mutation | c.725N>T | p.Ala242Val | p.A242V | protein_coding | deleterious(0.01) | benign(0.444) | TCGA-D5-6530-01 | Colorectum | colon adenocarcinoma | Male | <65 | I/II | Unknown | Unknown | SD | ||
| TRABD | SNV | Missense_Mutation | rs761422252 | c.1084N>A | p.Ala362Thr | p.A362T | protein_coding | tolerated(0.18) | benign(0.022) | TCGA-AF-A56N-01 | Colorectum | rectum adenocarcinoma | Female | <65 | I/II | Chemotherapy | xeloda | CR | |
| TRABD | SNV | Missense_Mutation | novel | c.105N>T | p.Gln35His | p.Q35H | protein_coding | tolerated_low_confidence(0.11) | benign(0.067) | TCGA-F5-6814-01 | Colorectum | rectum adenocarcinoma | Male | <65 | I/II | Unknown | Unknown | SD | |
| TRABD | SNV | Missense_Mutation | novel | c.821N>C | p.Leu274Pro | p.L274P | protein_coding | tolerated(0.18) | benign(0.017) | TCGA-A5-A1OF-01 | Endometrium | uterine corpus endometrioid carcinoma | Female | <65 | I/II | Unknown | Unknown | SD |
| Page: 1 2 3 |
Top |
Related drugs of malignant transformation related genes |
| Identification of chemicals and drugs interact with genes involved in malignant transfromation |
| (DGIdb 4.0) |
| Entrez ID | Symbol | Category | Interaction Types | Drug Claim Name | Drug Name | PMIDs |
| Page: 1 |

Copyright 2023-Present -The University of Texas Health Science Center at Houston |