
|
|||||
|
 | |
| |
| |
| |
| |
| |
|
Gene: TRA2B |
Gene summary for TRA2B |
| Gene information | Species | Human | Gene symbol | TRA2B | Gene ID | 6434 |
| Gene name | transformer 2 beta homolog | |
| Gene Alias | Htra2-beta | |
| Cytomap | 3q27.2 | |
| Gene Type | protein-coding | GO ID | GO:0000302 | UniProtAcc | P62995 |
Top |
Malignant transformation analysis |
| Identification of the aberrant gene expression in precancerous and cancerous lesions by comparing the gene expression of stem-like cells in diseased tissues with normal stem cells |
| Entrez ID | Symbol | Replicates | Species | Organ | Tissue | Adj P-value | Log2FC | Malignancy |
| 6434 | TRA2B | GSM4909277 | Human | Breast | Precancer | 1.64e-06 | 8.56e-01 | 0.0177 |
| 6434 | TRA2B | GSM4909280 | Human | Breast | Precancer | 3.50e-04 | 5.93e-01 | 0.0305 |
| 6434 | TRA2B | GSM4909281 | Human | Breast | IDC | 2.61e-03 | 2.63e-01 | 0.21 |
| 6434 | TRA2B | GSM4909282 | Human | Breast | IDC | 1.15e-07 | 3.65e-01 | -0.0288 |
| 6434 | TRA2B | GSM4909285 | Human | Breast | IDC | 6.11e-03 | 8.85e-02 | 0.21 |
| 6434 | TRA2B | GSM4909286 | Human | Breast | IDC | 6.63e-04 | -2.13e-01 | 0.1081 |
| 6434 | TRA2B | GSM4909293 | Human | Breast | IDC | 5.99e-20 | 4.55e-01 | 0.1581 |
| 6434 | TRA2B | GSM4909294 | Human | Breast | IDC | 1.39e-07 | -3.96e-01 | 0.2022 |
| 6434 | TRA2B | GSM4909296 | Human | Breast | IDC | 7.51e-03 | -2.22e-01 | 0.1524 |
| 6434 | TRA2B | GSM4909297 | Human | Breast | IDC | 1.56e-12 | -1.90e-01 | 0.1517 |
| 6434 | TRA2B | GSM4909298 | Human | Breast | IDC | 3.87e-03 | 1.66e-01 | 0.1551 |
| 6434 | TRA2B | GSM4909299 | Human | Breast | IDC | 3.16e-07 | 3.54e-01 | 0.035 |
| 6434 | TRA2B | GSM4909302 | Human | Breast | IDC | 1.39e-03 | -3.02e-01 | 0.1545 |
| 6434 | TRA2B | GSM4909311 | Human | Breast | IDC | 1.11e-23 | -4.35e-01 | 0.1534 |
| 6434 | TRA2B | GSM4909312 | Human | Breast | IDC | 9.61e-05 | -2.17e-01 | 0.1552 |
| 6434 | TRA2B | GSM4909315 | Human | Breast | IDC | 1.36e-02 | -3.29e-01 | 0.21 |
| 6434 | TRA2B | GSM4909316 | Human | Breast | IDC | 2.71e-02 | -3.53e-01 | 0.21 |
| 6434 | TRA2B | GSM4909319 | Human | Breast | IDC | 1.13e-30 | -3.68e-01 | 0.1563 |
| 6434 | TRA2B | GSM4909321 | Human | Breast | IDC | 5.56e-08 | -6.23e-02 | 0.1559 |
| 6434 | TRA2B | brca2 | Human | Breast | Precancer | 7.25e-05 | 6.56e-03 | -0.024 |
| Page: 1 2 3 4 5 6 7 8 9 10 11 12 13 14 15 |
| Tissue | Expression Dynamics | Abbreviation |
| Breast | 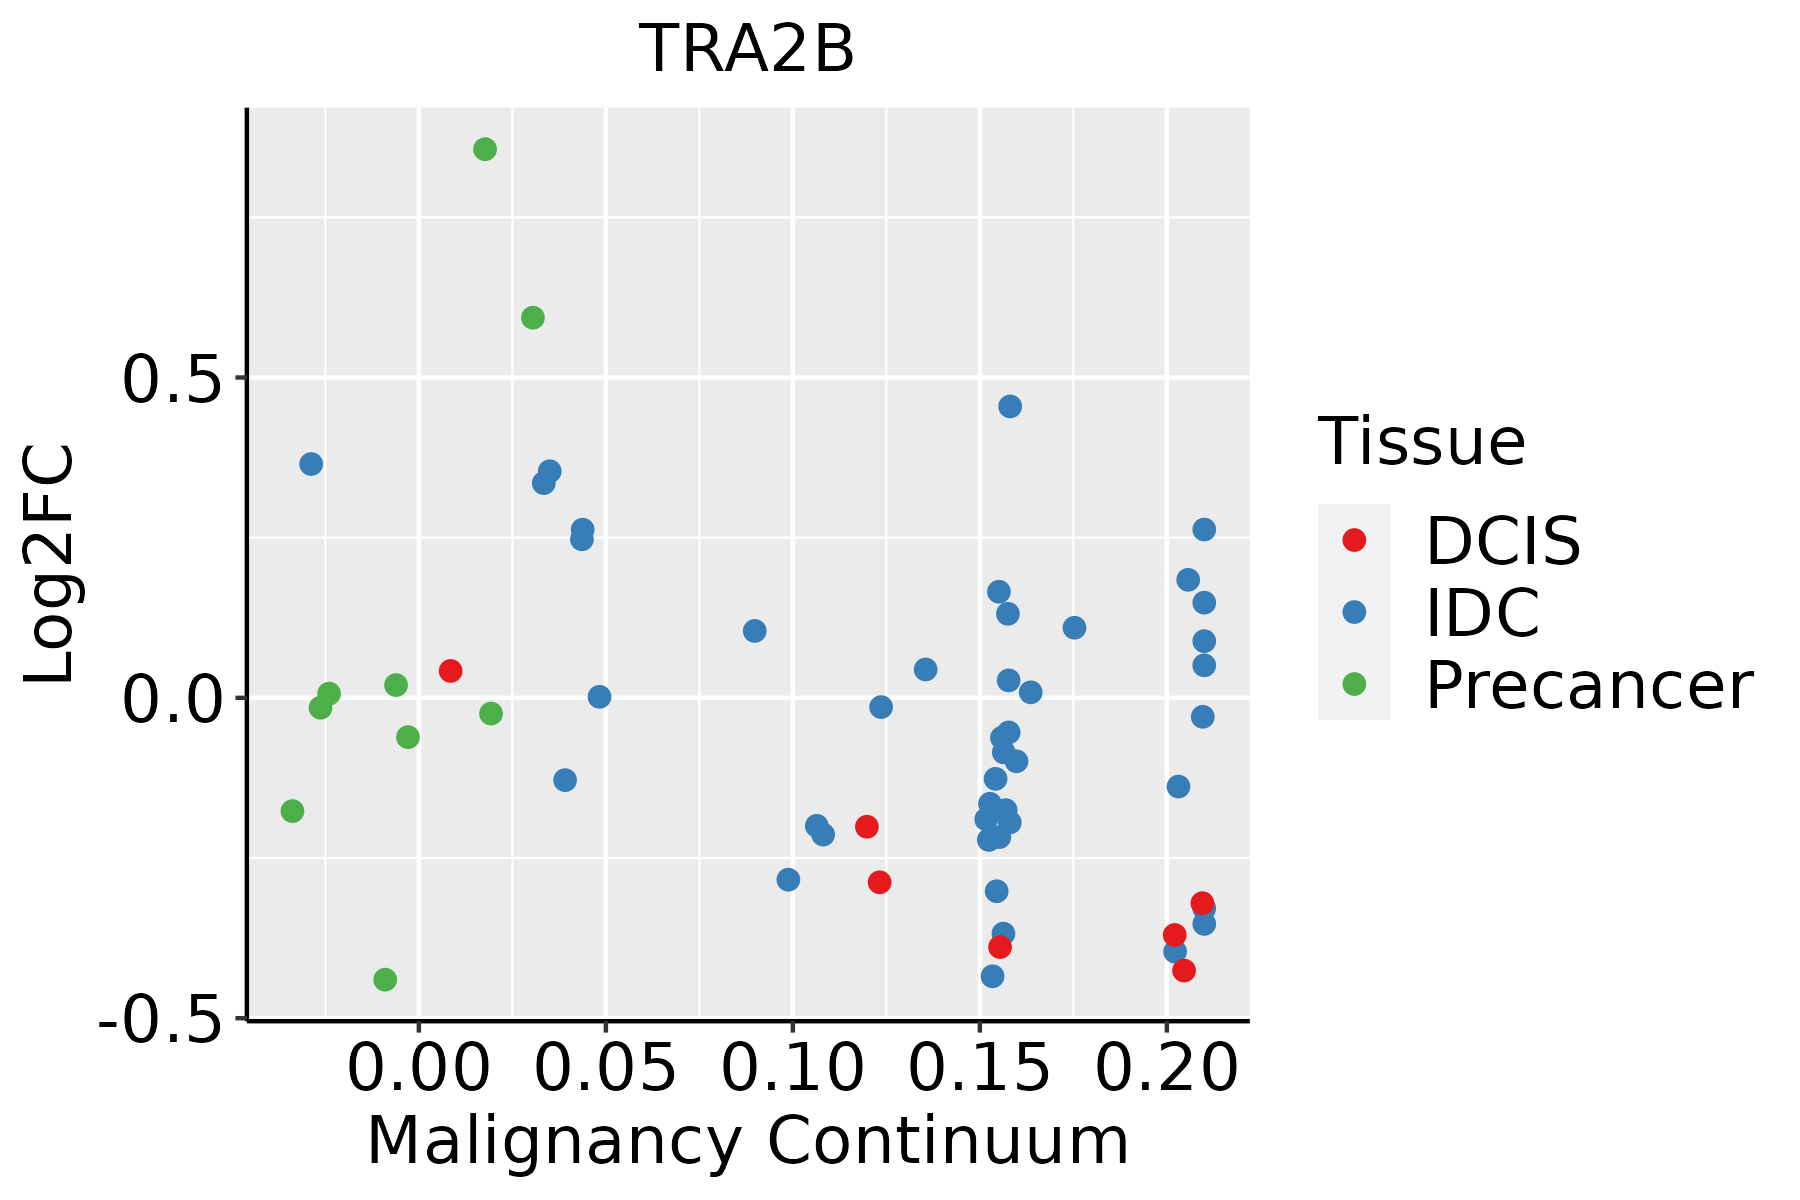 | IDC: Invasive ductal carcinoma |
| DCIS: Ductal carcinoma in situ | ||
| Precancer(BRCA1-mut): Precancerous lesion from BRCA1 mutation carriers | ||
| Cervix |  | CC: Cervix cancer |
| HSIL_HPV: HPV-infected high-grade squamous intraepithelial lesions | ||
| N_HPV: HPV-infected normal cervix | ||
| Colorectum (GSE201348) |  | FAP: Familial adenomatous polyposis |
| CRC: Colorectal cancer | ||
| Colorectum (HTA11) |  | AD: Adenomas |
| SER: Sessile serrated lesions | ||
| MSI-H: Microsatellite-high colorectal cancer | ||
| MSS: Microsatellite stable colorectal cancer | ||
| Endometrium | 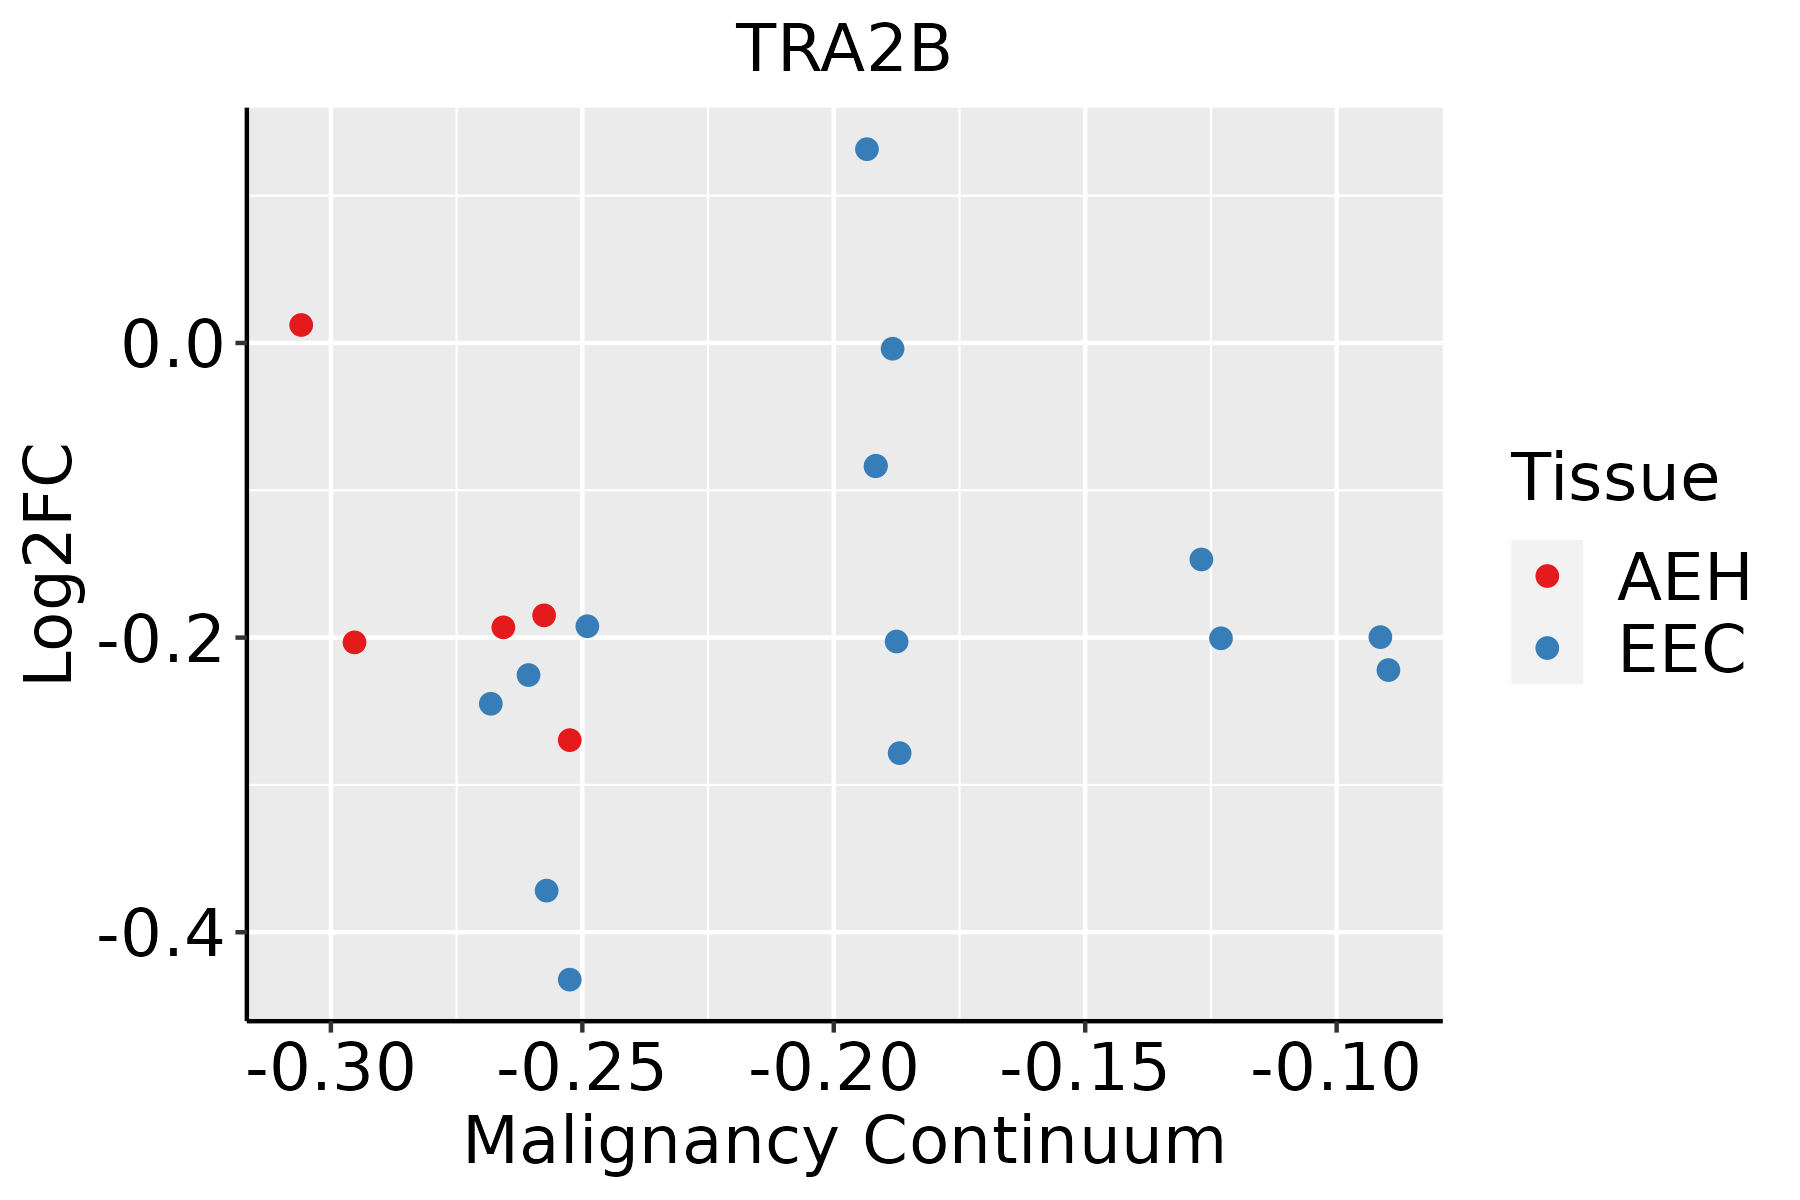 | AEH: Atypical endometrial hyperplasia |
| EEC: Endometrioid Cancer | ||
| Esophagus |  | ESCC: Esophageal squamous cell carcinoma |
| HGIN: High-grade intraepithelial neoplasias | ||
| LGIN: Low-grade intraepithelial neoplasias | ||
| GC | 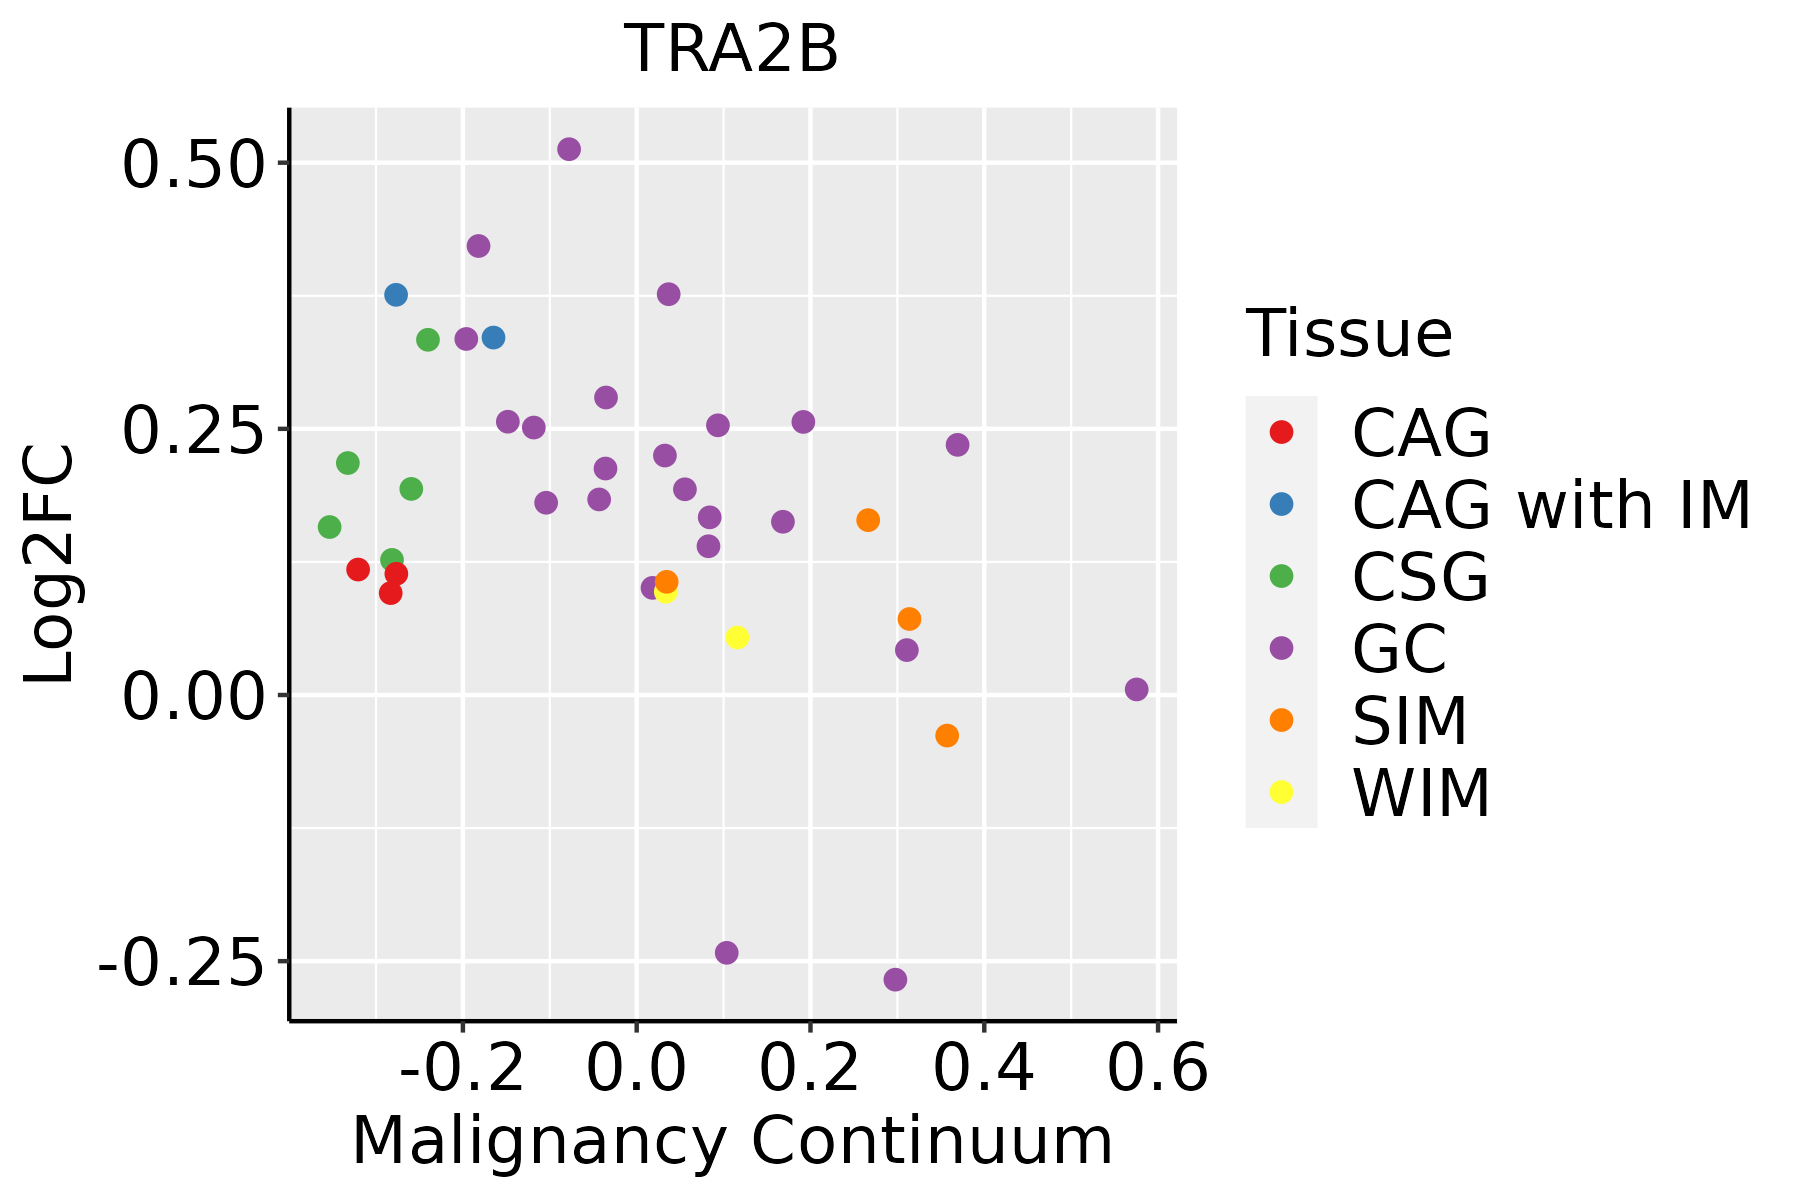 | CAG: Chronic atrophic gastritis |
| CAG with IM: Chronic atrophic gastritis with intestinal metaplasia | ||
| CSG: Chronic superficial gastritis | ||
| GC: Gastric cancer | ||
| SIM: Severe intestinal metaplasia | ||
| WIM: Wild intestinal metaplasia | ||
| Liver | 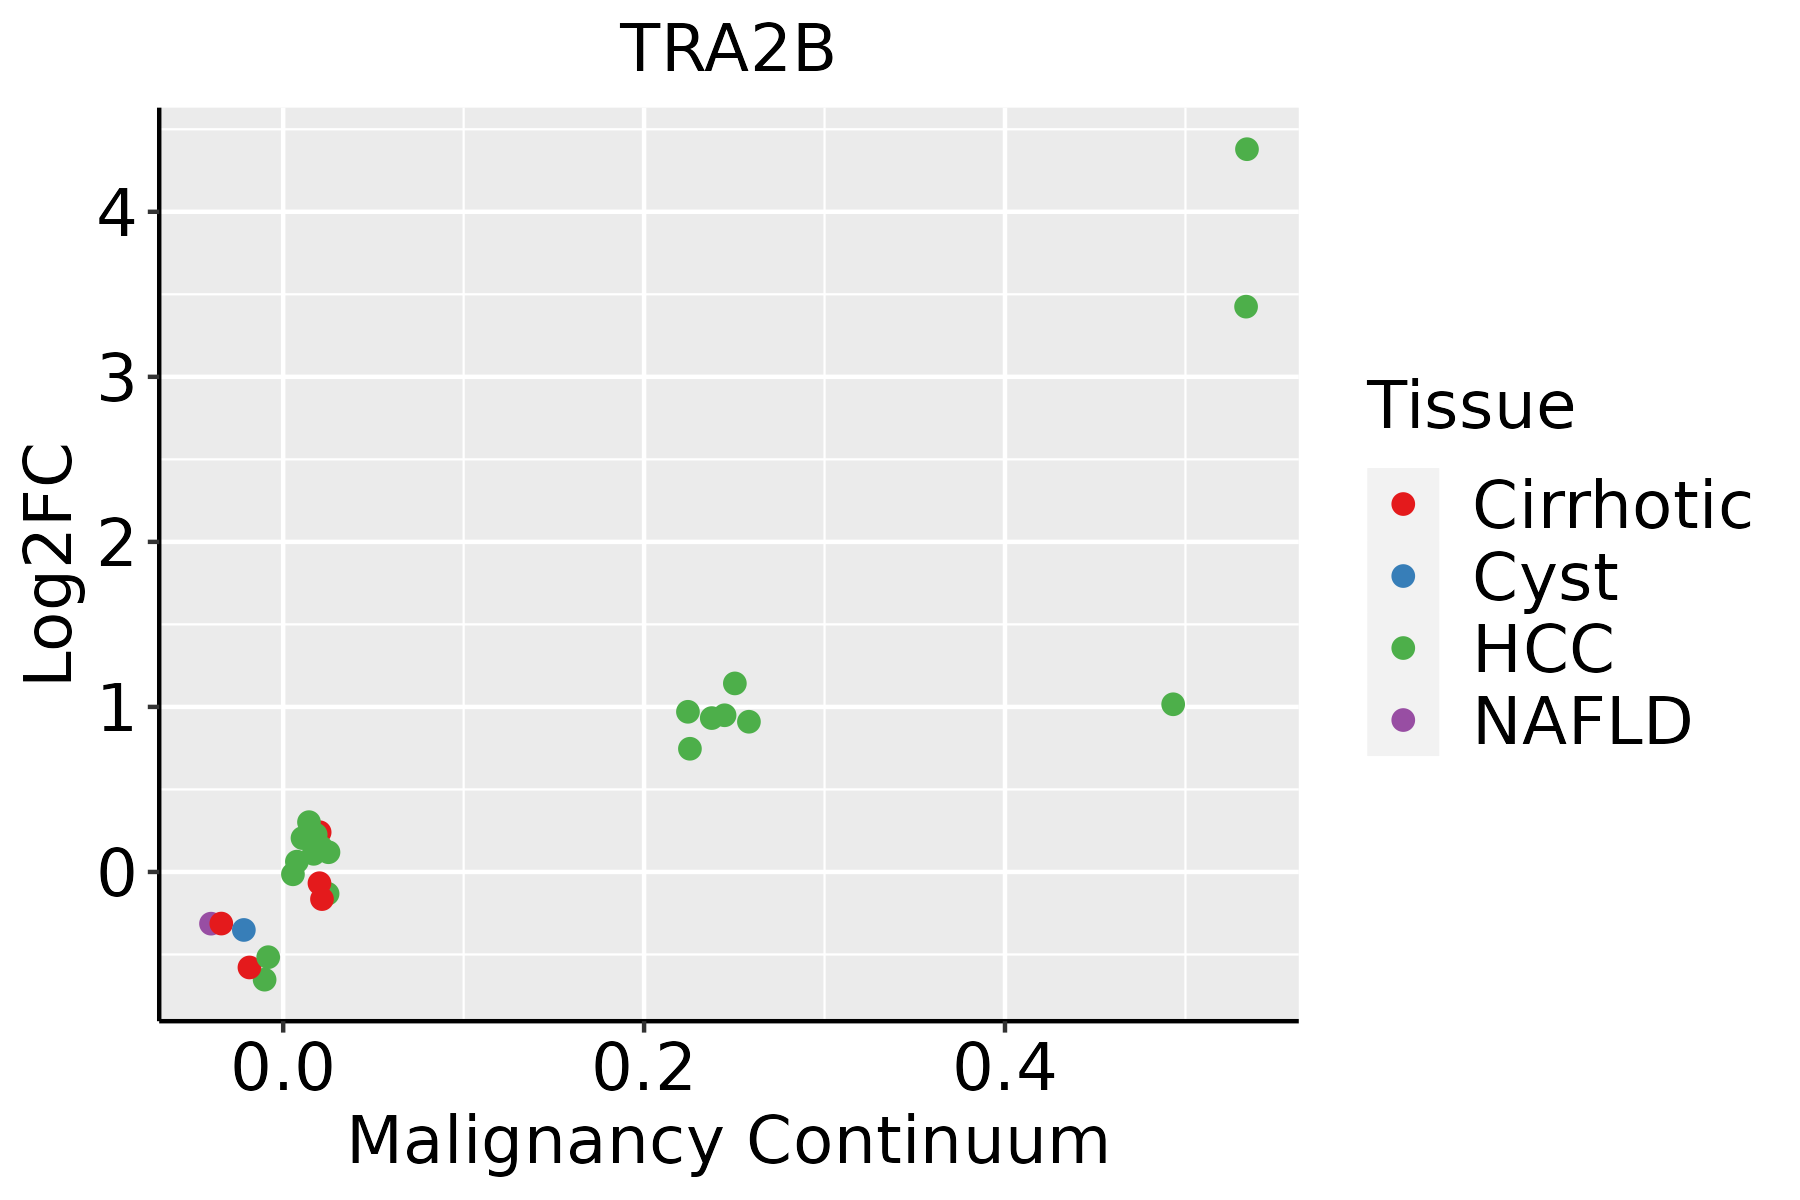 | HCC: Hepatocellular carcinoma |
| NAFLD: Non-alcoholic fatty liver disease | ||
| Lung | 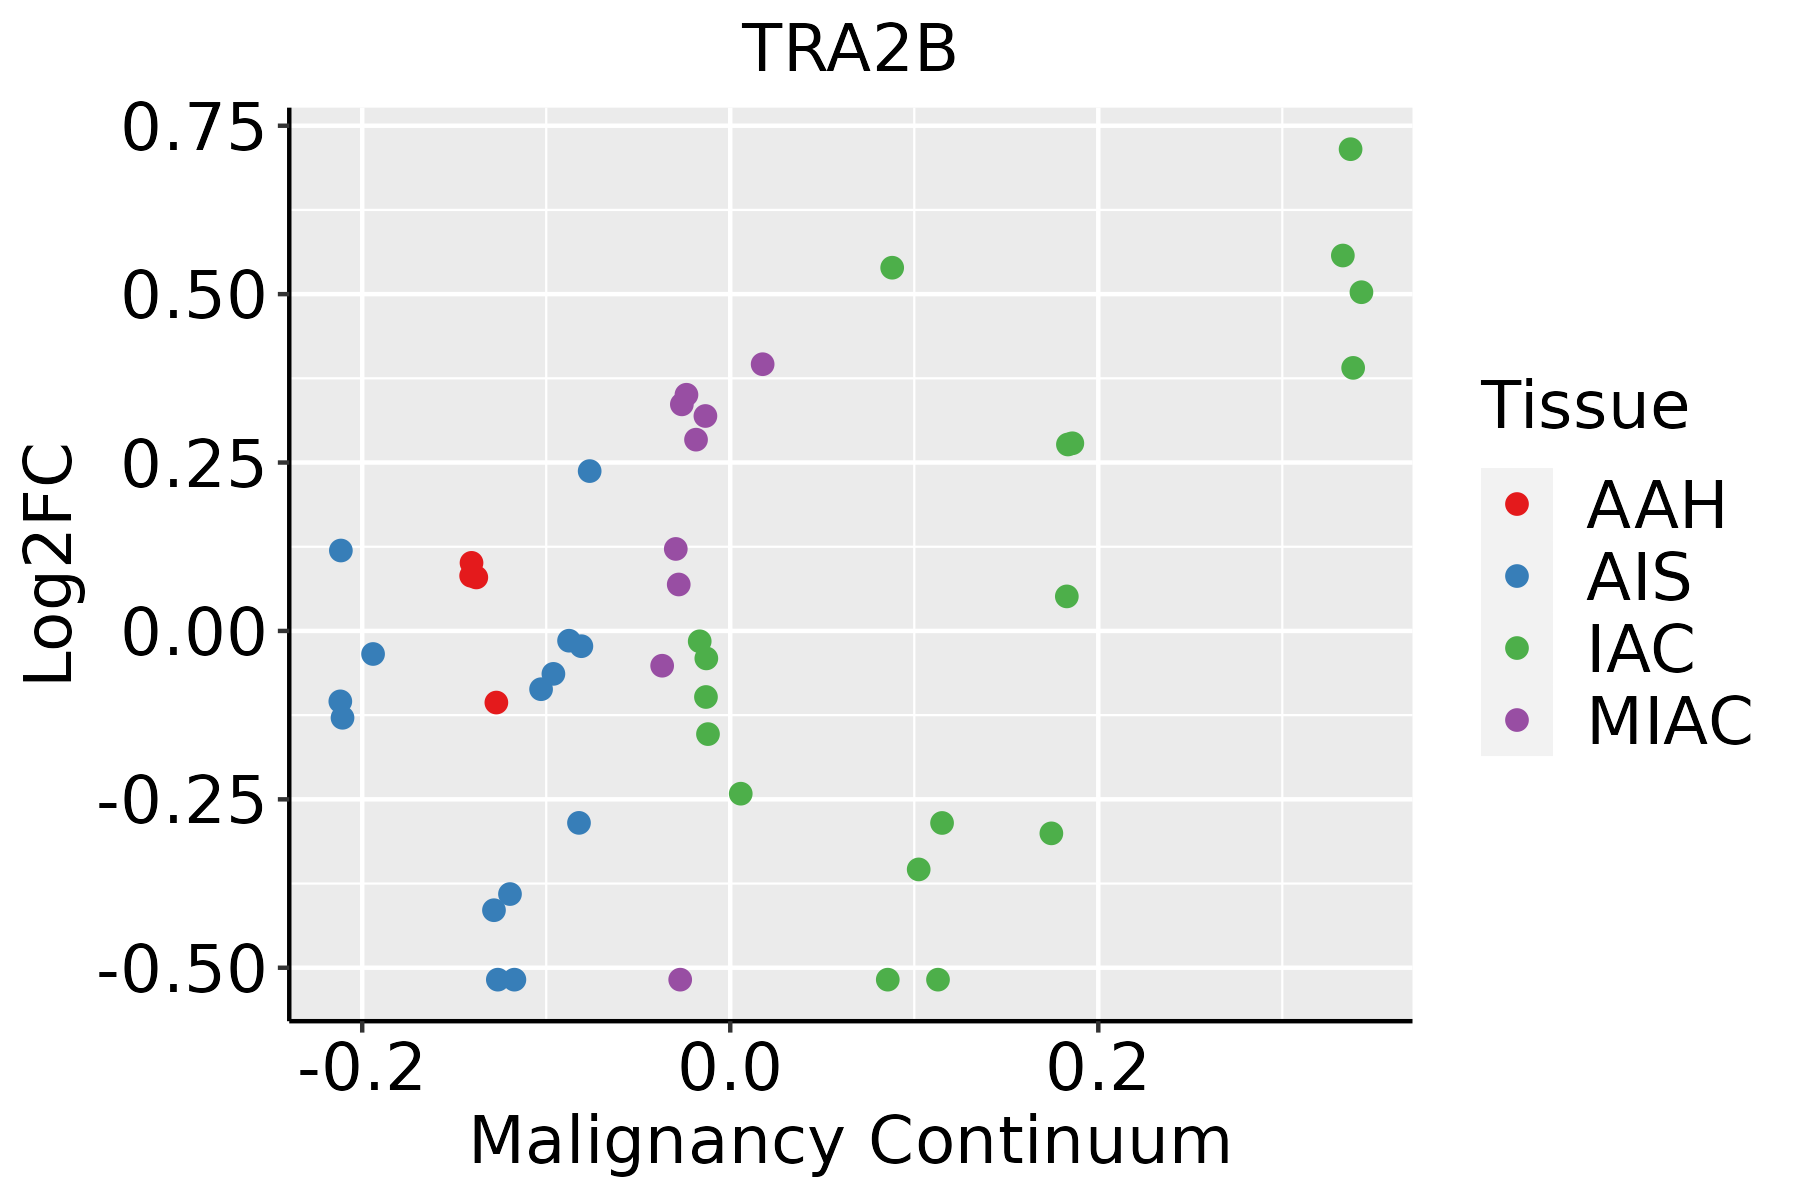 | AAH: Atypical adenomatous hyperplasia |
| AIS: Adenocarcinoma in situ | ||
| IAC: Invasive lung adenocarcinoma | ||
| MIA: Minimally invasive adenocarcinoma | ||
| Oral Cavity | 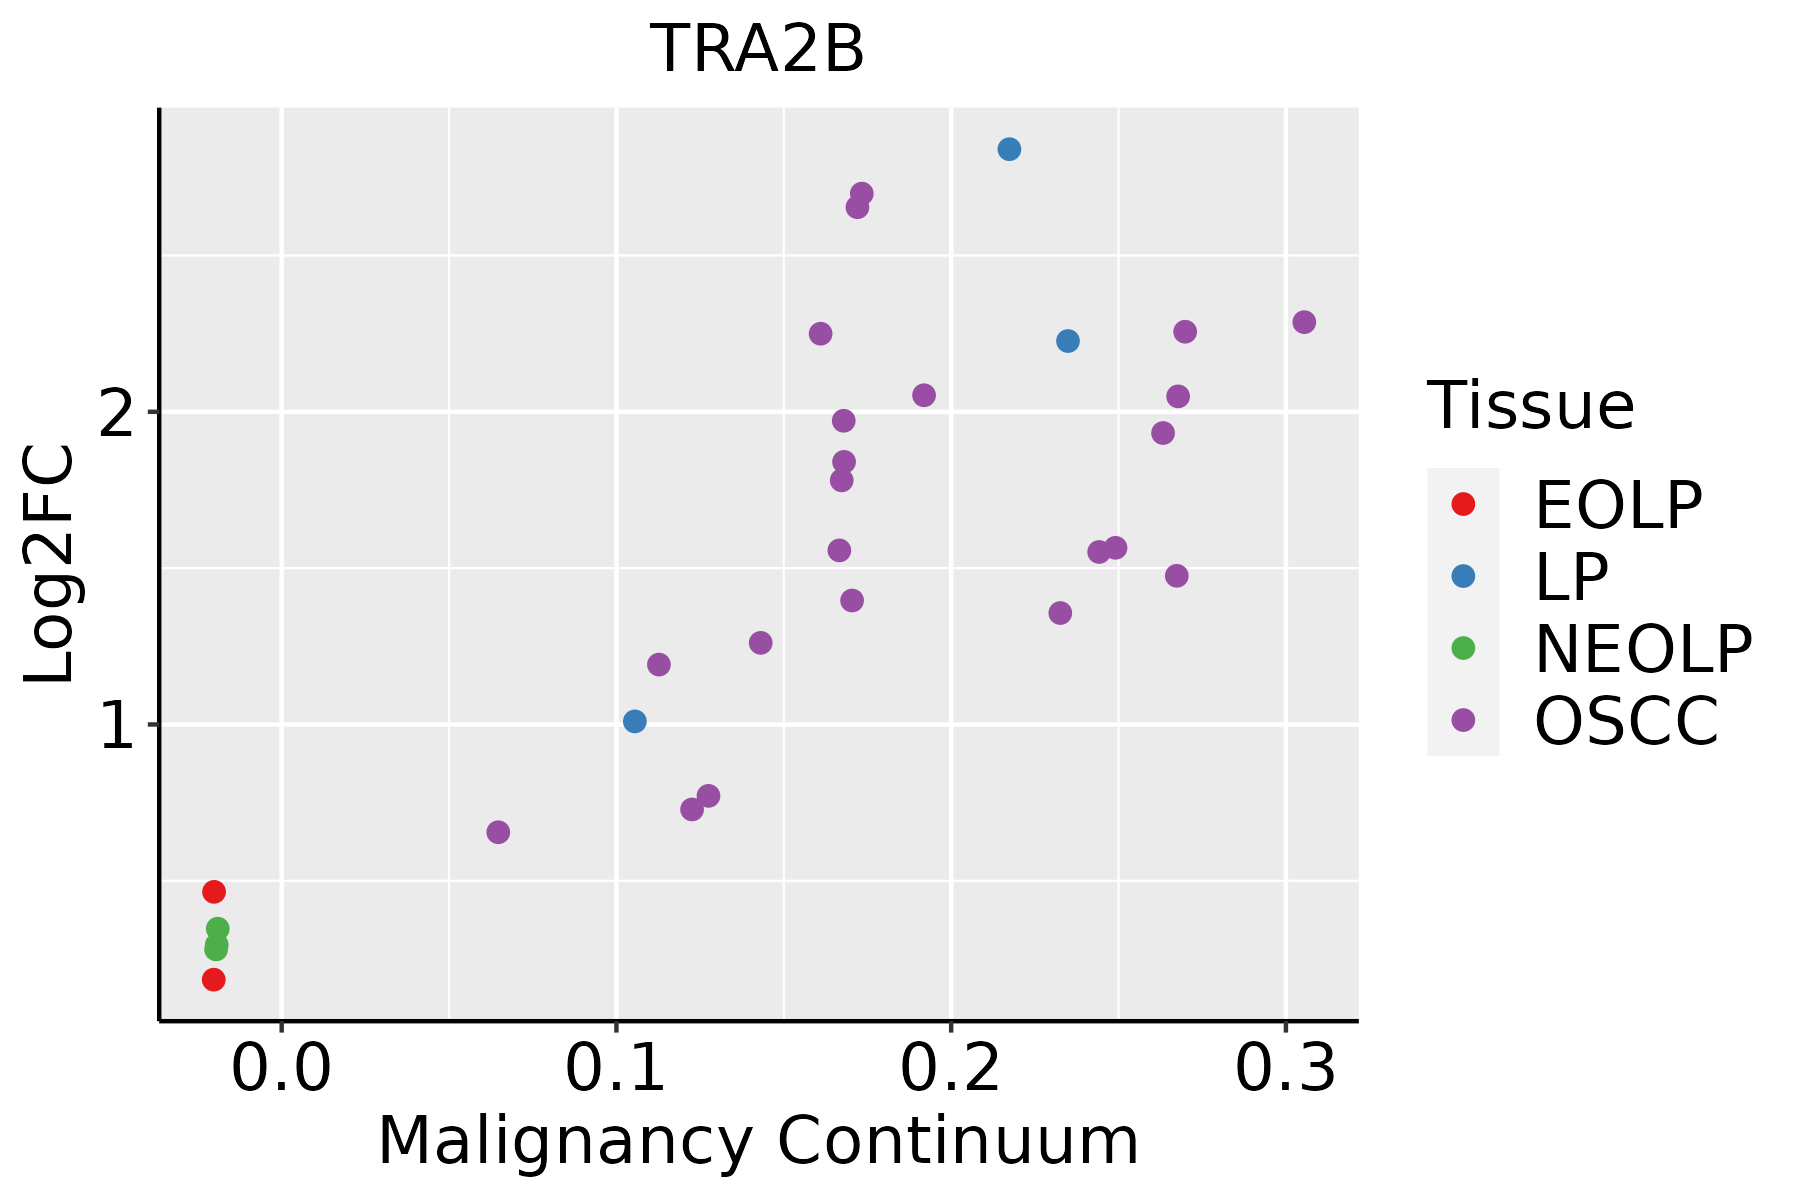 | EOLP: Erosive Oral lichen planus |
| LP: leukoplakia | ||
| NEOLP: Non-erosive oral lichen planus | ||
| OSCC: Oral squamous cell carcinoma | ||
| Prostate |  | BPH: Benign Prostatic Hyperplasia |
| Skin | 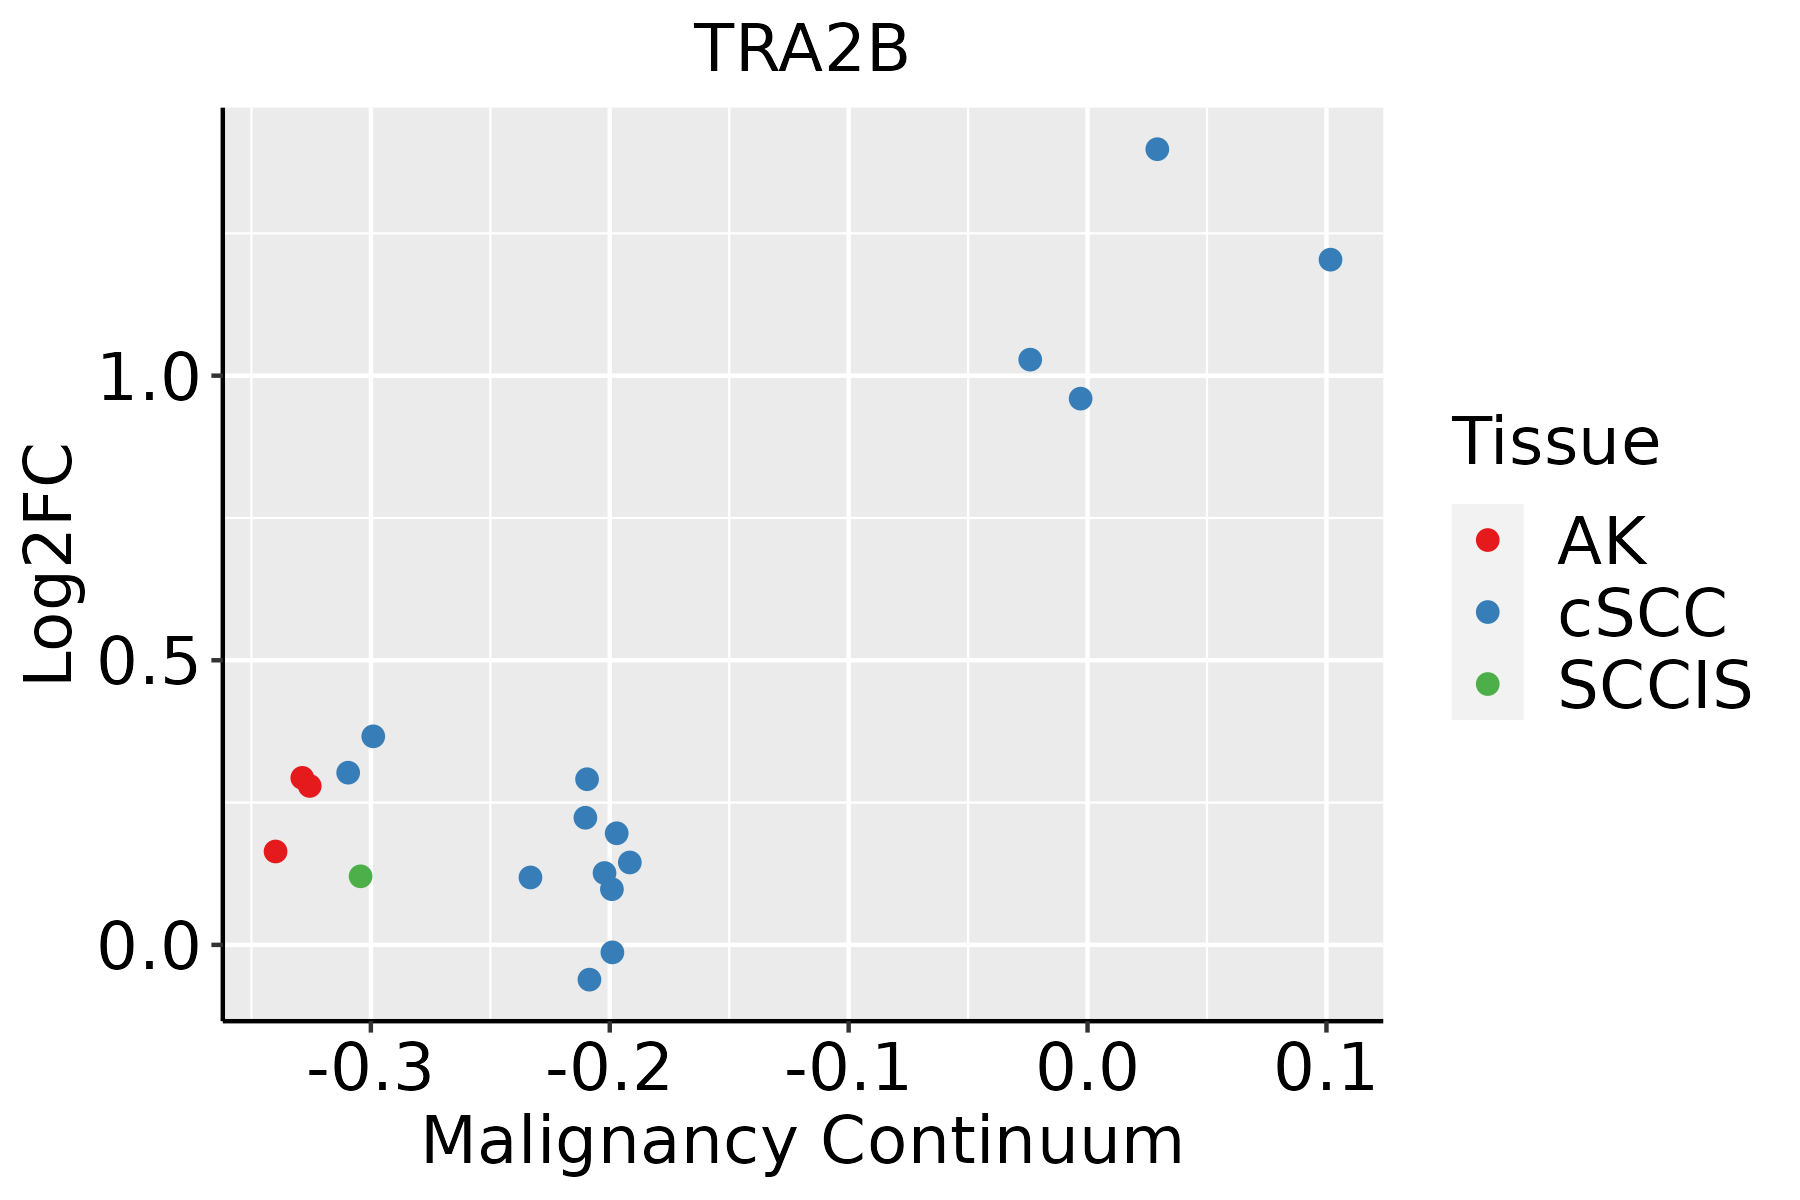 | AK: Actinic keratosis |
| cSCC: Cutaneous squamous cell carcinoma | ||
| SCCIS:squamous cell carcinoma in situ | ||
| Thyroid | 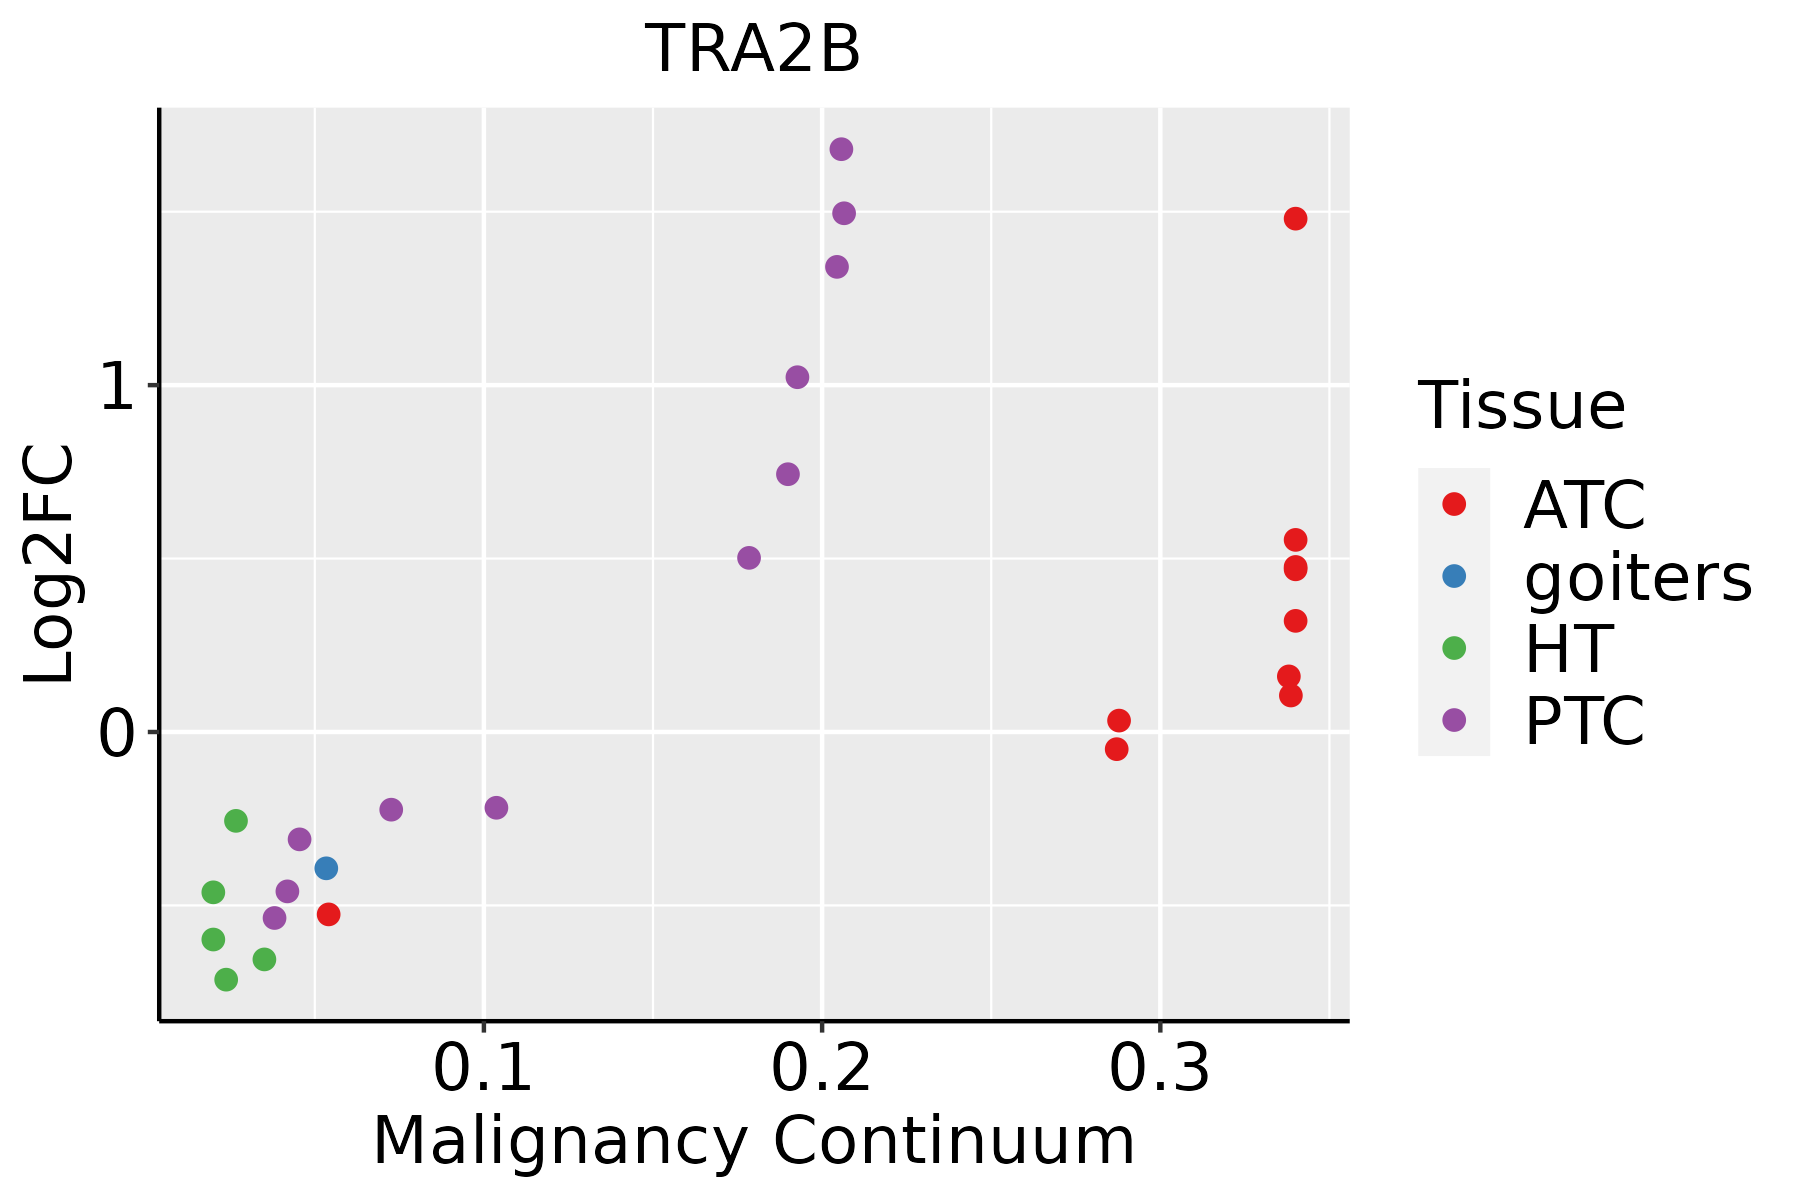 | ATC: Anaplastic thyroid cancer |
| HT: Hashimoto's thyroiditis | ||
| PTC: Papillary thyroid cancer |
| ∗log2FC in expression of this searched gene in stem-like cells from each diseased tissue sample relative to stem-like cells in normal samples in each tissue plotted against the malignancy continuum. Samples are colored based on if they are from different disease stage. |
Top |
Malignant transformation related pathway analysis |
| Find out the enriched GO biological processes and KEGG pathways involved in transition from healthy to precancer to cancer |
| Tissue | Disease Stage | Enriched GO biological Processes |
| Colorectum | AD |  |
| Colorectum | SER |  |
| Colorectum | MSS |  |
| Colorectum | MSI-H |  |
| Colorectum | FAP |  |
| ∗Top 15 enriched GO BP terms are showed in the bar plot of each disease state in each tissue. Each row represents a significant GO biological process which is colored according to the -log10(p.adjust). |
| Page: 1 2 3 4 5 6 7 8 9 |
| GO ID | Tissue | Disease Stage | Description | Gene Ratio | Bg Ratio | pvalue | p.adjust | Count |
| GO:00069799 | Breast | Precancer | response to oxidative stress | 70/1080 | 446/18723 | 1.59e-14 | 4.26e-12 | 70 |
| GO:00083809 | Breast | Precancer | RNA splicing | 65/1080 | 434/18723 | 1.27e-12 | 2.53e-10 | 65 |
| GO:00434849 | Breast | Precancer | regulation of RNA splicing | 34/1080 | 148/18723 | 2.66e-12 | 4.75e-10 | 34 |
| GO:00003759 | Breast | Precancer | RNA splicing, via transesterification reactions | 52/1080 | 324/18723 | 1.74e-11 | 2.22e-09 | 52 |
| GO:00003779 | Breast | Precancer | RNA splicing, via transesterification reactions with bulged adenosine as nucleophile | 51/1080 | 320/18723 | 3.55e-11 | 4.04e-09 | 51 |
| GO:00003989 | Breast | Precancer | mRNA splicing, via spliceosome | 51/1080 | 320/18723 | 3.55e-11 | 4.04e-09 | 51 |
| GO:00003029 | Breast | Precancer | response to reactive oxygen species | 38/1080 | 222/18723 | 1.47e-09 | 1.23e-07 | 38 |
| GO:00480249 | Breast | Precancer | regulation of mRNA splicing, via spliceosome | 22/1080 | 101/18723 | 5.29e-08 | 3.18e-06 | 22 |
| GO:19033118 | Breast | Precancer | regulation of mRNA metabolic process | 38/1080 | 288/18723 | 1.63e-06 | 5.97e-05 | 38 |
| GO:00506848 | Breast | Precancer | regulation of mRNA processing | 23/1080 | 137/18723 | 3.49e-06 | 1.13e-04 | 23 |
| GO:00003808 | Breast | Precancer | alternative mRNA splicing, via spliceosome | 15/1080 | 77/18723 | 2.86e-05 | 6.37e-04 | 15 |
| GO:00003818 | Breast | Precancer | regulation of alternative mRNA splicing, via spliceosome | 13/1080 | 60/18723 | 2.98e-05 | 6.58e-04 | 13 |
| GO:00342849 | Breast | Precancer | response to monosaccharide | 29/1080 | 225/18723 | 4.19e-05 | 9.00e-04 | 29 |
| GO:00097439 | Breast | Precancer | response to carbohydrate | 31/1080 | 253/18723 | 6.15e-05 | 1.25e-03 | 31 |
| GO:00425938 | Breast | Precancer | glucose homeostasis | 31/1080 | 258/18723 | 8.89e-05 | 1.69e-03 | 31 |
| GO:00335008 | Breast | Precancer | carbohydrate homeostasis | 31/1080 | 259/18723 | 9.56e-05 | 1.79e-03 | 31 |
| GO:00097469 | Breast | Precancer | response to hexose | 27/1080 | 219/18723 | 1.61e-04 | 2.69e-03 | 27 |
| GO:00331207 | Breast | Precancer | positive regulation of RNA splicing | 9/1080 | 37/18723 | 1.96e-04 | 3.10e-03 | 9 |
| GO:00097498 | Breast | Precancer | response to glucose | 25/1080 | 212/18723 | 5.46e-04 | 7.00e-03 | 25 |
| GO:00016787 | Breast | Precancer | cellular glucose homeostasis | 21/1080 | 172/18723 | 9.38e-04 | 1.06e-02 | 21 |
| Page: 1 2 3 4 5 6 7 8 9 10 11 12 13 14 15 16 17 18 19 20 21 22 23 24 25 26 27 28 29 30 31 32 33 34 35 36 37 38 39 40 |
| Pathway ID | Tissue | Disease Stage | Description | Gene Ratio | Bg Ratio | pvalue | p.adjust | qvalue | Count |
| hsa030408 | Breast | Precancer | Spliceosome | 39/684 | 217/8465 | 1.44e-06 | 2.27e-05 | 1.74e-05 | 39 |
| hsa0304013 | Breast | Precancer | Spliceosome | 39/684 | 217/8465 | 1.44e-06 | 2.27e-05 | 1.74e-05 | 39 |
| hsa0304023 | Breast | IDC | Spliceosome | 40/867 | 217/8465 | 1.53e-04 | 1.42e-03 | 1.06e-03 | 40 |
| hsa0304033 | Breast | IDC | Spliceosome | 40/867 | 217/8465 | 1.53e-04 | 1.42e-03 | 1.06e-03 | 40 |
| hsa0304043 | Breast | DCIS | Spliceosome | 40/846 | 217/8465 | 8.97e-05 | 8.52e-04 | 6.28e-04 | 40 |
| hsa0304053 | Breast | DCIS | Spliceosome | 40/846 | 217/8465 | 8.97e-05 | 8.52e-04 | 6.28e-04 | 40 |
| hsa03040 | Colorectum | AD | Spliceosome | 73/2092 | 217/8465 | 1.73e-03 | 9.68e-03 | 6.18e-03 | 73 |
| hsa030401 | Colorectum | AD | Spliceosome | 73/2092 | 217/8465 | 1.73e-03 | 9.68e-03 | 6.18e-03 | 73 |
| hsa030409 | Endometrium | AEH | Spliceosome | 54/1197 | 217/8465 | 1.47e-05 | 1.65e-04 | 1.21e-04 | 54 |
| hsa0304014 | Endometrium | AEH | Spliceosome | 54/1197 | 217/8465 | 1.47e-05 | 1.65e-04 | 1.21e-04 | 54 |
| hsa0304024 | Endometrium | EEC | Spliceosome | 54/1237 | 217/8465 | 3.78e-05 | 3.88e-04 | 2.89e-04 | 54 |
| hsa0304034 | Endometrium | EEC | Spliceosome | 54/1237 | 217/8465 | 3.78e-05 | 3.88e-04 | 2.89e-04 | 54 |
| hsa0304018 | Esophagus | HGIN | Spliceosome | 79/1383 | 217/8465 | 3.22e-13 | 7.00e-12 | 5.56e-12 | 79 |
| hsa0304019 | Esophagus | HGIN | Spliceosome | 79/1383 | 217/8465 | 3.22e-13 | 7.00e-12 | 5.56e-12 | 79 |
| hsa0304027 | Esophagus | ESCC | Spliceosome | 128/4205 | 217/8465 | 3.31e-03 | 8.79e-03 | 4.50e-03 | 128 |
| hsa0304037 | Esophagus | ESCC | Spliceosome | 128/4205 | 217/8465 | 3.31e-03 | 8.79e-03 | 4.50e-03 | 128 |
| hsa030407 | Liver | Cirrhotic | Spliceosome | 102/2530 | 217/8465 | 5.69e-08 | 9.47e-07 | 5.84e-07 | 102 |
| hsa04936 | Liver | Cirrhotic | Alcoholic liver disease | 60/2530 | 142/8465 | 1.07e-03 | 5.85e-03 | 3.61e-03 | 60 |
| hsa0304012 | Liver | Cirrhotic | Spliceosome | 102/2530 | 217/8465 | 5.69e-08 | 9.47e-07 | 5.84e-07 | 102 |
| hsa049361 | Liver | Cirrhotic | Alcoholic liver disease | 60/2530 | 142/8465 | 1.07e-03 | 5.85e-03 | 3.61e-03 | 60 |
| Page: 1 2 |
Top |
Cell-cell communication analysis |
| Identification of potential cell-cell interactions between two cell types and their ligand-receptor pairs for different disease states |
| Ligand | Receptor | LRpair | Pathway | Tissue | Disease Stage |
| Page: 1 |
Top |
Single-cell gene regulatory network inference analysis |
| Find out the significant the regulons (TFs) and the target genes of each regulon across cell types for different disease states |
| TF | Cell Type | Tissue | Disease Stage | Target Gene | RSS | Regulon Activity |
| ∗The dot plots of a searched regulon are shown for all cell subpopulations in each disease state of each tissue based on the regulon specific score inferred using pySCENIC and by calculating the average expression. |
| Page: 1 |
Top |
Somatic mutation of malignant transformation related genes |
| Annotation of somatic variants for genes involved in malignant transformation |
| Hugo Symbol | Variant Class | Variant Classification | dbSNP RS | HGVSc | HGVSp | HGVSp Short | SWISSPROT | BIOTYPE | SIFT | PolyPhen | Tumor Sample Barcode | Tissue | Histology | Sex | Age | Stage | Therapy Types | Drugs | Outcome |
| TRA2B | SNV | Missense_Mutation | c.62G>A | p.Gly21Glu | p.G21E | P62995 | protein_coding | deleterious_low_confidence(0.04) | benign(0.134) | TCGA-A2-A0YM-01 | Breast | breast invasive carcinoma | Female | >=65 | I/II | Unknown | Unknown | SD | |
| TRA2B | SNV | Missense_Mutation | rs758758553 | c.221N>A | p.Arg74His | p.R74H | P62995 | protein_coding | tolerated_low_confidence(0.27) | benign(0.375) | TCGA-AR-A254-01 | Breast | breast invasive carcinoma | Female | <65 | III/IV | Chemotherapy | paclitaxel | SD |
| TRA2B | SNV | Missense_Mutation | c.544A>T | p.Met182Leu | p.M182L | P62995 | protein_coding | tolerated(0.16) | benign(0.079) | TCGA-C8-A12T-01 | Breast | breast invasive carcinoma | Female | <65 | I/II | Unknown | Unknown | SD | |
| TRA2B | SNV | Missense_Mutation | c.186A>C | p.Arg62Ser | p.R62S | P62995 | protein_coding | tolerated_low_confidence(0.2) | benign(0.012) | TCGA-C8-A26Y-01 | Breast | breast invasive carcinoma | Female | >=65 | I/II | Unknown | Unknown | SD | |
| TRA2B | SNV | Missense_Mutation | novel | c.734N>C | p.Gly245Ala | p.G245A | P62995 | protein_coding | tolerated_low_confidence(0.07) | possibly_damaging(0.794) | TCGA-XX-A89A-01 | Breast | breast invasive carcinoma | Female | >=65 | I/II | Unknown | Unknown | SD |
| TRA2B | deletion | Frame_Shift_Del | novel | c.821delN | p.Tyr274SerfsTer18 | p.Y274Sfs*18 | P62995 | protein_coding | TCGA-EW-A2FV-01 | Breast | breast invasive carcinoma | Female | <65 | III/IV | Chemotherapy | docetaxel | SD | ||
| TRA2B | SNV | Missense_Mutation | novel | c.772N>G | p.Gln258Glu | p.Q258E | P62995 | protein_coding | tolerated_low_confidence(0.22) | benign(0.042) | TCGA-C5-A8XH-01 | Cervix | cervical & endocervical cancer | Female | <65 | I/II | Unknown | Unknown | SD |
| TRA2B | SNV | Missense_Mutation | c.275N>A | p.Arg92Lys | p.R92K | P62995 | protein_coding | deleterious(0.04) | possibly_damaging(0.745) | TCGA-EK-A2RN-01 | Cervix | cervical & endocervical cancer | Female | <65 | I/II | Unknown | Unknown | SD | |
| TRA2B | SNV | Missense_Mutation | novel | c.650N>T | p.Arg217Leu | p.R217L | P62995 | protein_coding | deleterious(0.01) | benign(0.003) | TCGA-JX-A5QV-01 | Cervix | cervical & endocervical cancer | Female | <65 | I/II | Unknown | Unknown | SD |
| TRA2B | SNV | Missense_Mutation | novel | c.296N>G | p.Ser99Cys | p.S99C | P62995 | protein_coding | deleterious(0) | probably_damaging(0.984) | TCGA-MY-A5BF-01 | Cervix | cervical & endocervical cancer | Female | >=65 | I/II | Chemotherapy | cisplatin | CR |
| Page: 1 2 3 4 5 6 |
Top |
Related drugs of malignant transformation related genes |
| Identification of chemicals and drugs interact with genes involved in malignant transfromation |
| (DGIdb 4.0) |
| Entrez ID | Symbol | Category | Interaction Types | Drug Claim Name | Drug Name | PMIDs |
| Page: 1 |

Copyright 2023-Present -The University of Texas Health Science Center at Houston |