
|
|||||
|
 | |
| |
| |
| |
| |
| |
|
Gene: TPX2 |
Gene summary for TPX2 |
| Gene information | Species | Human | Gene symbol | TPX2 | Gene ID | 22974 |
| Gene name | TPX2 microtubule nucleation factor | |
| Gene Alias | C20orf1 | |
| Cytomap | 20q11.21 | |
| Gene Type | protein-coding | GO ID | GO:0000226 | UniProtAcc | Q643R0 |
Top |
Malignant transformation analysis |
| Identification of the aberrant gene expression in precancerous and cancerous lesions by comparing the gene expression of stem-like cells in diseased tissues with normal stem cells |
| Entrez ID | Symbol | Replicates | Species | Organ | Tissue | Adj P-value | Log2FC | Malignancy |
| 22974 | TPX2 | HTA11_1938_2000001011 | Human | Colorectum | AD | 2.78e-05 | 3.30e-01 | -0.0811 |
| 22974 | TPX2 | HTA11_696_2000001011 | Human | Colorectum | AD | 2.20e-06 | 3.13e-01 | -0.1464 |
| 22974 | TPX2 | HTA11_1391_2000001011 | Human | Colorectum | AD | 7.21e-10 | 5.13e-01 | -0.059 |
| 22974 | TPX2 | HTA11_99999970781_79442 | Human | Colorectum | MSS | 4.39e-05 | 1.91e-01 | 0.294 |
| 22974 | TPX2 | HTA11_99999971662_82457 | Human | Colorectum | MSS | 3.90e-04 | 2.98e-01 | 0.3859 |
| 22974 | TPX2 | HTA11_99999973899_84307 | Human | Colorectum | MSS | 6.11e-04 | 2.51e-01 | 0.2585 |
| 22974 | TPX2 | LZE2T | Human | Esophagus | ESCC | 5.44e-10 | 1.16e+00 | 0.082 |
| 22974 | TPX2 | LZE4T | Human | Esophagus | ESCC | 3.18e-05 | 3.77e-01 | 0.0811 |
| 22974 | TPX2 | LZE7T | Human | Esophagus | ESCC | 3.98e-06 | 3.31e-01 | 0.0667 |
| 22974 | TPX2 | LZE20T | Human | Esophagus | ESCC | 3.16e-03 | 3.87e-01 | 0.0662 |
| 22974 | TPX2 | LZE22T | Human | Esophagus | ESCC | 1.54e-04 | 5.12e-01 | 0.068 |
| 22974 | TPX2 | LZE24T | Human | Esophagus | ESCC | 8.01e-19 | 8.61e-01 | 0.0596 |
| 22974 | TPX2 | LZE21T | Human | Esophagus | ESCC | 9.73e-05 | 4.66e-01 | 0.0655 |
| 22974 | TPX2 | LZE6T | Human | Esophagus | ESCC | 1.55e-08 | 3.94e-01 | 0.0845 |
| 22974 | TPX2 | P1T-E | Human | Esophagus | ESCC | 1.09e-04 | 5.22e-01 | 0.0875 |
| 22974 | TPX2 | P2T-E | Human | Esophagus | ESCC | 1.53e-19 | 9.10e-01 | 0.1177 |
| 22974 | TPX2 | P4T-E | Human | Esophagus | ESCC | 1.32e-23 | 9.12e-01 | 0.1323 |
| 22974 | TPX2 | P5T-E | Human | Esophagus | ESCC | 4.16e-22 | 5.93e-01 | 0.1327 |
| 22974 | TPX2 | P8T-E | Human | Esophagus | ESCC | 9.20e-06 | 2.92e-01 | 0.0889 |
| 22974 | TPX2 | P9T-E | Human | Esophagus | ESCC | 9.50e-13 | 6.04e-01 | 0.1131 |
| Page: 1 2 3 4 5 |
| Tissue | Expression Dynamics | Abbreviation |
| Colorectum (GSE201348) |  | FAP: Familial adenomatous polyposis |
| CRC: Colorectal cancer | ||
| Colorectum (HTA11) |  | AD: Adenomas |
| SER: Sessile serrated lesions | ||
| MSI-H: Microsatellite-high colorectal cancer | ||
| MSS: Microsatellite stable colorectal cancer | ||
| Esophagus | 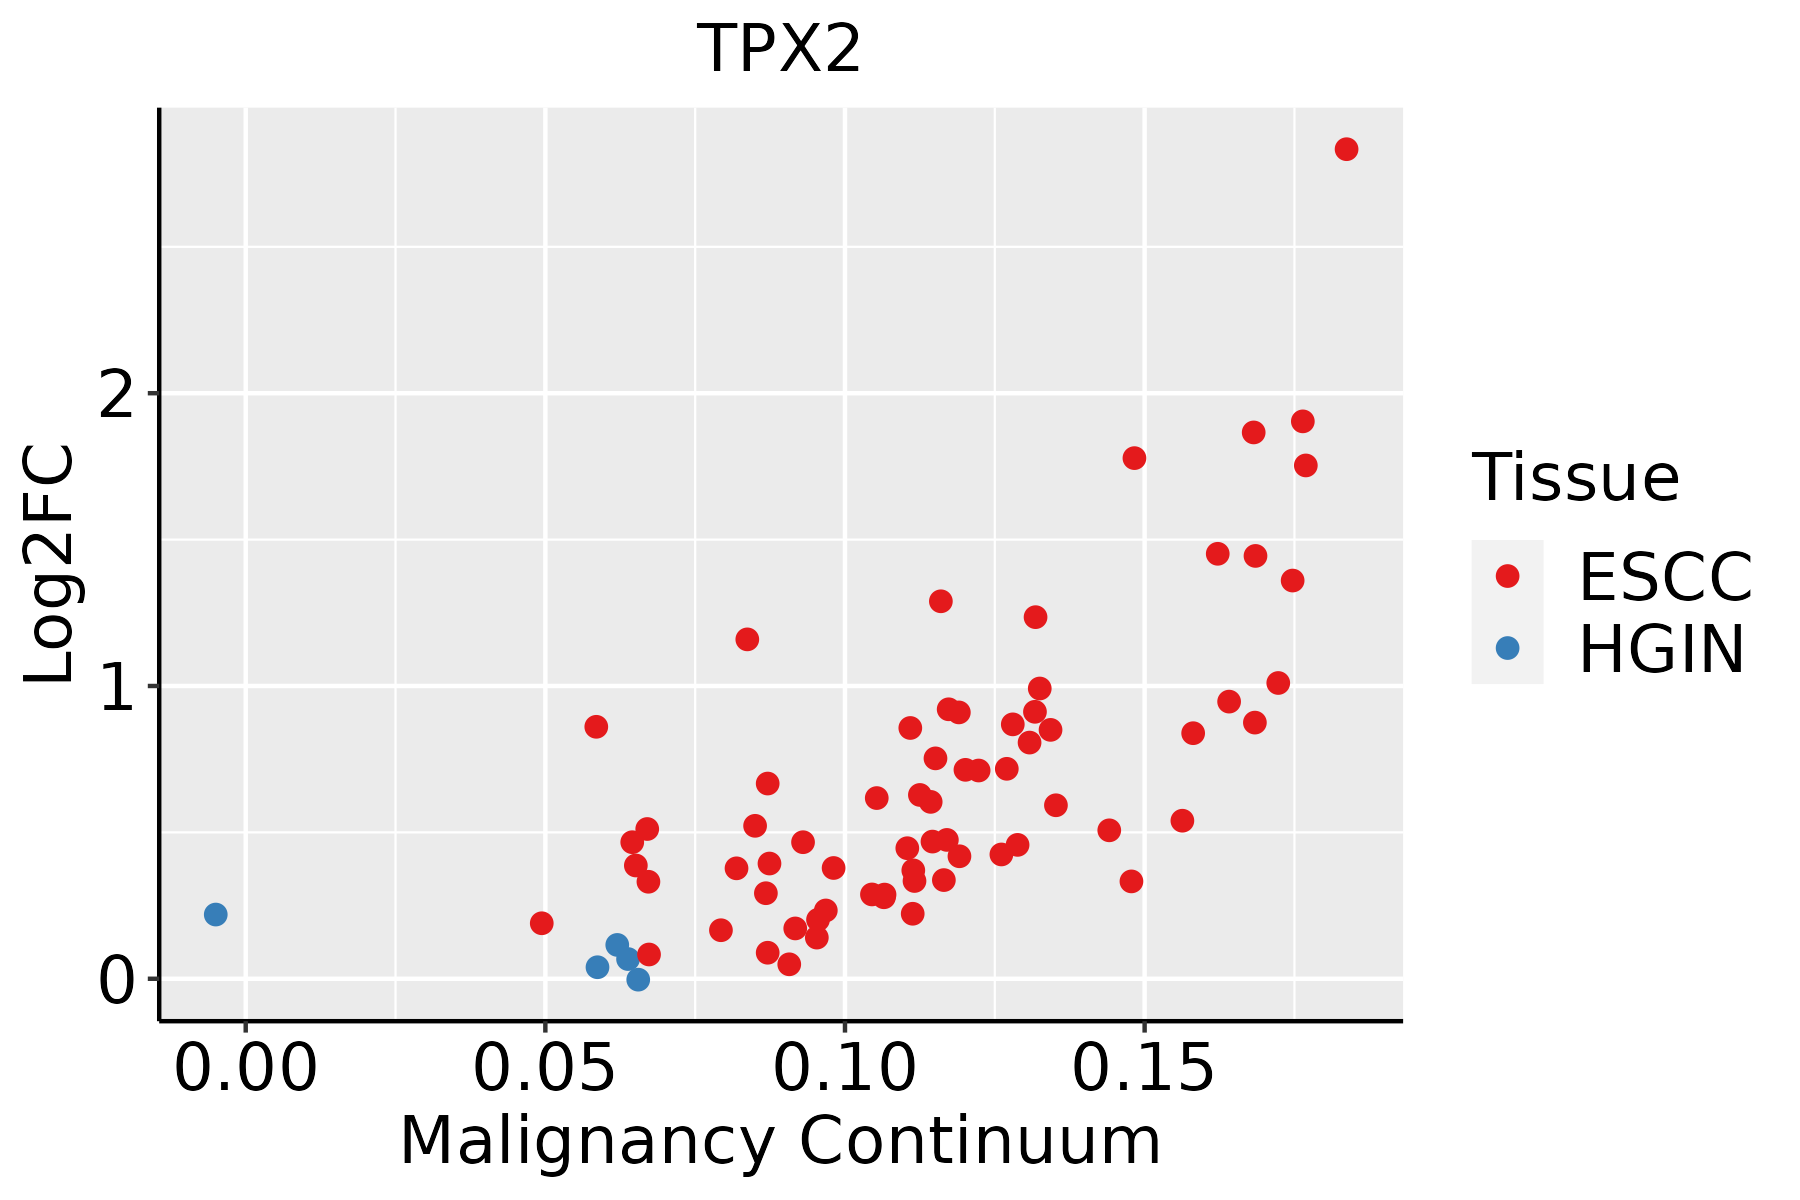 | ESCC: Esophageal squamous cell carcinoma |
| HGIN: High-grade intraepithelial neoplasias | ||
| LGIN: Low-grade intraepithelial neoplasias | ||
| Liver |  | HCC: Hepatocellular carcinoma |
| NAFLD: Non-alcoholic fatty liver disease | ||
| Oral Cavity |  | EOLP: Erosive Oral lichen planus |
| LP: leukoplakia | ||
| NEOLP: Non-erosive oral lichen planus | ||
| OSCC: Oral squamous cell carcinoma | ||
| Skin |  | AK: Actinic keratosis |
| cSCC: Cutaneous squamous cell carcinoma | ||
| SCCIS:squamous cell carcinoma in situ | ||
| Thyroid |  | ATC: Anaplastic thyroid cancer |
| HT: Hashimoto's thyroiditis | ||
| PTC: Papillary thyroid cancer |
| ∗log2FC in expression of this searched gene in stem-like cells from each diseased tissue sample relative to stem-like cells in normal samples in each tissue plotted against the malignancy continuum. Samples are colored based on if they are from different disease stage. |
Top |
Malignant transformation related pathway analysis |
| Find out the enriched GO biological processes and KEGG pathways involved in transition from healthy to precancer to cancer |
| Tissue | Disease Stage | Enriched GO biological Processes |
| Colorectum | AD |  |
| Colorectum | SER |  |
| Colorectum | MSS |  |
| Colorectum | MSI-H |  |
| Colorectum | FAP |  |
| ∗Top 15 enriched GO BP terms are showed in the bar plot of each disease state in each tissue. Each row represents a significant GO biological process which is colored according to the -log10(p.adjust). |
| Page: 1 2 3 4 5 6 7 8 9 |
| GO ID | Tissue | Disease Stage | Description | Gene Ratio | Bg Ratio | pvalue | p.adjust | Count |
| GO:1902903 | Colorectum | AD | regulation of supramolecular fiber organization | 139/3918 | 383/18723 | 2.01e-12 | 3.19e-10 | 139 |
| GO:0051258 | Colorectum | AD | protein polymerization | 112/3918 | 297/18723 | 1.85e-11 | 2.27e-09 | 112 |
| GO:0022411 | Colorectum | AD | cellular component disassembly | 147/3918 | 443/18723 | 8.53e-10 | 6.76e-08 | 147 |
| GO:0032984 | Colorectum | AD | protein-containing complex disassembly | 81/3918 | 224/18723 | 9.41e-08 | 4.65e-06 | 81 |
| GO:0010639 | Colorectum | AD | negative regulation of organelle organization | 114/3918 | 348/18723 | 1.41e-07 | 6.49e-06 | 114 |
| GO:1902904 | Colorectum | AD | negative regulation of supramolecular fiber organization | 60/3918 | 167/18723 | 5.23e-06 | 1.35e-04 | 60 |
| GO:0051494 | Colorectum | AD | negative regulation of cytoskeleton organization | 58/3918 | 163/18723 | 1.04e-05 | 2.40e-04 | 58 |
| GO:0033674 | Colorectum | AD | positive regulation of kinase activity | 131/3918 | 467/18723 | 1.28e-04 | 1.85e-03 | 131 |
| GO:0007051 | Colorectum | AD | spindle organization | 58/3918 | 184/18723 | 4.71e-04 | 5.20e-03 | 58 |
| GO:1902850 | Colorectum | AD | microtubule cytoskeleton organization involved in mitosis | 48/3918 | 147/18723 | 5.87e-04 | 6.21e-03 | 48 |
| GO:0043244 | Colorectum | AD | regulation of protein-containing complex disassembly | 41/3918 | 121/18723 | 6.22e-04 | 6.48e-03 | 41 |
| GO:0043624 | Colorectum | AD | cellular protein complex disassembly | 45/3918 | 136/18723 | 6.24e-04 | 6.48e-03 | 45 |
| GO:0051261 | Colorectum | AD | protein depolymerization | 39/3918 | 114/18723 | 6.74e-04 | 6.91e-03 | 39 |
| GO:0045860 | Colorectum | AD | positive regulation of protein kinase activity | 107/3918 | 386/18723 | 8.01e-04 | 7.92e-03 | 107 |
| GO:0090307 | Colorectum | AD | mitotic spindle assembly | 25/3918 | 65/18723 | 9.12e-04 | 8.71e-03 | 25 |
| GO:0007052 | Colorectum | AD | mitotic spindle organization | 40/3918 | 120/18723 | 1.03e-03 | 9.61e-03 | 40 |
| GO:0043242 | Colorectum | AD | negative regulation of protein-containing complex disassembly | 29/3918 | 82/18723 | 1.76e-03 | 1.45e-02 | 29 |
| GO:1901880 | Colorectum | AD | negative regulation of protein depolymerization | 26/3918 | 72/18723 | 2.12e-03 | 1.68e-02 | 26 |
| GO:1901879 | Colorectum | AD | regulation of protein depolymerization | 30/3918 | 87/18723 | 2.32e-03 | 1.80e-02 | 30 |
| GO:0051225 | Colorectum | AD | spindle assembly | 37/3918 | 117/18723 | 4.32e-03 | 2.96e-02 | 37 |
| Page: 1 2 3 4 5 6 7 8 9 |
| Pathway ID | Tissue | Disease Stage | Description | Gene Ratio | Bg Ratio | pvalue | p.adjust | qvalue | Count |
| Page: 1 |
Top |
Cell-cell communication analysis |
| Identification of potential cell-cell interactions between two cell types and their ligand-receptor pairs for different disease states |
| Ligand | Receptor | LRpair | Pathway | Tissue | Disease Stage |
| Page: 1 |
Top |
Single-cell gene regulatory network inference analysis |
| Find out the significant the regulons (TFs) and the target genes of each regulon across cell types for different disease states |
| TF | Cell Type | Tissue | Disease Stage | Target Gene | RSS | Regulon Activity |
| ∗The dot plots of a searched regulon are shown for all cell subpopulations in each disease state of each tissue based on the regulon specific score inferred using pySCENIC and by calculating the average expression. |
| Page: 1 |
Top |
Somatic mutation of malignant transformation related genes |
| Annotation of somatic variants for genes involved in malignant transformation |
| Hugo Symbol | Variant Class | Variant Classification | dbSNP RS | HGVSc | HGVSp | HGVSp Short | SWISSPROT | BIOTYPE | SIFT | PolyPhen | Tumor Sample Barcode | Tissue | Histology | Sex | Age | Stage | Therapy Types | Drugs | Outcome |
| TPX2 | SNV | Missense_Mutation | c.1076C>T | p.Ser359Phe | p.S359F | Q9ULW0 | protein_coding | deleterious(0.05) | benign(0.024) | TCGA-AC-A23H-01 | Breast | breast invasive carcinoma | Female | >=65 | I/II | Unknown | Unknown | PD | |
| TPX2 | insertion | In_Frame_Ins | novel | c.1686_1686+1insTTTAGA | p.Glu562_Val563insPheArg | p.E562_V563insFR | Q9ULW0 | protein_coding | TCGA-AN-A0FF-01 | Breast | breast invasive carcinoma | Female | <65 | I/II | Unknown | Unknown | SD | ||
| TPX2 | SNV | Missense_Mutation | c.1903N>G | p.Gln635Glu | p.Q635E | Q9ULW0 | protein_coding | deleterious(0) | probably_damaging(0.978) | TCGA-DR-A0ZM-01 | Cervix | cervical & endocervical cancer | Female | <65 | III/IV | Unspecific | Cisplatin | SD | |
| TPX2 | SNV | Missense_Mutation | novel | c.1108N>G | p.Pro370Ala | p.P370A | Q9ULW0 | protein_coding | deleterious(0.01) | probably_damaging(0.999) | TCGA-ZJ-AAXB-01 | Cervix | cervical & endocervical cancer | Female | <65 | I/II | Unknown | Unknown | SD |
| TPX2 | SNV | Missense_Mutation | c.4N>C | p.Ser2Pro | p.S2P | Q9ULW0 | protein_coding | deleterious_low_confidence(0.04) | possibly_damaging(0.812) | TCGA-AA-3845-01 | Colorectum | colon adenocarcinoma | Female | >=65 | I/II | Unknown | Unknown | PD | |
| TPX2 | SNV | Missense_Mutation | novel | c.1932G>T | p.Lys644Asn | p.K644N | Q9ULW0 | protein_coding | tolerated(0.98) | benign(0.011) | TCGA-AA-3984-01 | Colorectum | colon adenocarcinoma | Female | <65 | I/II | Unknown | Unknown | SD |
| TPX2 | SNV | Missense_Mutation | c.417A>C | p.Lys139Asn | p.K139N | Q9ULW0 | protein_coding | deleterious(0.04) | benign(0) | TCGA-AA-A00N-01 | Colorectum | colon adenocarcinoma | Male | >=65 | I/II | Unknown | Unknown | PD | |
| TPX2 | SNV | Missense_Mutation | c.1411N>T | p.Val471Leu | p.V471L | Q9ULW0 | protein_coding | deleterious(0.01) | probably_damaging(0.998) | TCGA-AD-6895-01 | Colorectum | colon adenocarcinoma | Male | >=65 | III/IV | Unknown | Unknown | SD | |
| TPX2 | SNV | Missense_Mutation | c.2168N>A | p.Gly723Asp | p.G723D | Q9ULW0 | protein_coding | tolerated(0.53) | benign(0.036) | TCGA-AD-6964-01 | Colorectum | colon adenocarcinoma | Male | <65 | III/IV | Chemotherapy | folfox | PD | |
| TPX2 | SNV | Missense_Mutation | rs754732212 | c.1447N>A | p.Val483Ile | p.V483I | Q9ULW0 | protein_coding | tolerated(0.11) | benign(0.063) | TCGA-AZ-4313-01 | Colorectum | colon adenocarcinoma | Female | <65 | I/II | Unknown | Unknown | SD |
| Page: 1 2 3 4 5 6 7 8 |
Top |
Related drugs of malignant transformation related genes |
| Identification of chemicals and drugs interact with genes involved in malignant transfromation |
| (DGIdb 4.0) |
| Entrez ID | Symbol | Category | Interaction Types | Drug Claim Name | Drug Name | PMIDs |
| Page: 1 |

Copyright 2023-Present -The University of Texas Health Science Center at Houston |