
|
|||||
|
 | |
| |
| |
| |
| |
| |
|
Gene: TPTEP2-CSNK1E |
Gene summary for TPTEP2-CSNK1E |
| Gene information | Species | Human | Gene symbol | TPTEP2-CSNK1E | Gene ID | 102800317 |
| Gene name | TPTEP2-CSNK1E readthrough | |
| Gene Alias | LOC400927-CSNK1E | |
| Cytomap | 22q13.1 | |
| Gene Type | protein-coding | GO ID | NA | UniProtAcc | B3KRV2 |
Top |
Malignant transformation analysis |
| Identification of the aberrant gene expression in precancerous and cancerous lesions by comparing the gene expression of stem-like cells in diseased tissues with normal stem cells |
| Entrez ID | Symbol | Replicates | Species | Organ | Tissue | Adj P-value | Log2FC | Malignancy |
| 102800317 | TPTEP2-CSNK1E | CCI_1 | Human | Cervix | CC | 1.30e-17 | 8.28e-01 | 0.528 |
| 102800317 | TPTEP2-CSNK1E | CCI_2 | Human | Cervix | CC | 2.30e-10 | 4.93e-01 | 0.5249 |
| 102800317 | TPTEP2-CSNK1E | CCI_3 | Human | Cervix | CC | 1.18e-26 | 1.08e+00 | 0.516 |
| 102800317 | TPTEP2-CSNK1E | HTA11_3410_2000001011 | Human | Colorectum | AD | 1.46e-19 | -5.02e-01 | 0.0155 |
| 102800317 | TPTEP2-CSNK1E | HTA11_2487_2000001011 | Human | Colorectum | SER | 3.13e-11 | -5.02e-01 | -0.1808 |
| 102800317 | TPTEP2-CSNK1E | HTA11_1938_2000001011 | Human | Colorectum | AD | 2.70e-08 | -5.02e-01 | -0.0811 |
| 102800317 | TPTEP2-CSNK1E | HTA11_78_2000001011 | Human | Colorectum | AD | 2.19e-13 | -5.02e-01 | -0.1088 |
| 102800317 | TPTEP2-CSNK1E | HTA11_347_2000001011 | Human | Colorectum | AD | 4.63e-21 | -5.02e-01 | -0.1954 |
| 102800317 | TPTEP2-CSNK1E | HTA11_3361_2000001011 | Human | Colorectum | AD | 1.18e-08 | -5.02e-01 | -0.1207 |
| 102800317 | TPTEP2-CSNK1E | HTA11_83_2000001011 | Human | Colorectum | SER | 1.01e-06 | -5.02e-01 | -0.1526 |
| 102800317 | TPTEP2-CSNK1E | HTA11_696_2000001011 | Human | Colorectum | AD | 1.38e-30 | -5.02e-01 | -0.1464 |
| 102800317 | TPTEP2-CSNK1E | HTA11_866_2000001011 | Human | Colorectum | AD | 9.10e-25 | -5.02e-01 | -0.1001 |
| 102800317 | TPTEP2-CSNK1E | HTA11_1391_2000001011 | Human | Colorectum | AD | 1.07e-15 | -5.02e-01 | -0.059 |
| 102800317 | TPTEP2-CSNK1E | HTA11_2992_2000001011 | Human | Colorectum | SER | 1.88e-02 | -5.02e-01 | -0.1706 |
| 102800317 | TPTEP2-CSNK1E | HTA11_5212_2000001011 | Human | Colorectum | AD | 4.23e-03 | -5.02e-01 | -0.2061 |
| 102800317 | TPTEP2-CSNK1E | HTA11_546_2000001011 | Human | Colorectum | AD | 1.17e-05 | -5.02e-01 | -0.0842 |
| 102800317 | TPTEP2-CSNK1E | HTA11_7862_2000001011 | Human | Colorectum | AD | 2.35e-04 | -5.02e-01 | -0.0179 |
| 102800317 | TPTEP2-CSNK1E | HTA11_866_3004761011 | Human | Colorectum | AD | 3.57e-17 | -5.02e-01 | 0.096 |
| 102800317 | TPTEP2-CSNK1E | HTA11_8622_2000001021 | Human | Colorectum | SER | 2.03e-03 | -5.02e-01 | 0.0528 |
| 102800317 | TPTEP2-CSNK1E | HTA11_10623_2000001011 | Human | Colorectum | AD | 4.79e-04 | -5.02e-01 | -0.0177 |
| Page: 1 2 3 |
| Tissue | Expression Dynamics | Abbreviation |
| Cervix | 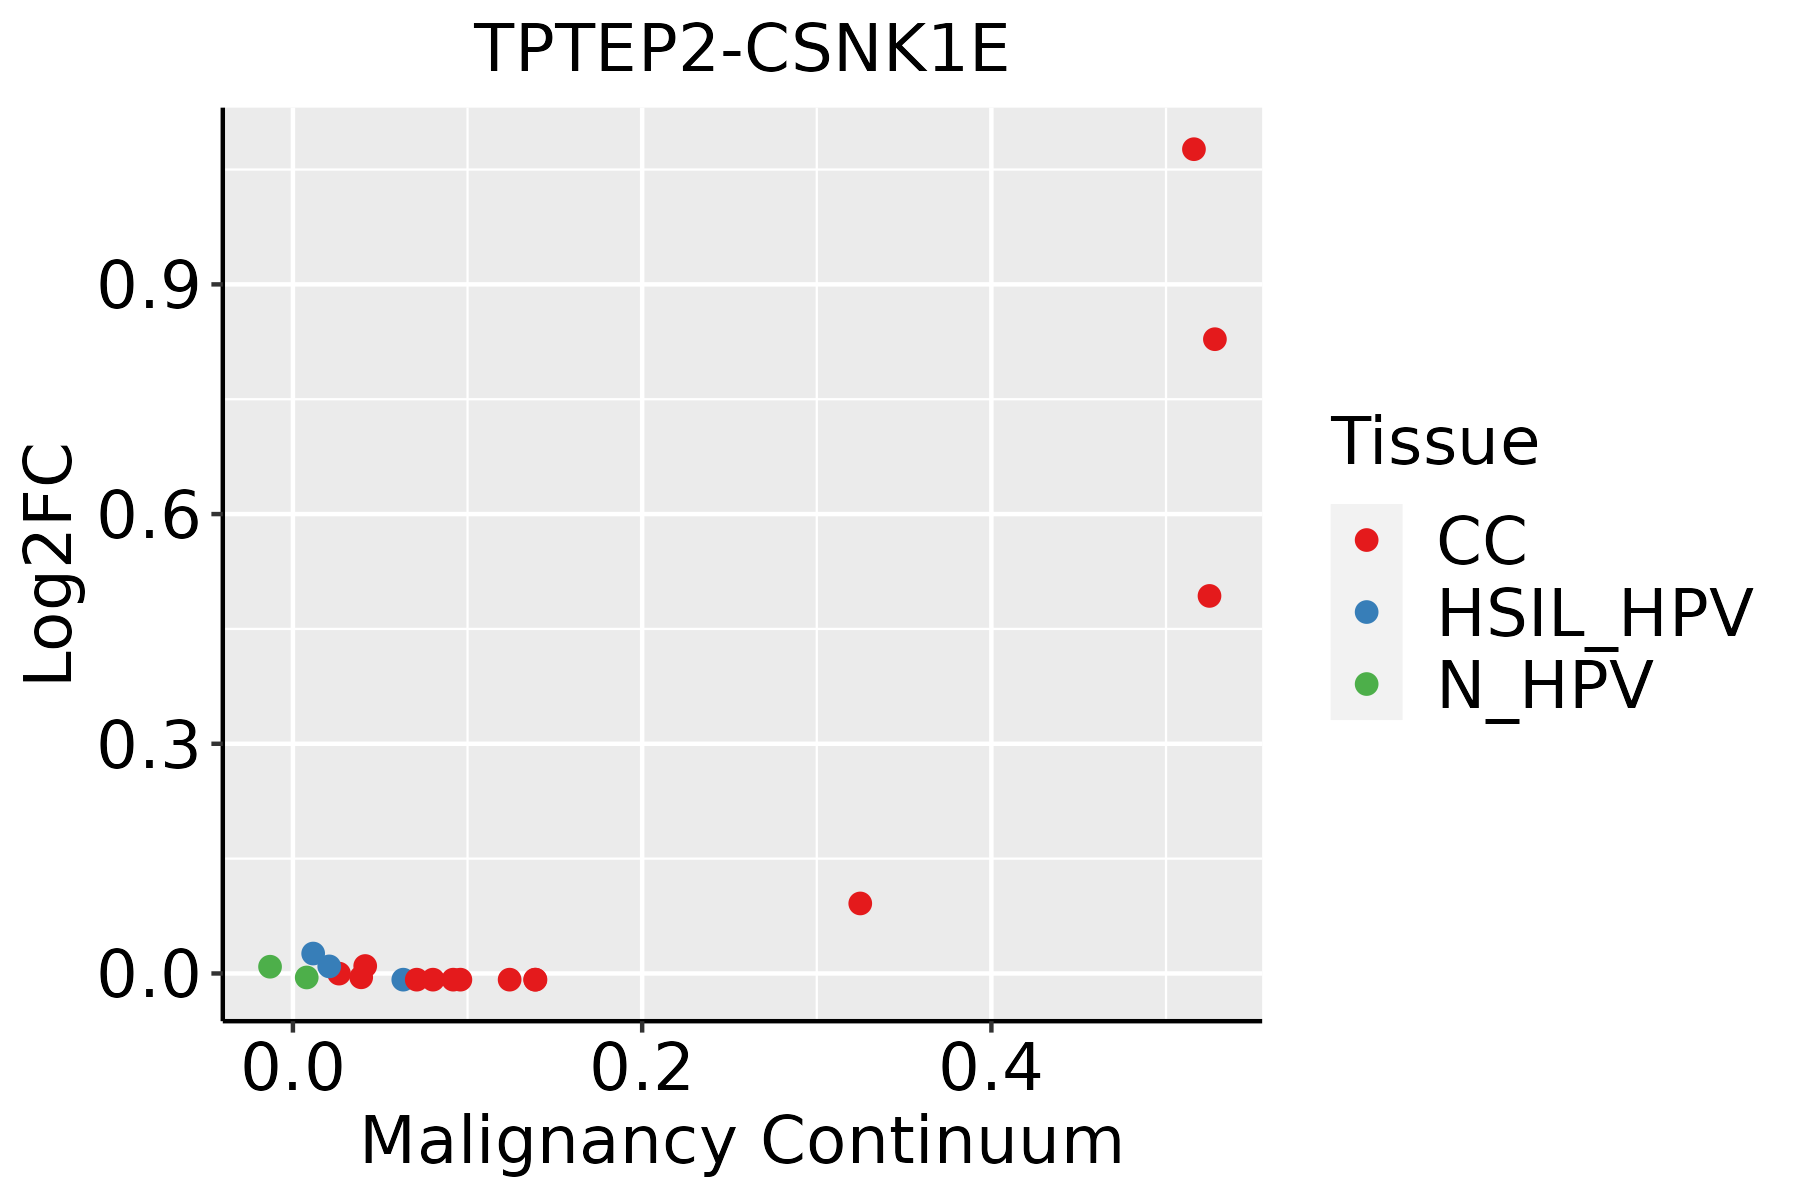 | CC: Cervix cancer |
| HSIL_HPV: HPV-infected high-grade squamous intraepithelial lesions | ||
| N_HPV: HPV-infected normal cervix | ||
| Colorectum (GSE201348) |  | FAP: Familial adenomatous polyposis |
| CRC: Colorectal cancer | ||
| Colorectum (HTA11) |  | AD: Adenomas |
| SER: Sessile serrated lesions | ||
| MSI-H: Microsatellite-high colorectal cancer | ||
| MSS: Microsatellite stable colorectal cancer |
| ∗log2FC in expression of this searched gene in stem-like cells from each diseased tissue sample relative to stem-like cells in normal samples in each tissue plotted against the malignancy continuum. Samples are colored based on if they are from different disease stage. |
Top |
Malignant transformation related pathway analysis |
| Find out the enriched GO biological processes and KEGG pathways involved in transition from healthy to precancer to cancer |
| Tissue | Disease Stage | Enriched GO biological Processes |
| Colorectum | AD |  |
| Colorectum | SER |  |
| Colorectum | MSS |  |
| Colorectum | MSI-H |  |
| Colorectum | FAP |  |
| ∗Top 15 enriched GO BP terms are showed in the bar plot of each disease state in each tissue. Each row represents a significant GO biological process which is colored according to the -log10(p.adjust). |
| Page: 1 2 3 4 5 6 7 8 9 |
| GO ID | Tissue | Disease Stage | Description | Gene Ratio | Bg Ratio | pvalue | p.adjust | Count |
| Page: 1 |
| Pathway ID | Tissue | Disease Stage | Description | Gene Ratio | Bg Ratio | pvalue | p.adjust | qvalue | Count |
| hsa0501018 | Cervix | CC | Alzheimer disease | 113/1267 | 384/8465 | 9.67e-14 | 3.92e-12 | 2.32e-12 | 113 |
| hsa0502218 | Cervix | CC | Pathways of neurodegeneration - multiple diseases | 128/1267 | 476/8465 | 2.87e-12 | 9.29e-11 | 5.50e-11 | 128 |
| hsa043109 | Cervix | CC | Wnt signaling pathway | 43/1267 | 171/8465 | 3.03e-04 | 1.64e-03 | 9.68e-04 | 43 |
| hsa043908 | Cervix | CC | Hippo signaling pathway | 40/1267 | 157/8465 | 3.64e-04 | 1.82e-03 | 1.07e-03 | 40 |
| hsa0501019 | Cervix | CC | Alzheimer disease | 113/1267 | 384/8465 | 9.67e-14 | 3.92e-12 | 2.32e-12 | 113 |
| hsa0502219 | Cervix | CC | Pathways of neurodegeneration - multiple diseases | 128/1267 | 476/8465 | 2.87e-12 | 9.29e-11 | 5.50e-11 | 128 |
| hsa0431012 | Cervix | CC | Wnt signaling pathway | 43/1267 | 171/8465 | 3.03e-04 | 1.64e-03 | 9.68e-04 | 43 |
| hsa0439013 | Cervix | CC | Hippo signaling pathway | 40/1267 | 157/8465 | 3.64e-04 | 1.82e-03 | 1.07e-03 | 40 |
| hsa05010 | Colorectum | AD | Alzheimer disease | 174/2092 | 384/8465 | 1.82e-19 | 9.26e-18 | 5.91e-18 | 174 |
| hsa05022 | Colorectum | AD | Pathways of neurodegeneration - multiple diseases | 201/2092 | 476/8465 | 4.54e-18 | 1.27e-16 | 8.09e-17 | 201 |
| hsa04310 | Colorectum | AD | Wnt signaling pathway | 56/2092 | 171/8465 | 1.03e-02 | 3.93e-02 | 2.51e-02 | 56 |
| hsa050101 | Colorectum | AD | Alzheimer disease | 174/2092 | 384/8465 | 1.82e-19 | 9.26e-18 | 5.91e-18 | 174 |
| hsa050221 | Colorectum | AD | Pathways of neurodegeneration - multiple diseases | 201/2092 | 476/8465 | 4.54e-18 | 1.27e-16 | 8.09e-17 | 201 |
| hsa043101 | Colorectum | AD | Wnt signaling pathway | 56/2092 | 171/8465 | 1.03e-02 | 3.93e-02 | 2.51e-02 | 56 |
| hsa050102 | Colorectum | SER | Alzheimer disease | 146/1580 | 384/8465 | 6.52e-20 | 2.40e-18 | 1.75e-18 | 146 |
| hsa050222 | Colorectum | SER | Pathways of neurodegeneration - multiple diseases | 168/1580 | 476/8465 | 6.23e-19 | 2.07e-17 | 1.50e-17 | 168 |
| hsa050103 | Colorectum | SER | Alzheimer disease | 146/1580 | 384/8465 | 6.52e-20 | 2.40e-18 | 1.75e-18 | 146 |
| hsa050223 | Colorectum | SER | Pathways of neurodegeneration - multiple diseases | 168/1580 | 476/8465 | 6.23e-19 | 2.07e-17 | 1.50e-17 | 168 |
| hsa050104 | Colorectum | MSS | Alzheimer disease | 169/1875 | 384/8465 | 1.21e-22 | 1.01e-20 | 6.21e-21 | 169 |
| hsa050224 | Colorectum | MSS | Pathways of neurodegeneration - multiple diseases | 192/1875 | 476/8465 | 2.79e-20 | 1.04e-18 | 6.36e-19 | 192 |
| Page: 1 2 |
Top |
Cell-cell communication analysis |
| Identification of potential cell-cell interactions between two cell types and their ligand-receptor pairs for different disease states |
| Ligand | Receptor | LRpair | Pathway | Tissue | Disease Stage |
| Page: 1 |
Top |
Single-cell gene regulatory network inference analysis |
| Find out the significant the regulons (TFs) and the target genes of each regulon across cell types for different disease states |
| TF | Cell Type | Tissue | Disease Stage | Target Gene | RSS | Regulon Activity |
| ∗The dot plots of a searched regulon are shown for all cell subpopulations in each disease state of each tissue based on the regulon specific score inferred using pySCENIC and by calculating the average expression. |
| Page: 1 |
Top |
Somatic mutation of malignant transformation related genes |
| Annotation of somatic variants for genes involved in malignant transformation |
| Hugo Symbol | Variant Class | Variant Classification | dbSNP RS | HGVSc | HGVSp | HGVSp Short | SWISSPROT | BIOTYPE | SIFT | PolyPhen | Tumor Sample Barcode | Tissue | Histology | Sex | Age | Stage | Therapy Types | Drugs | Outcome |
| Page: 1 |
Top |
Related drugs of malignant transformation related genes |
| Identification of chemicals and drugs interact with genes involved in malignant transfromation |
| (DGIdb 4.0) |
| Entrez ID | Symbol | Category | Interaction Types | Drug Claim Name | Drug Name | PMIDs |
| Page: 1 |

Copyright 2023-Present -The University of Texas Health Science Center at Houston |