| Tissue | Expression Dynamics | Abbreviation |
| Breast | 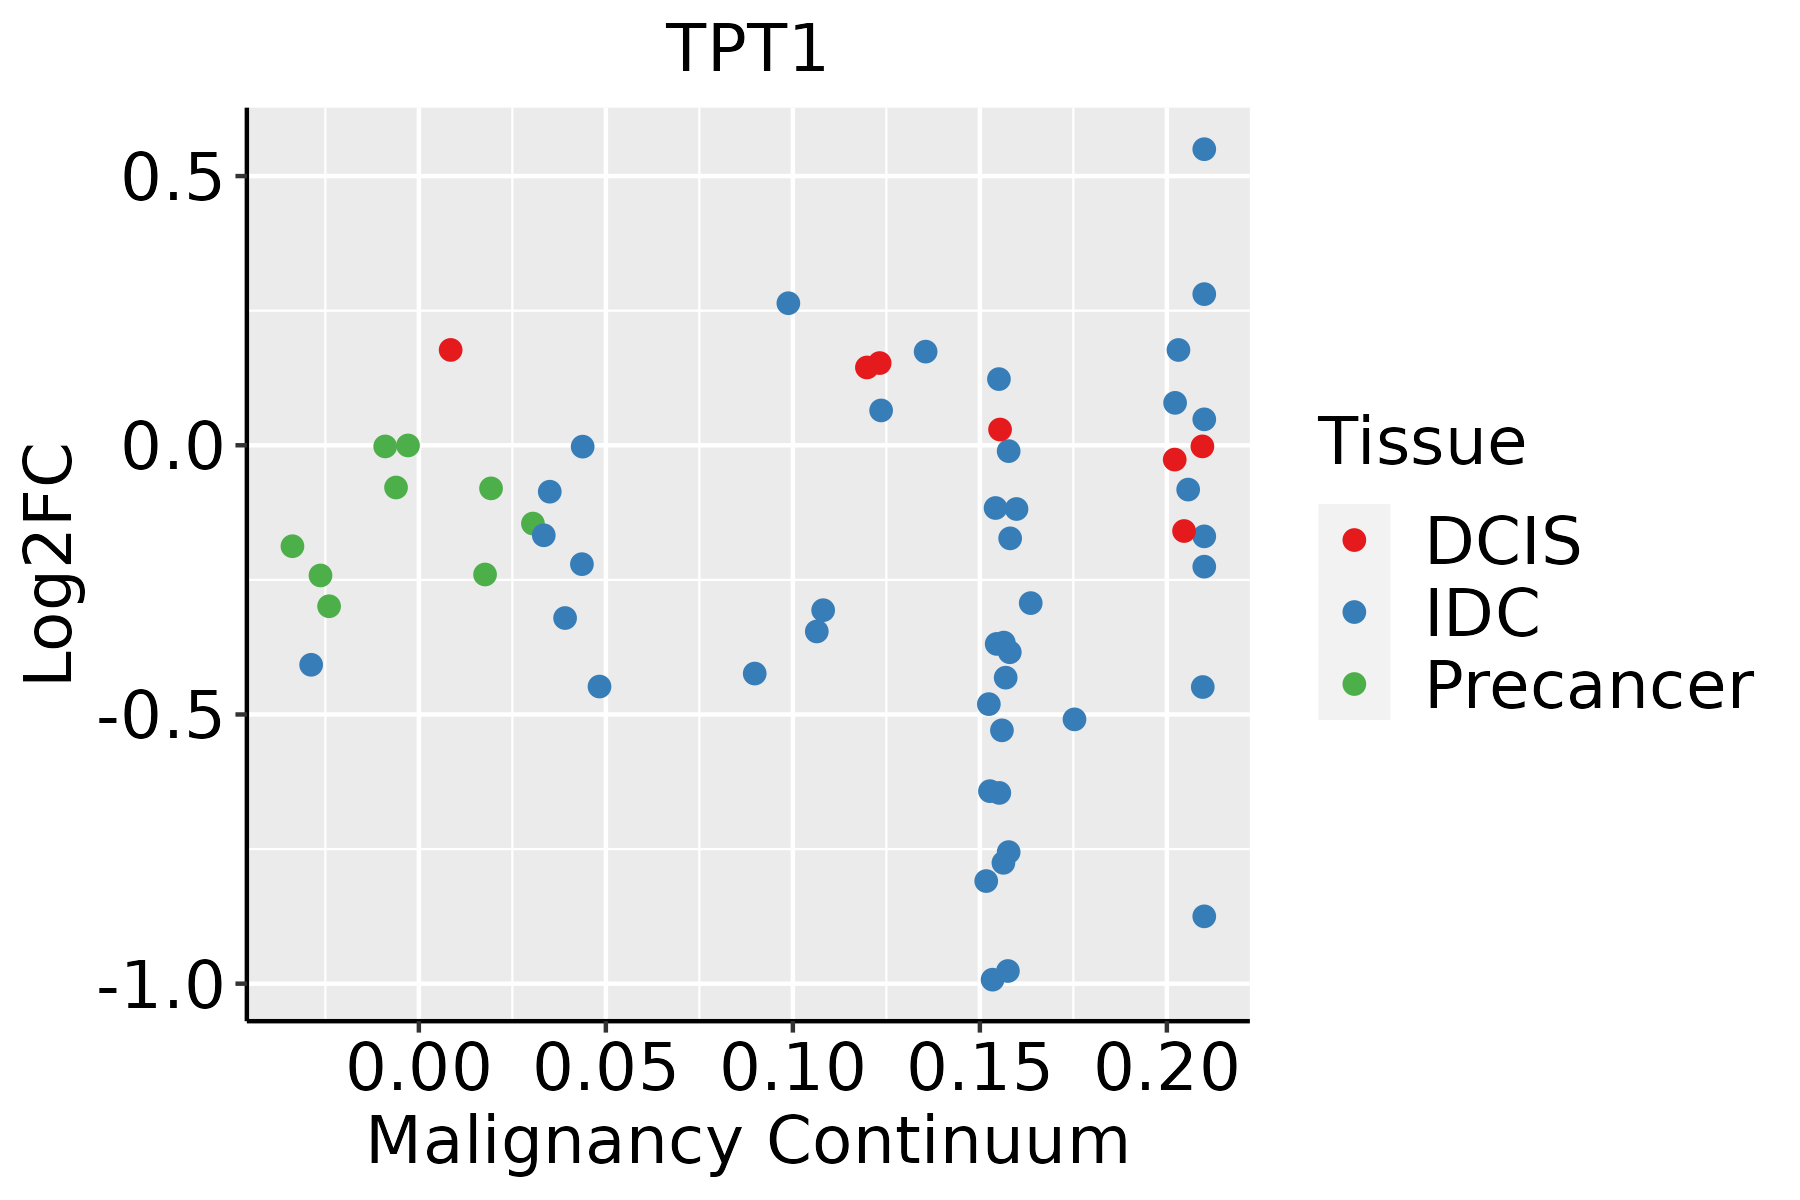 | IDC: Invasive ductal carcinoma |
| DCIS: Ductal carcinoma in situ |
| Precancer(BRCA1-mut): Precancerous lesion from BRCA1 mutation carriers |
| Cervix | 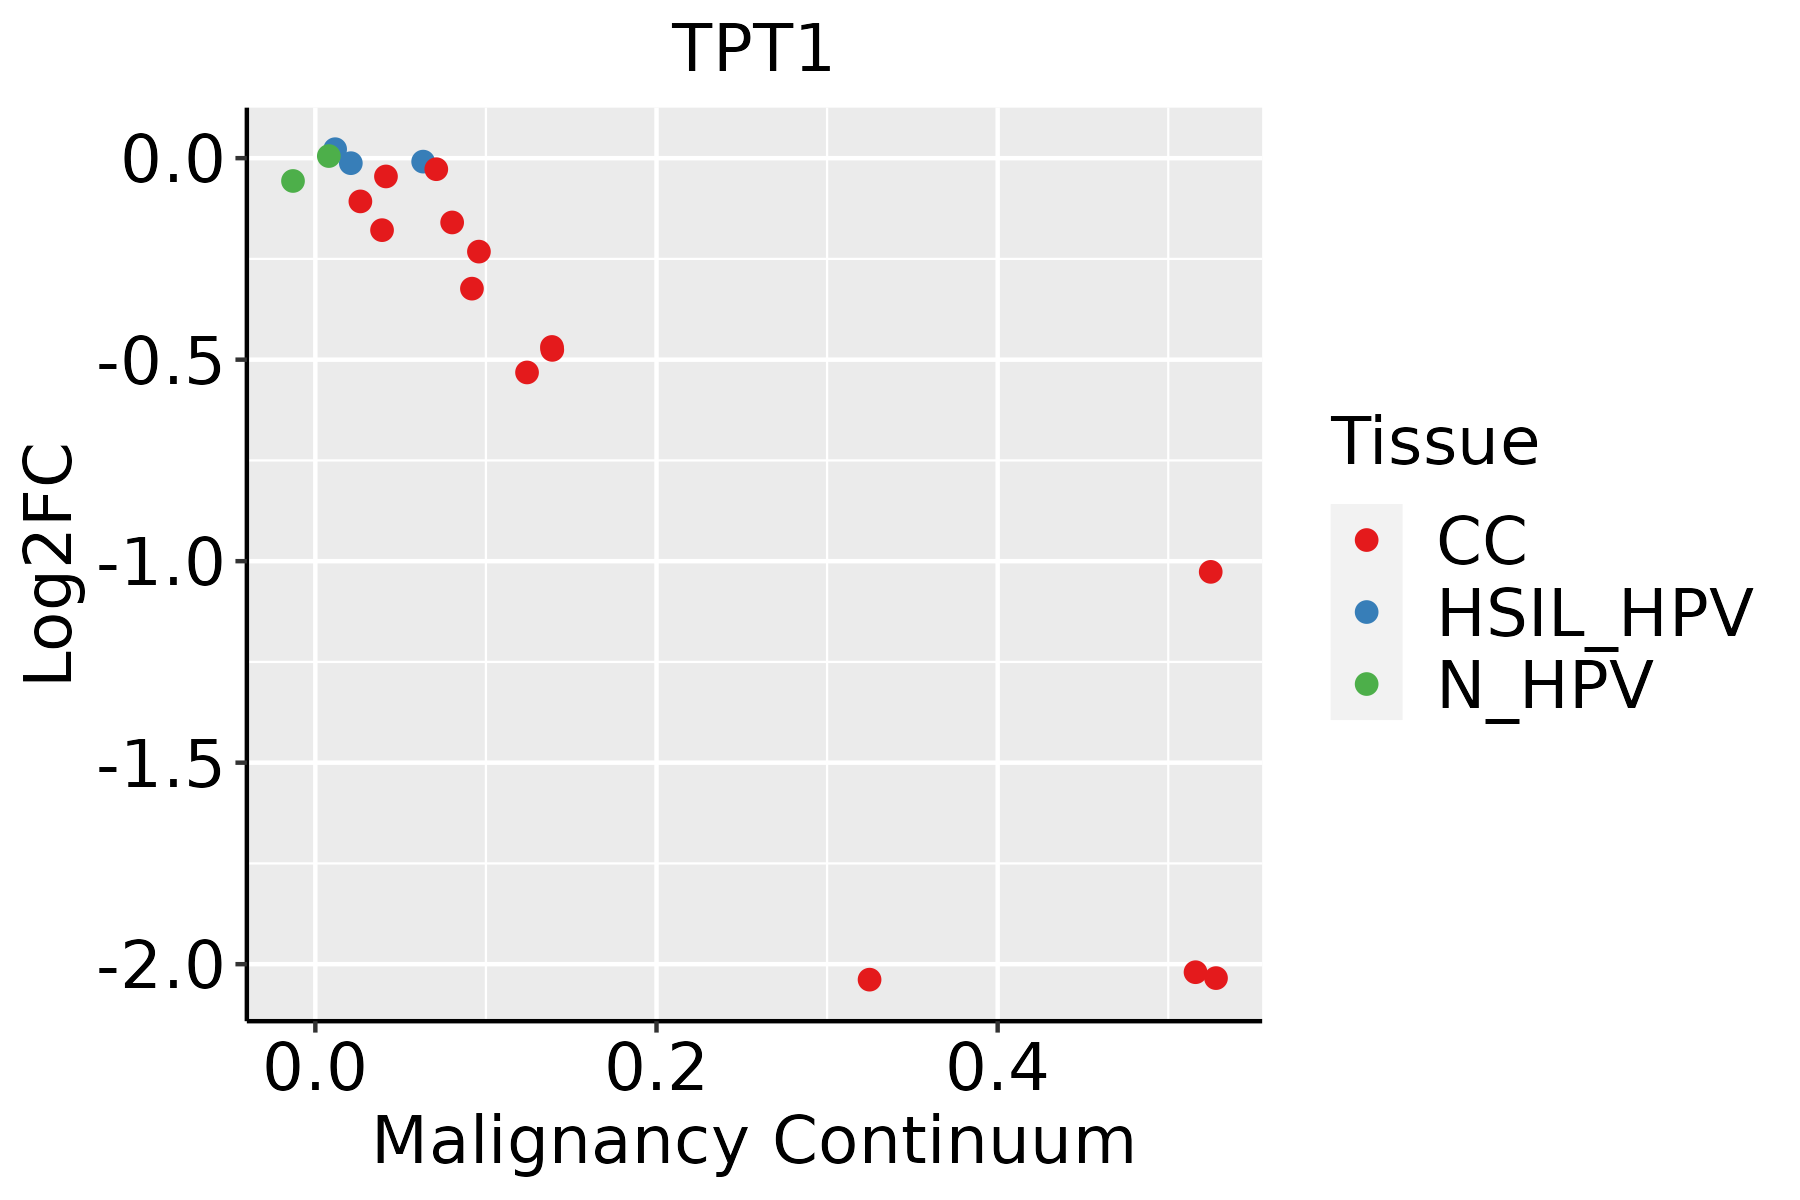 | CC: Cervix cancer |
| HSIL_HPV: HPV-infected high-grade squamous intraepithelial lesions |
| N_HPV: HPV-infected normal cervix |
| Colorectum (GSE201348) |  | FAP: Familial adenomatous polyposis |
| CRC: Colorectal cancer |
| Colorectum (HTA11) |  | AD: Adenomas |
| SER: Sessile serrated lesions |
| MSI-H: Microsatellite-high colorectal cancer |
| MSS: Microsatellite stable colorectal cancer |
| Endometrium | 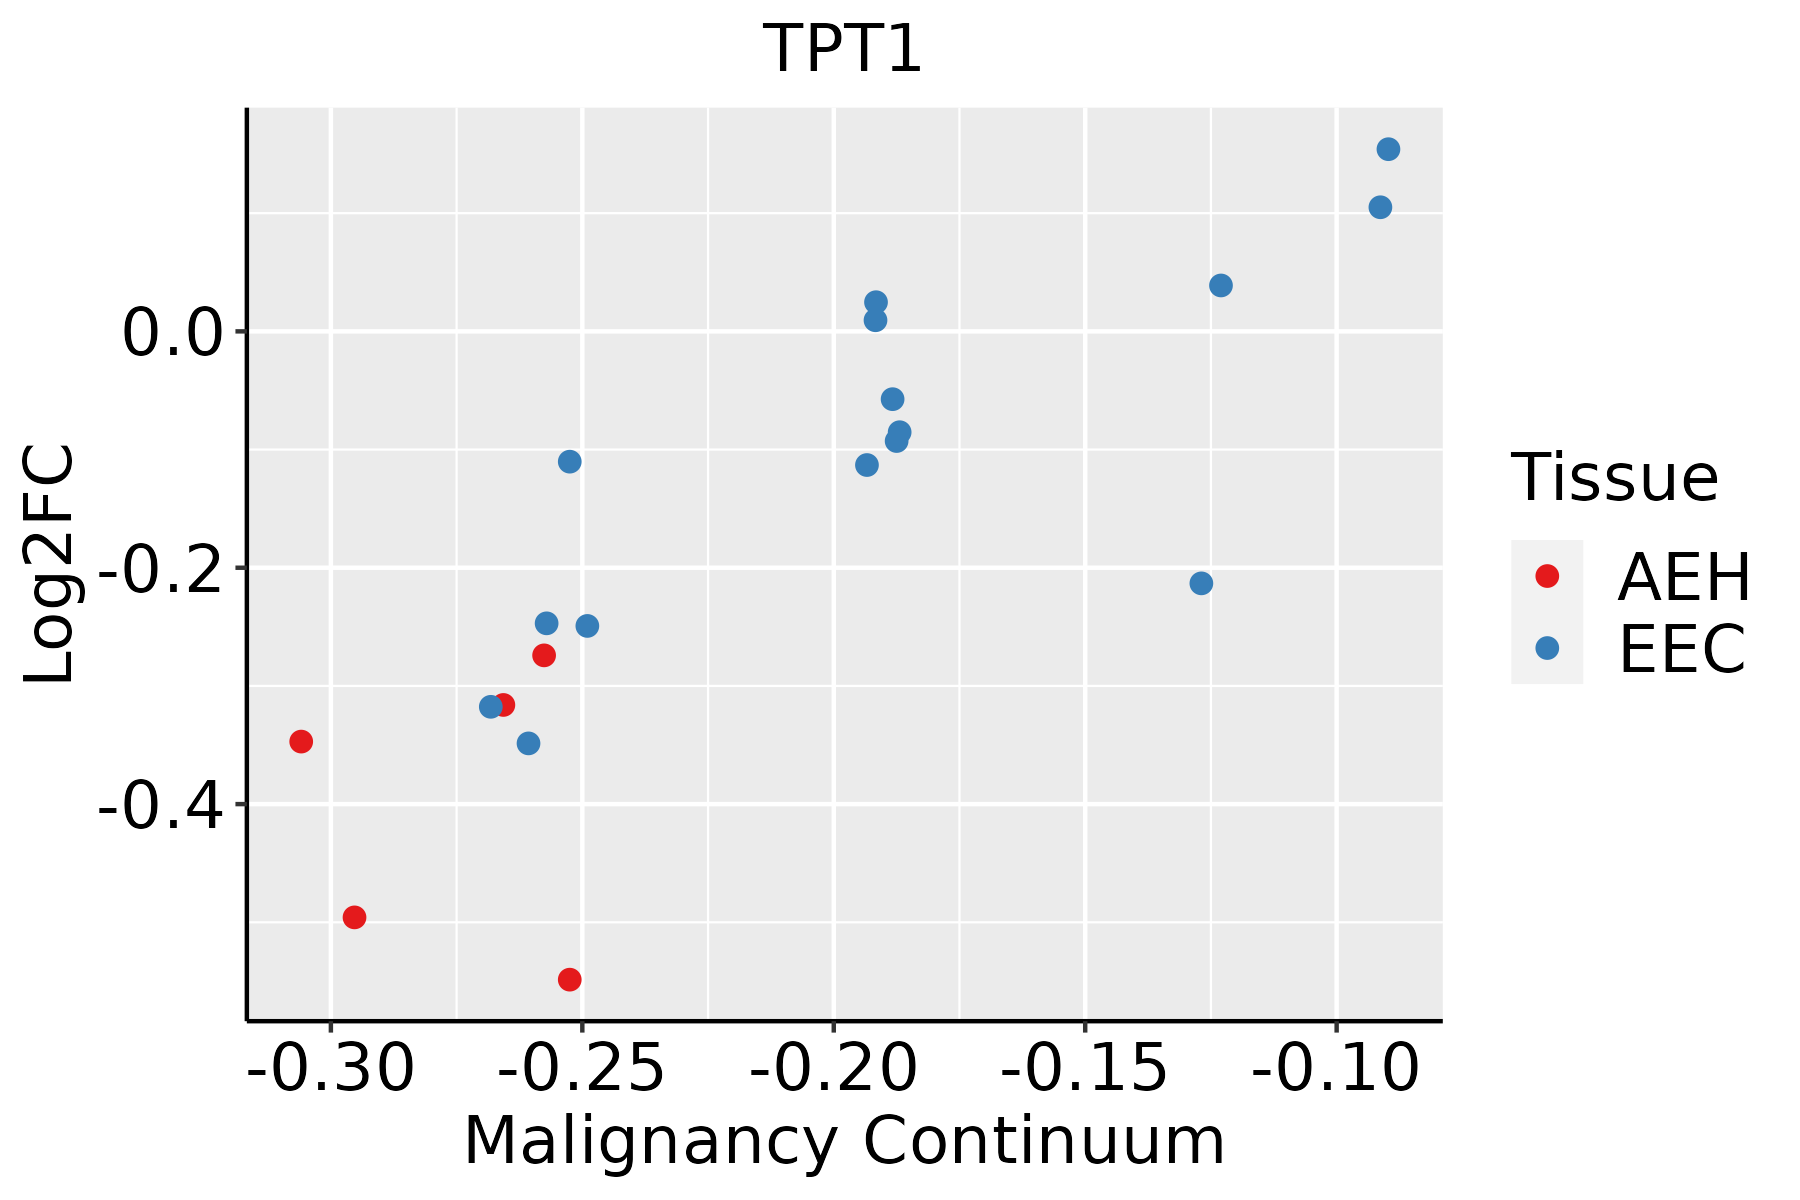 | AEH: Atypical endometrial hyperplasia |
| EEC: Endometrioid Cancer |
| Esophagus |  | ESCC: Esophageal squamous cell carcinoma |
| HGIN: High-grade intraepithelial neoplasias |
| LGIN: Low-grade intraepithelial neoplasias |
| Liver | 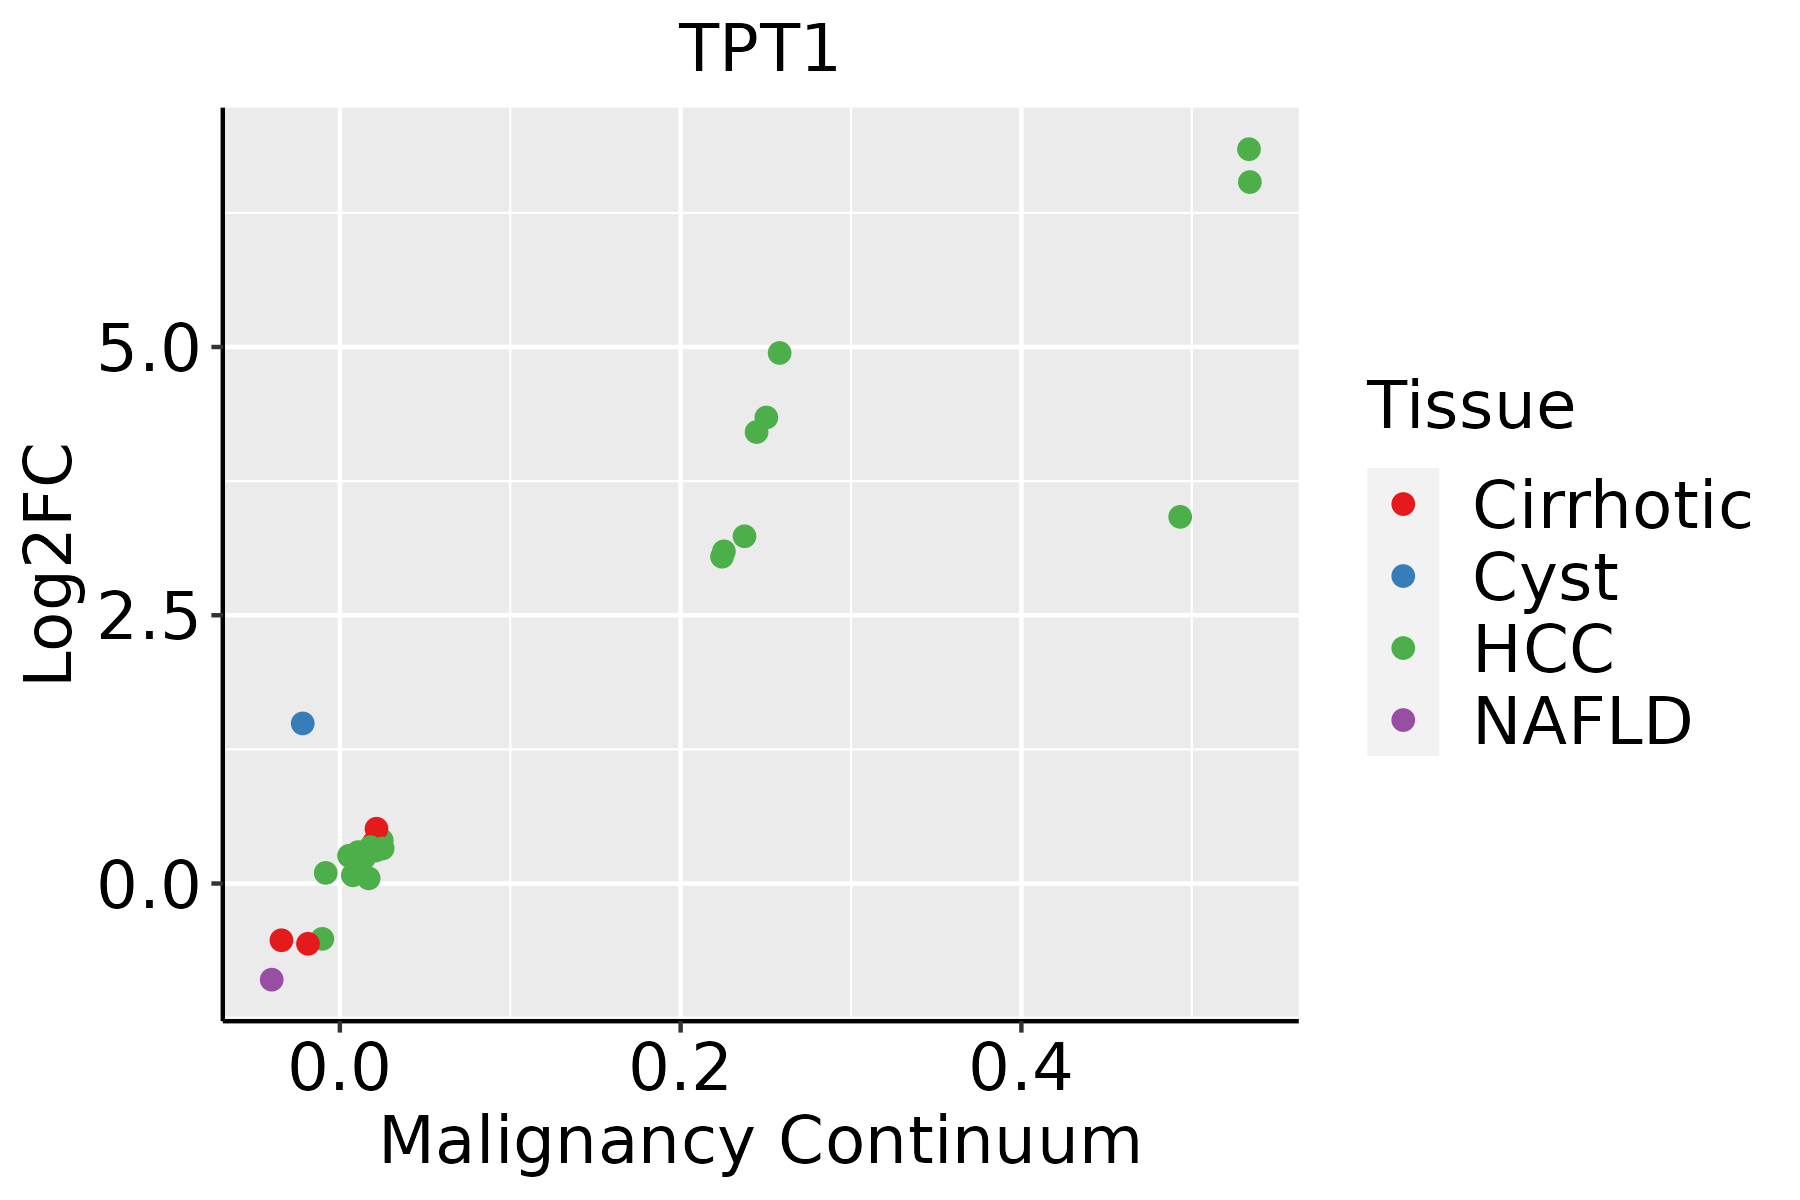 | HCC: Hepatocellular carcinoma |
| NAFLD: Non-alcoholic fatty liver disease |
| Lung | 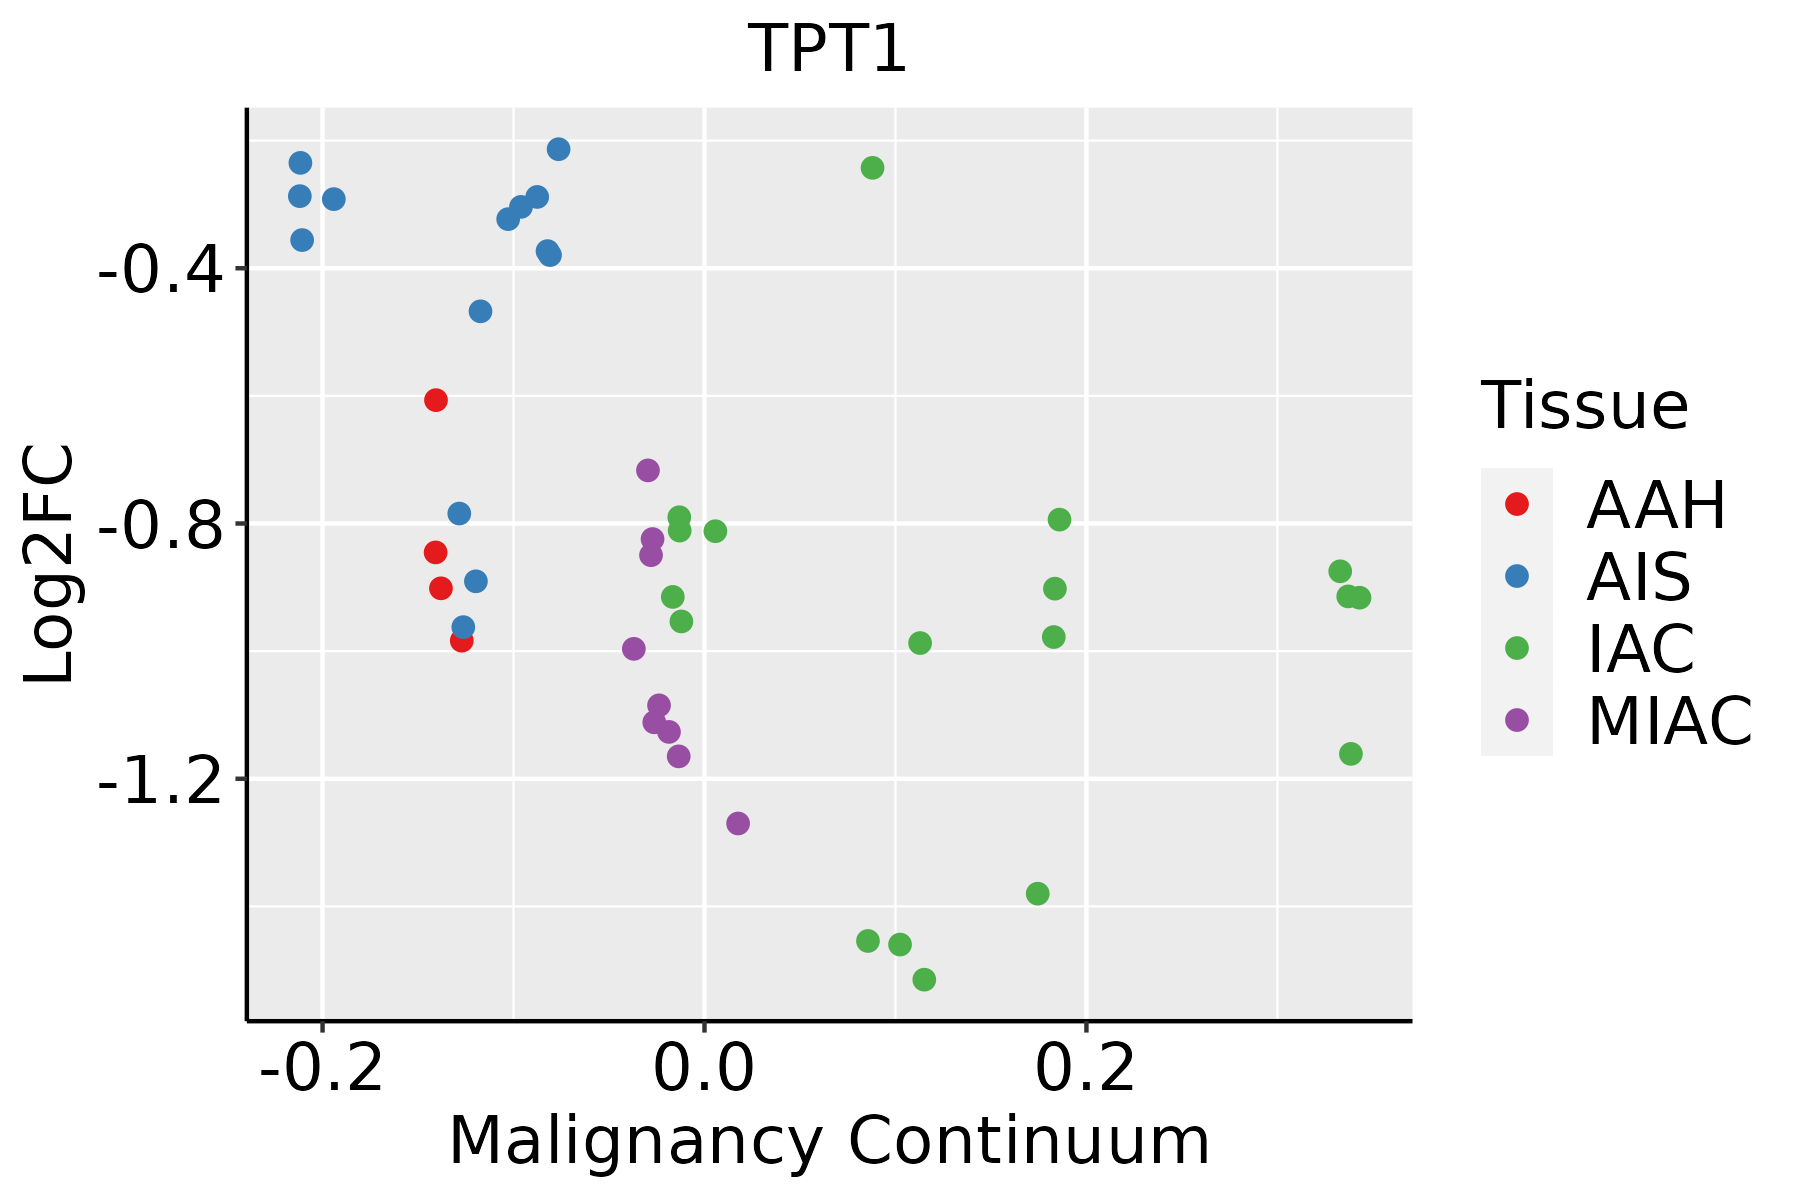 | AAH: Atypical adenomatous hyperplasia |
| AIS: Adenocarcinoma in situ |
| IAC: Invasive lung adenocarcinoma |
| MIA: Minimally invasive adenocarcinoma |
| Oral Cavity | 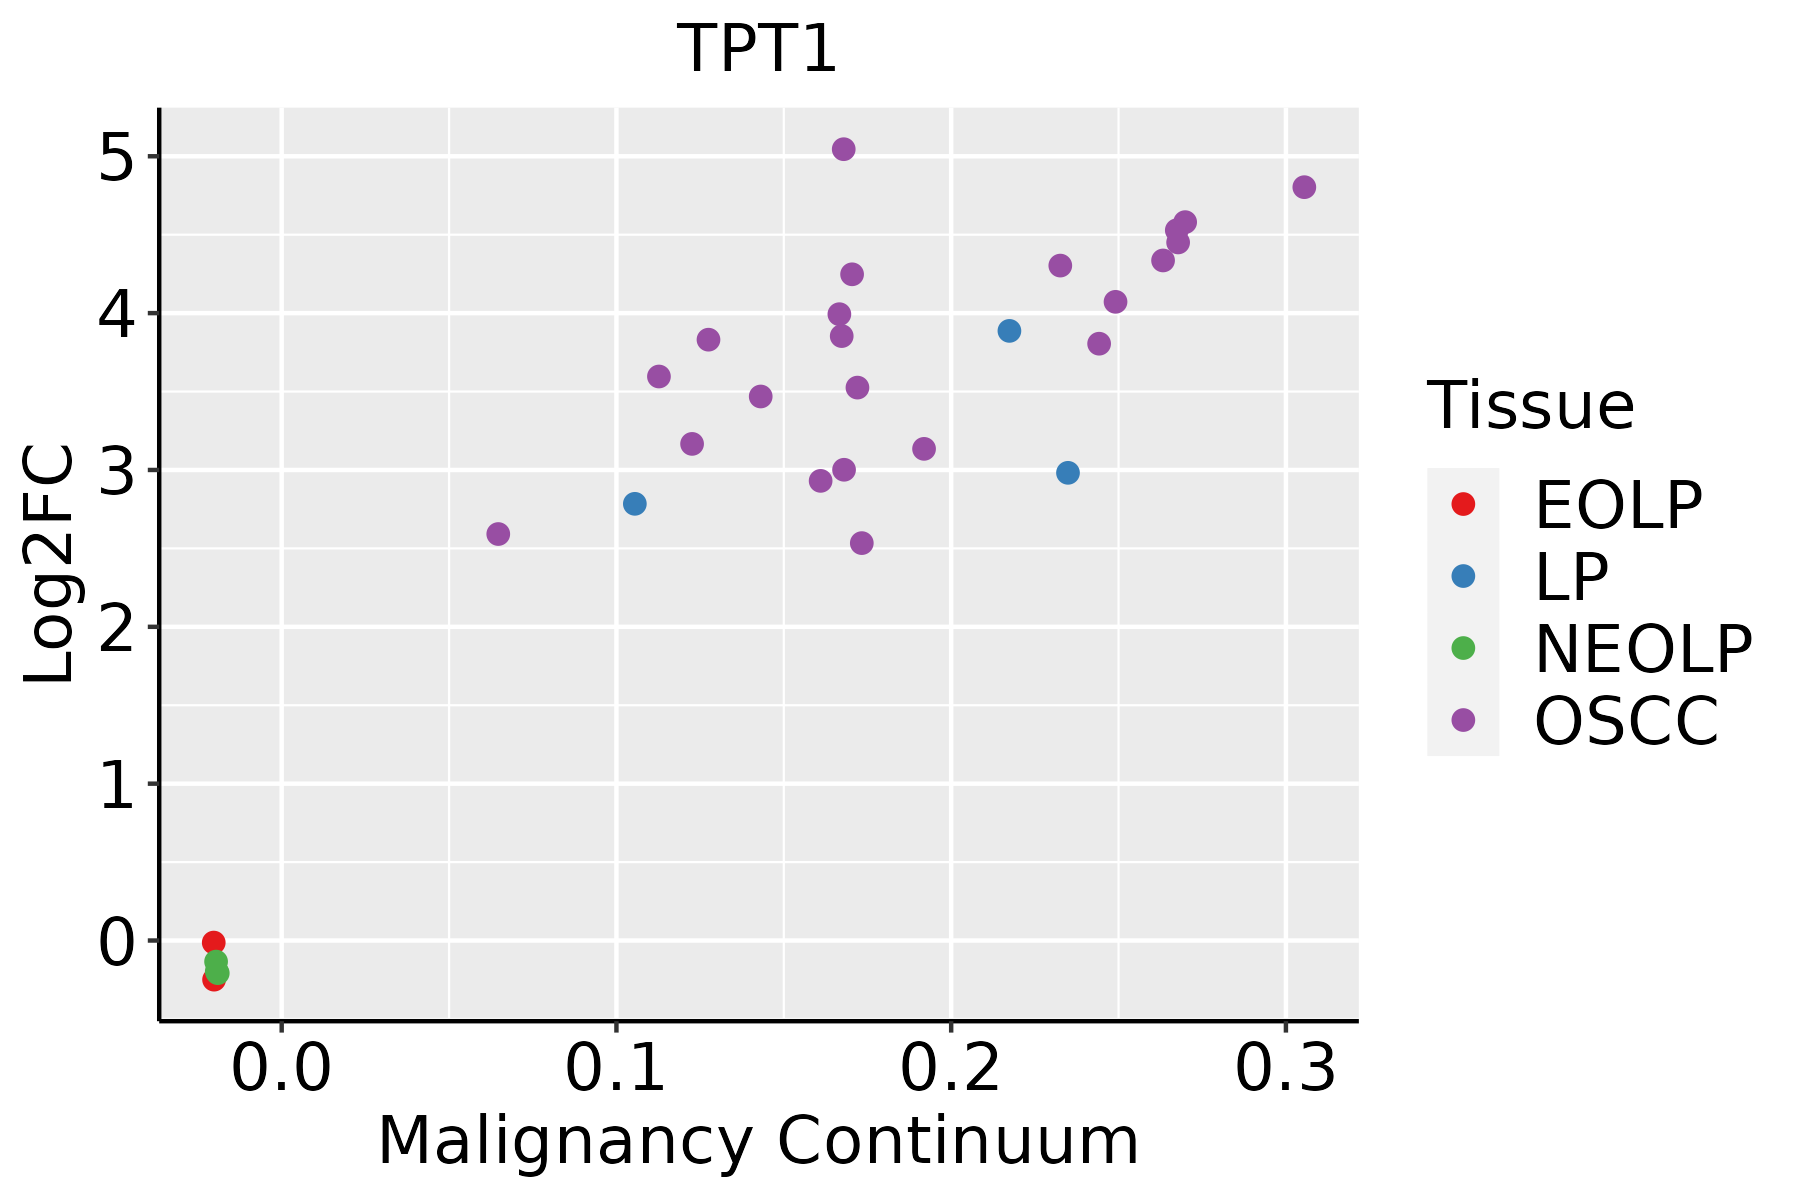 | EOLP: Erosive Oral lichen planus |
| LP: leukoplakia |
| NEOLP: Non-erosive oral lichen planus |
| OSCC: Oral squamous cell carcinoma |
| Prostate |  | BPH: Benign Prostatic Hyperplasia |
| Skin | 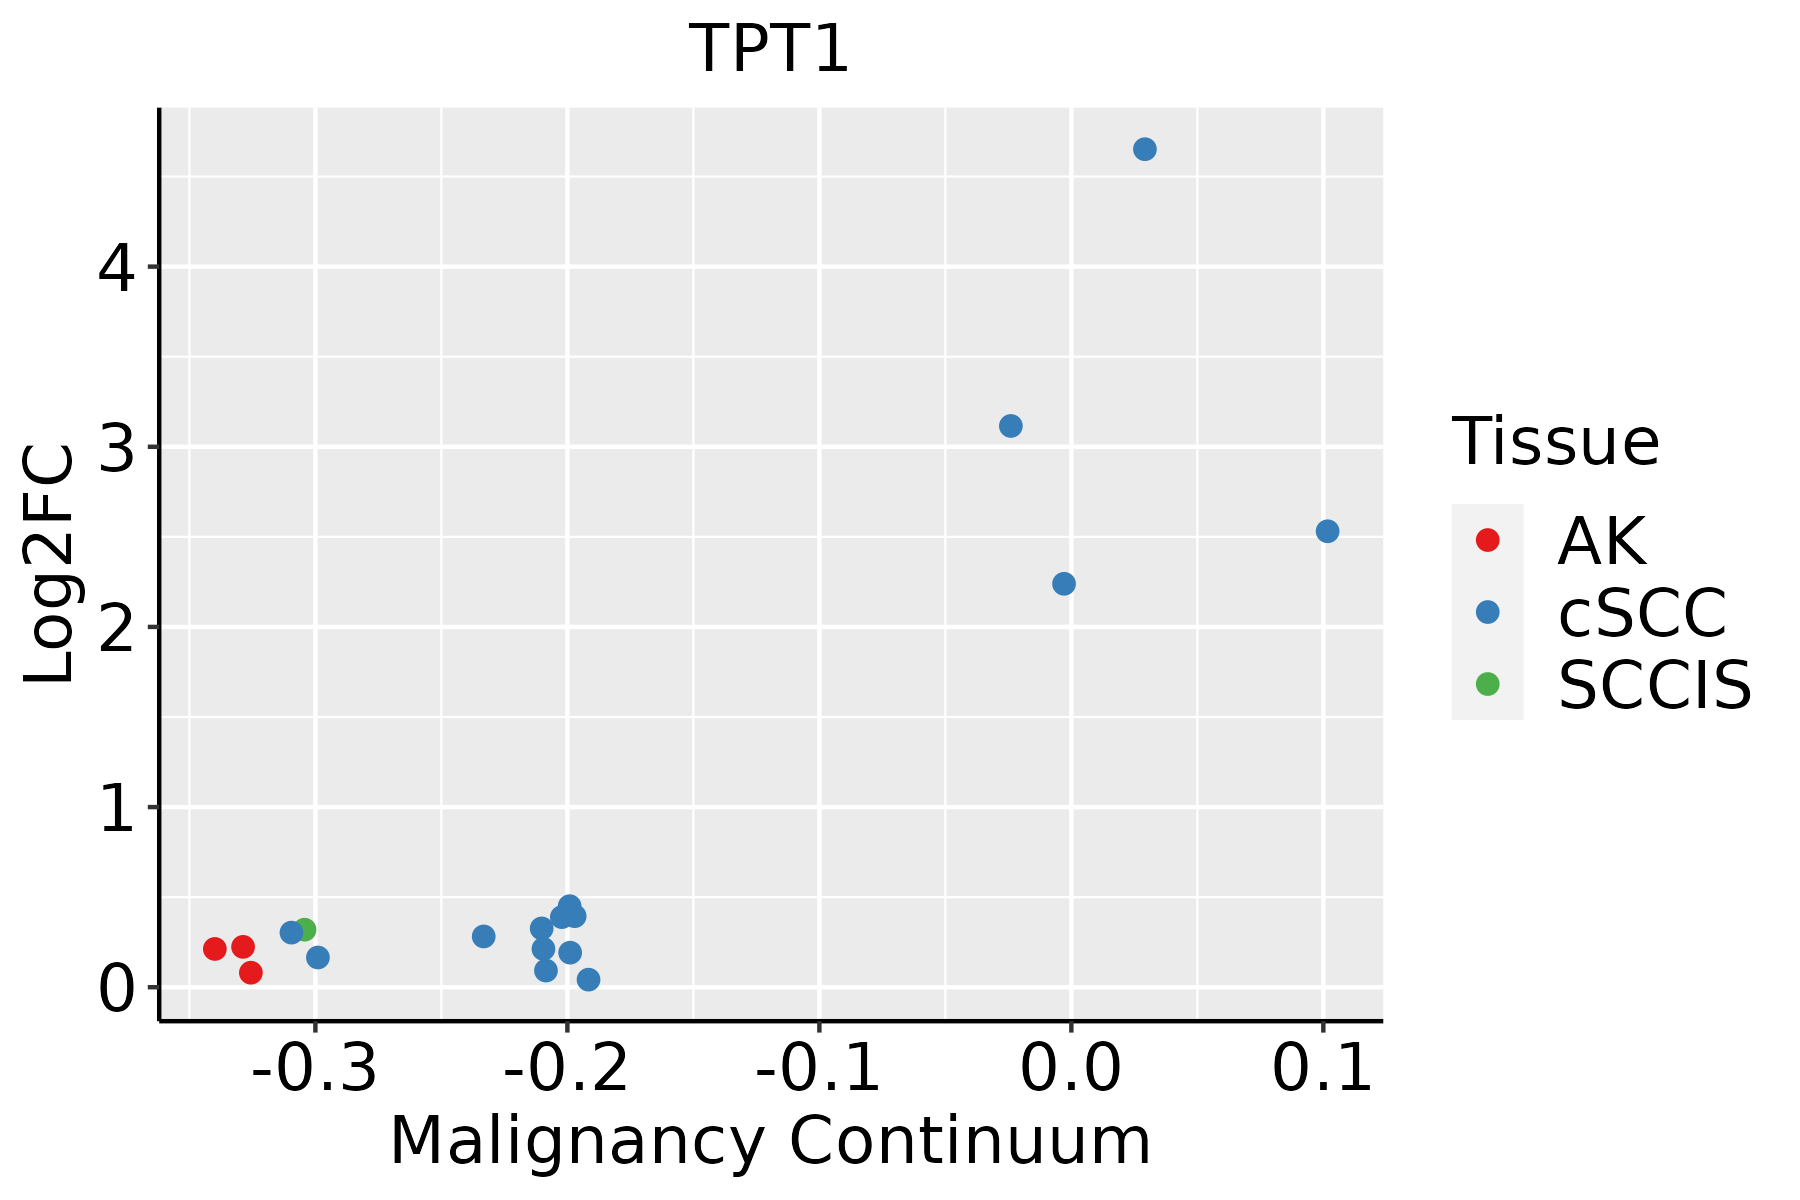 | AK: Actinic keratosis |
| cSCC: Cutaneous squamous cell carcinoma |
| SCCIS:squamous cell carcinoma in situ |
| Thyroid |  | ATC: Anaplastic thyroid cancer |
| HT: Hashimoto's thyroiditis |
| PTC: Papillary thyroid cancer |
| GO ID | Tissue | Disease Stage | Description | Gene Ratio | Bg Ratio | pvalue | p.adjust | Count |
| GO:00971939 | Breast | Precancer | intrinsic apoptotic signaling pathway | 59/1080 | 288/18723 | 8.07e-18 | 3.60e-15 | 59 |
| GO:20012339 | Breast | Precancer | regulation of apoptotic signaling pathway | 65/1080 | 356/18723 | 7.70e-17 | 3.17e-14 | 65 |
| GO:20012429 | Breast | Precancer | regulation of intrinsic apoptotic signaling pathway | 41/1080 | 164/18723 | 6.48e-16 | 2.31e-13 | 41 |
| GO:20012349 | Breast | Precancer | negative regulation of apoptotic signaling pathway | 39/1080 | 224/18723 | 5.35e-10 | 4.77e-08 | 39 |
| GO:20012439 | Breast | Precancer | negative regulation of intrinsic apoptotic signaling pathway | 23/1080 | 98/18723 | 5.82e-09 | 4.45e-07 | 23 |
| GO:00086308 | Breast | Precancer | intrinsic apoptotic signaling pathway in response to DNA damage | 16/1080 | 99/18723 | 1.65e-04 | 2.74e-03 | 16 |
| GO:19022293 | Breast | Precancer | regulation of intrinsic apoptotic signaling pathway in response to DNA damage | 8/1080 | 36/18723 | 8.49e-04 | 9.82e-03 | 8 |
| GO:20010208 | Breast | Precancer | regulation of response to DNA damage stimulus | 24/1080 | 219/18723 | 1.93e-03 | 1.87e-02 | 24 |
| GO:0072503 | Breast | Precancer | cellular divalent inorganic cation homeostasis | 42/1080 | 486/18723 | 5.91e-03 | 4.21e-02 | 42 |
| GO:200123314 | Breast | IDC | regulation of apoptotic signaling pathway | 82/1434 | 356/18723 | 6.27e-20 | 5.93e-17 | 82 |
| GO:009719314 | Breast | IDC | intrinsic apoptotic signaling pathway | 69/1434 | 288/18723 | 6.32e-18 | 2.99e-15 | 69 |
| GO:200124214 | Breast | IDC | regulation of intrinsic apoptotic signaling pathway | 47/1434 | 164/18723 | 8.25e-16 | 2.93e-13 | 47 |
| GO:200123414 | Breast | IDC | negative regulation of apoptotic signaling pathway | 49/1434 | 224/18723 | 1.45e-11 | 2.58e-09 | 49 |
| GO:200124314 | Breast | IDC | negative regulation of intrinsic apoptotic signaling pathway | 27/1434 | 98/18723 | 2.91e-09 | 2.50e-07 | 27 |
| GO:000863013 | Breast | IDC | intrinsic apoptotic signaling pathway in response to DNA damage | 21/1434 | 99/18723 | 1.57e-05 | 3.94e-04 | 21 |
| GO:00096157 | Breast | IDC | response to virus | 47/1434 | 367/18723 | 3.53e-04 | 5.16e-03 | 47 |
| GO:190222912 | Breast | IDC | regulation of intrinsic apoptotic signaling pathway in response to DNA damage | 9/1434 | 36/18723 | 1.25e-03 | 1.33e-02 | 9 |
| GO:200102013 | Breast | IDC | regulation of response to DNA damage stimulus | 30/1434 | 219/18723 | 1.36e-03 | 1.40e-02 | 30 |
| GO:200123324 | Breast | DCIS | regulation of apoptotic signaling pathway | 81/1390 | 356/18723 | 3.51e-20 | 3.31e-17 | 81 |
| GO:009719324 | Breast | DCIS | intrinsic apoptotic signaling pathway | 68/1390 | 288/18723 | 4.93e-18 | 2.33e-15 | 68 |
| Hugo Symbol | Variant Class | Variant Classification | dbSNP RS | HGVSc | HGVSp | HGVSp Short | SWISSPROT | BIOTYPE | SIFT | PolyPhen | Tumor Sample Barcode | Tissue | Histology | Sex | Age | Stage | Therapy Types | Drugs | Outcome |
| TPT1 | SNV | Missense_Mutation | novel | c.320N>C | p.Arg107Thr | p.R107T | | protein_coding | tolerated(0.09) | benign(0.418) | TCGA-AC-A3W5-01 | Breast | breast invasive carcinoma | Female | >=65 | I/II | Chemotherapy | docetaxel | CR |
| TPT1 | deletion | Frame_Shift_Del | | c.513delA | p.Lys171AsnfsTer21 | p.K171Nfs*21 | | protein_coding | | | TCGA-AA-3710-01 | Colorectum | colon adenocarcinoma | Female | >=65 | I/II | Unknown | Unknown | SD |
| TPT1 | insertion | Frame_Shift_Ins | novel | c.513dupA | p.Cys172MetfsTer2 | p.C172Mfs*2 | | protein_coding | | | TCGA-AA-3864-01 | Colorectum | colon adenocarcinoma | Male | >=65 | I/II | Unknown | Unknown | SD |
| TPT1 | SNV | Missense_Mutation | novel | c.548N>A | p.Cys183Tyr | p.C183Y | | protein_coding | deleterious_low_confidence(0.03) | benign(0.003) | TCGA-AP-A05P-01 | Endometrium | uterine corpus endometrioid carcinoma | Female | <65 | I/II | Unknown | Unknown | SD |
| TPT1 | SNV | Missense_Mutation | novel | c.481N>T | p.Ile161Phe | p.I161F | | protein_coding | deleterious(0) | benign(0.387) | TCGA-AX-A1CE-01 | Endometrium | uterine corpus endometrioid carcinoma | Female | <65 | I/II | Unspecific | Paclitaxel | SD |
| TPT1 | SNV | Missense_Mutation | rs771758941 | c.562N>T | p.Arg188Trp | p.R188W | | protein_coding | deleterious_low_confidence(0.03) | benign(0.067) | TCGA-AX-A2HC-01 | Endometrium | uterine corpus endometrioid carcinoma | Female | <65 | III/IV | Chemotherapy | paclitaxel | PD |
| TPT1 | SNV | Missense_Mutation | | c.110N>T | p.Ser37Ile | p.S37I | | protein_coding | deleterious(0.03) | benign(0.217) | TCGA-BG-A0VV-01 | Endometrium | uterine corpus endometrioid carcinoma | Female | <65 | I/II | Unknown | Unknown | SD |
| TPT1 | SNV | Missense_Mutation | novel | c.29N>T | p.His10Leu | p.H10L | | protein_coding | tolerated(0.14) | benign(0.007) | TCGA-ZP-A9D0-01 | Liver | liver hepatocellular carcinoma | Female | >=65 | I/II | Unknown | Unknown | SD |
| TPT1 | SNV | Missense_Mutation | novel | c.322N>T | p.Pro108Ser | p.P108S | | protein_coding | tolerated(0.06) | benign(0.171) | TCGA-XK-AAIW-01 | Prostate | prostate adenocarcinoma | Male | >=65 | 9 | Unknown | Unknown | PD |
| TPT1 | SNV | Missense_Mutation | novel | c.529A>G | p.Arg177Gly | p.R177G | | protein_coding | deleterious_low_confidence(0.01) | benign(0.007) | TCGA-BR-4257-01 | Stomach | stomach adenocarcinoma | Female | >=65 | I/II | Unknown | Unknown | SD |


