Schematic overview of the cellular and molecular mechanisms involved in the cancer progression, including the proposed cellular and molecular mechanisms in cancer cells trajectory. AT1: alveolar type 1 cells; AT2: alveolar type 2 cells; AAH: atypical adenomatous hyperplasia; AIS: adenocarcinoma in situ; MIA: minimally invasive adenocarcinoma; IA: invasive adenocarcinoma; EMT: epithelial-mesenchymal transition

Home

Download

Statistics

Help

Contact

Center for Computational Systems Medicine
leaf

Gene summary

leaf

Malignant transformation analysis

leaf

Malignant transformation related pathway analysis

leaf

Cell-cell communication analysis

leaf

Single-cell gene regulatory network inference analysis

leaf

Somatic mutation of malignant transformation related genes

leaf

Related drugs of malignant transformation related genes

Gene: TPST2

Gene summary for TPST2

check button Gene summary.

Gene informationSpeciesHuman
Gene symbol

TPST2

Gene ID

8459

Gene nametyrosylprotein sulfotransferase 2
Gene AliasTANGO13B
Cytomap22q12.1
Gene Typeprotein-coding
GO ID

GO:0006082

UniProtAcc

A0A024R1G9


Top

Malignant transformation analysis

check button Identification of the aberrant gene expression in precancerous and cancerous lesions by comparing the gene expression of stem-like cells in diseased tissues with normal stem cells
check button Malignant transformation involving gene list.
Entrez IDSymbolReplicatesSpeciesOrganTissueAdj P-valueLog2FCMalignancy
8459TPST2HTA11_78_2000001011HumanColorectumAD1.40e-032.56e-01-0.1088
8459TPST2HTA11_347_2000001011HumanColorectumAD3.71e-114.10e-01-0.1954
8459TPST2HTA11_1391_2000001011HumanColorectumAD5.68e-063.56e-01-0.059
8459TPST2HTA11_546_2000001011HumanColorectumAD1.33e-023.06e-01-0.0842
8459TPST2HTA11_99999965104_69814HumanColorectumMSS1.43e-371.59e+000.281
8459TPST2HTA11_99999971662_82457HumanColorectumMSS1.52e-104.94e-010.3859
8459TPST2A002-C-116HumanColorectumFAP4.03e-02-4.62e-02-0.0452
8459TPST2LZE4THumanEsophagusESCC5.49e-052.65e-010.0811
8459TPST2LZE7THumanEsophagusESCC1.54e-072.05e-010.0667
8459TPST2LZE8THumanEsophagusESCC2.50e-094.19e-010.067
8459TPST2LZE22THumanEsophagusESCC3.85e-021.72e-010.068
8459TPST2LZE24THumanEsophagusESCC4.65e-153.88e-010.0596
8459TPST2LZE21THumanEsophagusESCC5.28e-073.29e-010.0655
8459TPST2LZE6THumanEsophagusESCC6.25e-073.45e-010.0845
8459TPST2P1T-EHumanEsophagusESCC9.05e-064.91e-010.0875
8459TPST2P2T-EHumanEsophagusESCC7.08e-237.22e-010.1177
8459TPST2P4T-EHumanEsophagusESCC6.56e-124.55e-010.1323
8459TPST2P5T-EHumanEsophagusESCC6.33e-142.46e-010.1327
8459TPST2P8T-EHumanEsophagusESCC1.10e-162.99e-010.0889
8459TPST2P9T-EHumanEsophagusESCC1.72e-124.00e-010.1131
Page: 1 2 3 4 5 6 7 

check button Transcriptomic changes along malignancy continuum.
TissueExpression DynamicsAbbreviation
Colorectum (GSE201348)The image shows the transcriptomic changes along malignancy continuum.log2FC in expression of this searched gene in stem-like cells from each diseased tissue sample relative to stem-like cells in normal samples in each tissue plotted against the malignancy continuum. Samples are colored based on if they are from different disease stage.
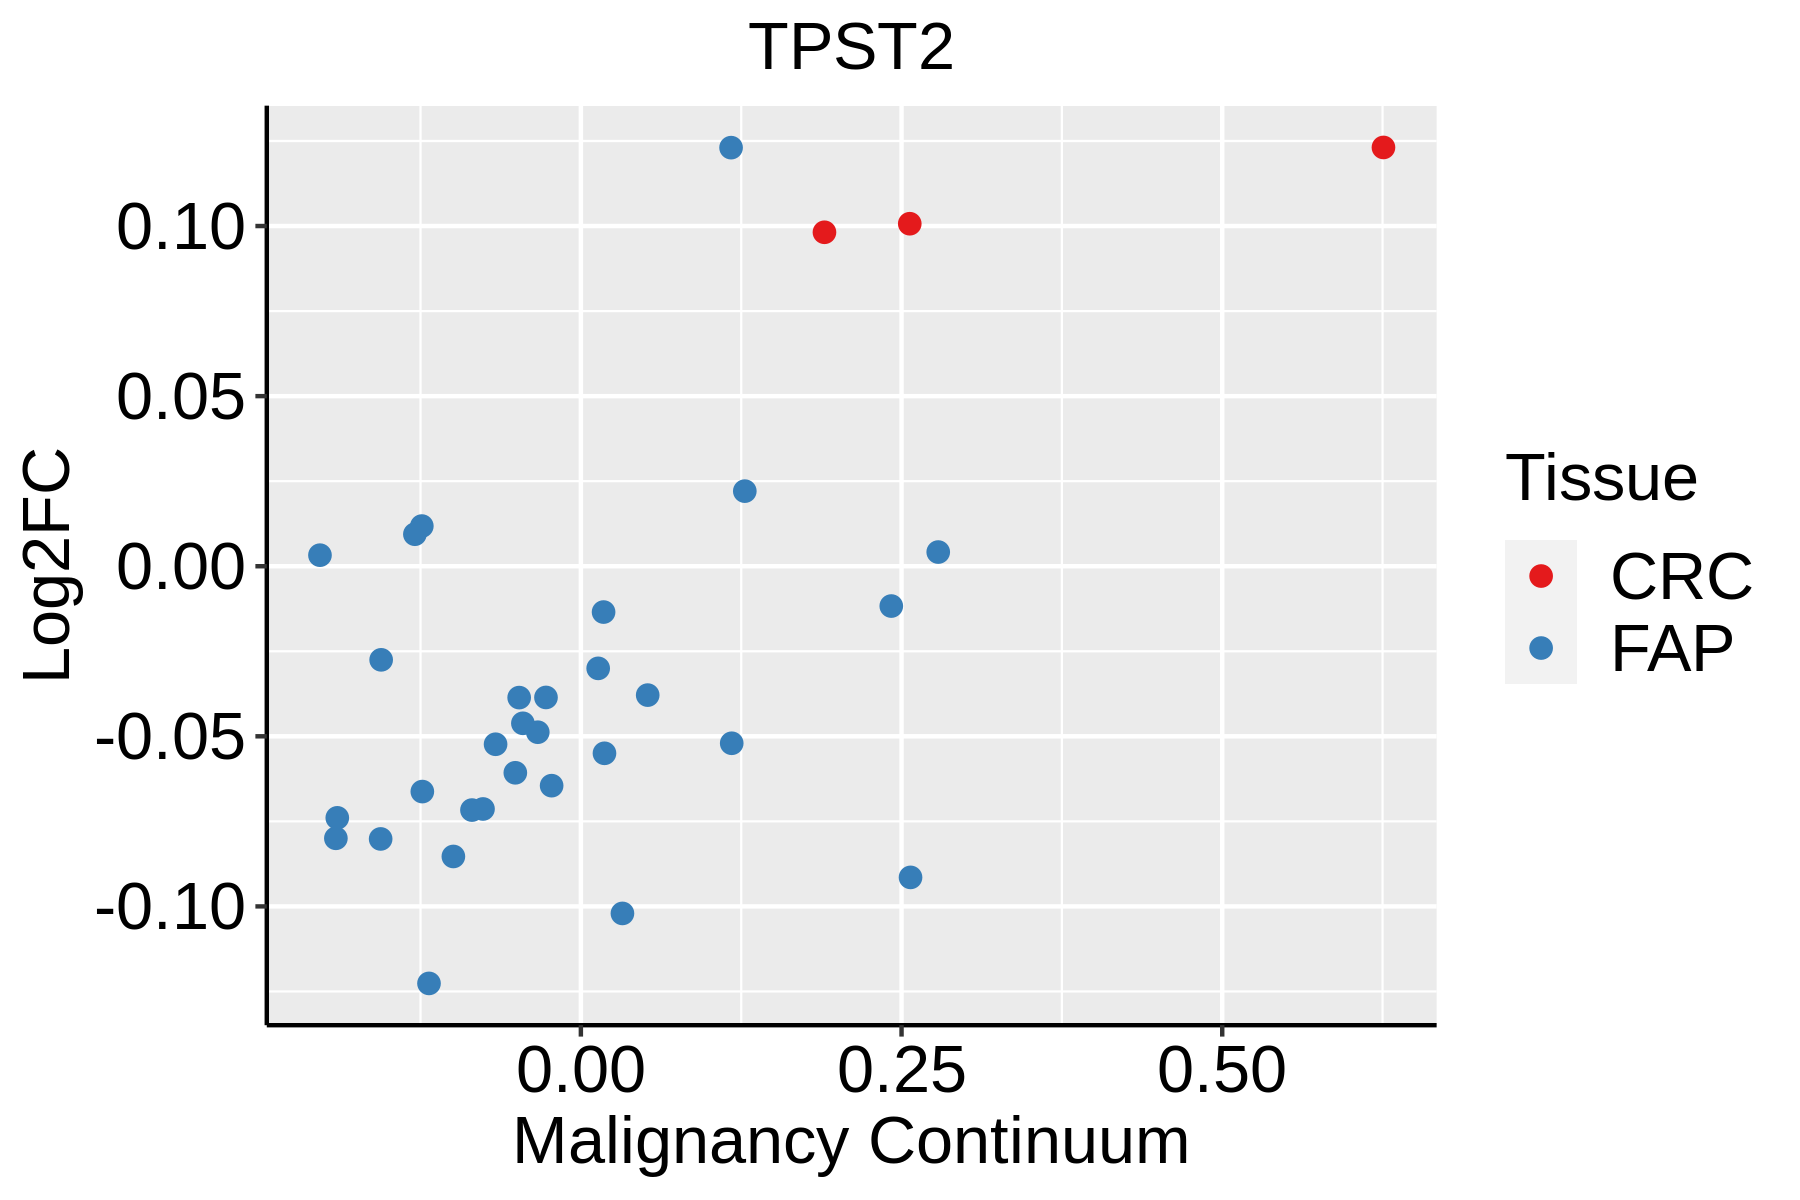
FAP: Familial adenomatous polyposis
CRC: Colorectal cancer
Colorectum (HTA11)The image shows the transcriptomic changes along malignancy continuum.log2FC in expression of this searched gene in stem-like cells from each diseased tissue sample relative to stem-like cells in normal samples in each tissue plotted against the malignancy continuum. Samples are colored based on if they are from different disease stage.AD: Adenomas
SER: Sessile serrated lesions
MSI-H: Microsatellite-high colorectal cancer
MSS: Microsatellite stable colorectal cancer
EsophagusThe image shows the transcriptomic changes along malignancy continuum.log2FC in expression of this searched gene in stem-like cells from each diseased tissue sample relative to stem-like cells in normal samples in each tissue plotted against the malignancy continuum. Samples are colored based on if they are from different disease stage.
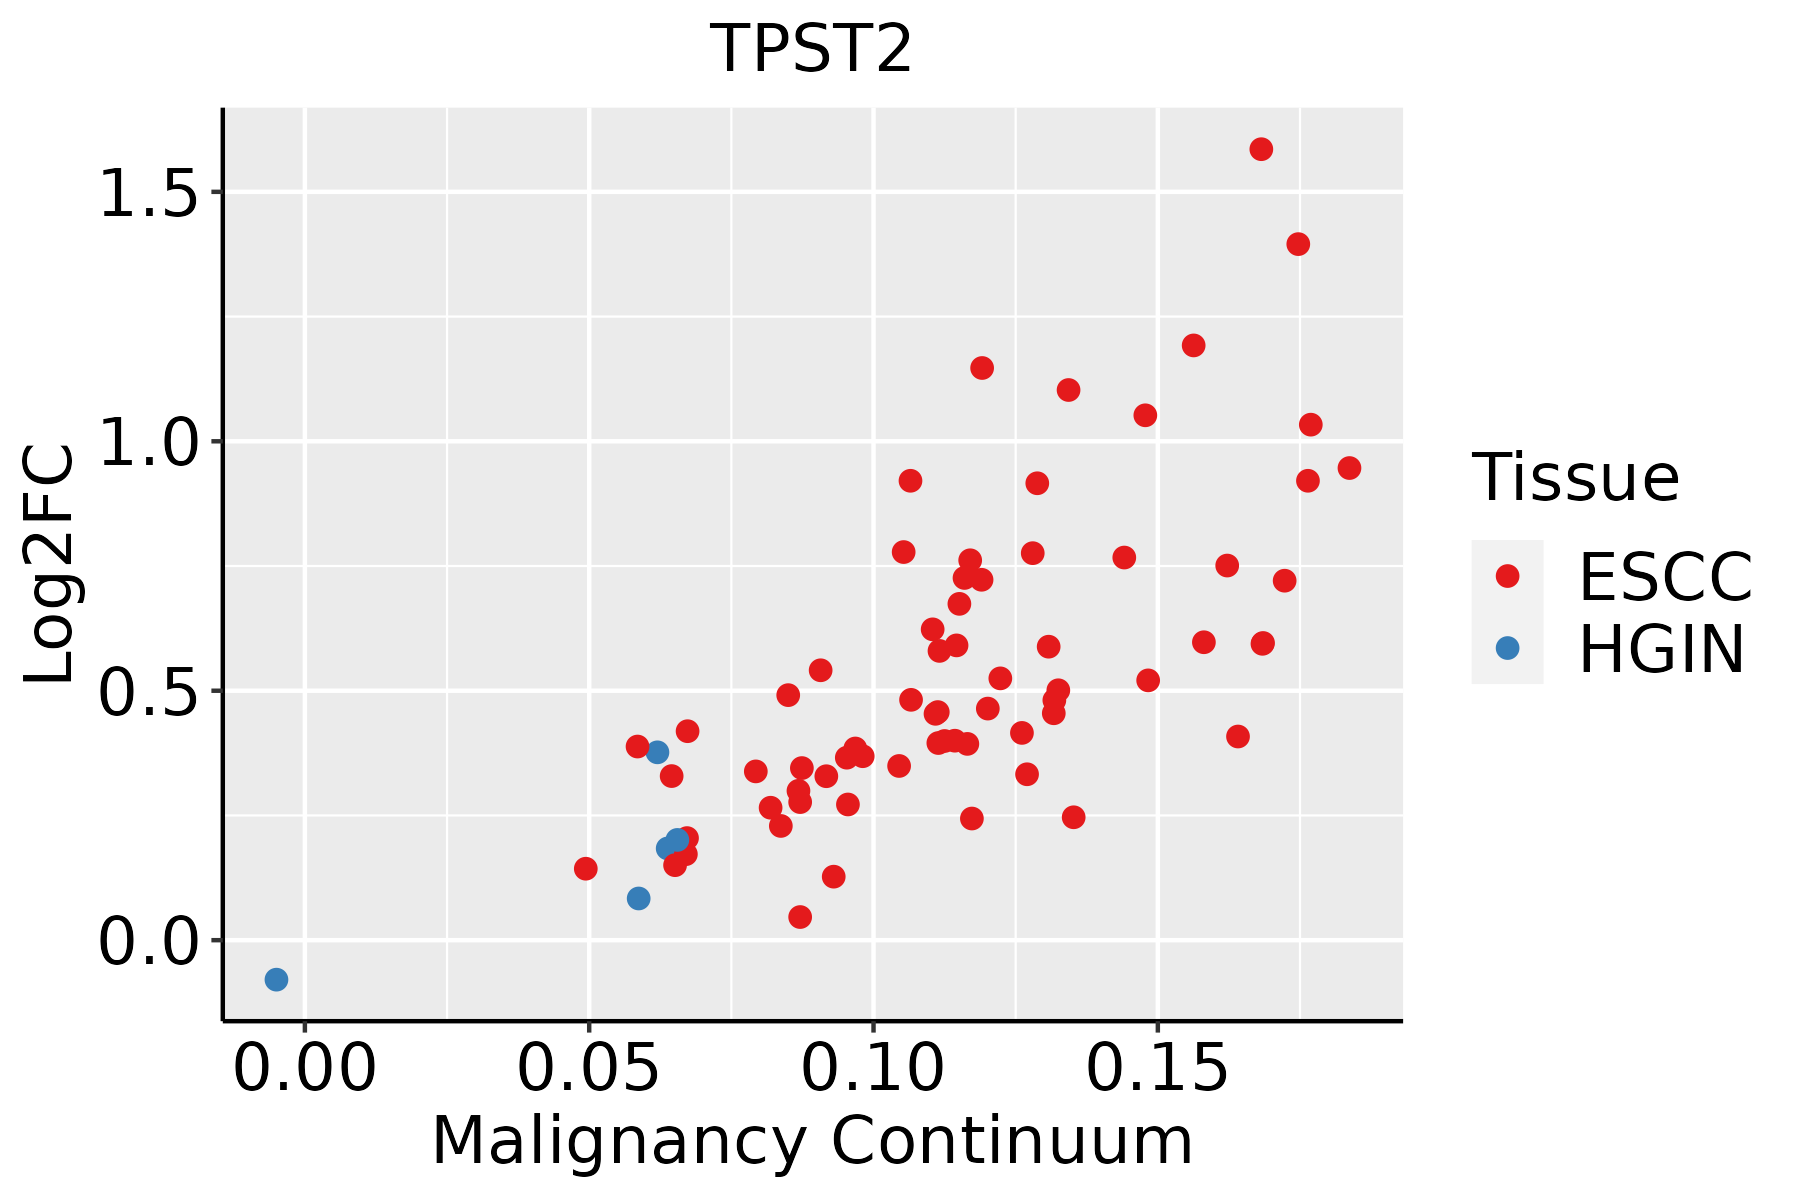
ESCC: Esophageal squamous cell carcinoma
HGIN: High-grade intraepithelial neoplasias
LGIN: Low-grade intraepithelial neoplasias
LiverThe image shows the transcriptomic changes along malignancy continuum.log2FC in expression of this searched gene in stem-like cells from each diseased tissue sample relative to stem-like cells in normal samples in each tissue plotted against the malignancy continuum. Samples are colored based on if they are from different disease stage.HCC: Hepatocellular carcinoma
NAFLD: Non-alcoholic fatty liver disease
Oral CavityThe image shows the transcriptomic changes along malignancy continuum.log2FC in expression of this searched gene in stem-like cells from each diseased tissue sample relative to stem-like cells in normal samples in each tissue plotted against the malignancy continuum. Samples are colored based on if they are from different disease stage.EOLP: Erosive Oral lichen planus
LP: leukoplakia
NEOLP: Non-erosive oral lichen planus
OSCC: Oral squamous cell carcinoma
SkinThe image shows the transcriptomic changes along malignancy continuum.log2FC in expression of this searched gene in stem-like cells from each diseased tissue sample relative to stem-like cells in normal samples in each tissue plotted against the malignancy continuum. Samples are colored based on if they are from different disease stage.AK: Actinic keratosis
cSCC: Cutaneous squamous cell carcinoma
SCCIS:squamous cell carcinoma in situ
ThyroidThe image shows the transcriptomic changes along malignancy continuum.log2FC in expression of this searched gene in stem-like cells from each diseased tissue sample relative to stem-like cells in normal samples in each tissue plotted against the malignancy continuum. Samples are colored based on if they are from different disease stage.ATC: Anaplastic thyroid cancer
HT: Hashimoto's thyroiditis
PTC: Papillary thyroid cancer
∗log2FC in expression of this searched gene in stem-like cells from each diseased tissue sample relative to stem-like cells in normal samples in each tissue plotted against the malignancy continuum. Samples are colored based on if they are from different disease stage.

Top

Malignant transformation related pathway analysis

check buttonFind out the enriched GO biological processes and KEGG pathways involved in transition from healthy to precancer to cancer
check button Figure of enriched GO biological processes.
TissueDisease StageEnriched GO biological Processes
ColorectumADGO analysis - Figure of enriched GO biological processes: Top 15 enriched GO BP terms are showed in the bar plot of each disease state in each tissue. Each row represents a significant GO biological process which is colored according to the -log10(p.adjust).
ColorectumSERGO analysis - Figure of enriched GO biological processes: Top 15 enriched GO BP terms are showed in the bar plot of each disease state in each tissue. Each row represents a significant GO biological process which is colored according to the -log10(p.adjust).
ColorectumMSSGO analysis - Figure of enriched GO biological processes: Top 15 enriched GO BP terms are showed in the bar plot of each disease state in each tissue. Each row represents a significant GO biological process which is colored according to the -log10(p.adjust).
ColorectumMSI-HGO analysis - Figure of enriched GO biological processes: Top 15 enriched GO BP terms are showed in the bar plot of each disease state in each tissue. Each row represents a significant GO biological process which is colored according to the -log10(p.adjust).
ColorectumFAPGO analysis - Figure of enriched GO biological processes: Top 15 enriched GO BP terms are showed in the bar plot of each disease state in each tissue. Each row represents a significant GO biological process which is colored according to the -log10(p.adjust).
∗Top 15 enriched GO BP terms are showed in the bar plot of each disease state in each tissue. Each row represents a significant GO biological process which is colored according to the -log10(p.adjust).
Page: 1 2 3 4 5 6 7 8 9 

check button Enriched GO biological processes.
GO IDTissueDisease StageDescriptionGene RatioBg Ratiopvaluep.adjustCount
GO:0009150ColorectumADpurine ribonucleotide metabolic process142/3918368/187234.29e-151.17e-12142
GO:0006163ColorectumADpurine nucleotide metabolic process149/3918396/187231.08e-142.80e-12149
GO:0072521ColorectumADpurine-containing compound metabolic process153/3918416/187234.34e-141.01e-11153
GO:0009259ColorectumADribonucleotide metabolic process144/3918385/187235.25e-141.13e-11144
GO:0019693ColorectumADribose phosphate metabolic process145/3918396/187233.01e-135.71e-11145
GO:0009117ColorectumADnucleotide metabolic process168/3918489/187232.20e-123.36e-10168
GO:0006753ColorectumADnucleoside phosphate metabolic process169/3918497/187234.99e-126.98e-10169
GO:0006790ColorectumADsulfur compound metabolic process101/3918339/187236.46e-051.07e-03101
GO:0033865ColorectumADnucleoside bisphosphate metabolic process42/3918128/187231.12e-031.02e-0242
GO:0033875ColorectumADribonucleoside bisphosphate metabolic process42/3918128/187231.12e-031.02e-0242
GO:0034032ColorectumADpurine nucleoside bisphosphate metabolic process42/3918128/187231.12e-031.02e-0242
GO:0034035ColorectumADpurine ribonucleoside bisphosphate metabolic process11/391821/187231.43e-031.22e-0211
GO:0050427ColorectumAD3'-phosphoadenosine 5'-phosphosulfate metabolic process11/391821/187231.43e-031.22e-0211
GO:00061632ColorectumMSSpurine nucleotide metabolic process128/3467396/187232.04e-113.02e-09128
GO:00091502ColorectumMSSpurine ribonucleotide metabolic process121/3467368/187232.08e-113.02e-09121
GO:00725212ColorectumMSSpurine-containing compound metabolic process132/3467416/187234.13e-114.86e-09132
GO:00092592ColorectumMSSribonucleotide metabolic process123/3467385/187231.17e-101.20e-08123
GO:00196932ColorectumMSSribose phosphate metabolic process124/3467396/187234.11e-103.49e-08124
GO:00091172ColorectumMSSnucleotide metabolic process144/3467489/187231.87e-091.35e-07144
GO:00067532ColorectumMSSnucleoside phosphate metabolic process145/3467497/187233.25e-092.23e-07145
Page: 1 2 3 4 5 6 

check button Enriched KEGG pathways.
Pathway IDTissueDisease StageDescriptionGene RatioBg Ratiopvaluep.adjustqvalueCount
Page: 1 

Top

Cell-cell communication analysis

check buttonIdentification of potential cell-cell interactions between two cell types and their ligand-receptor pairs for different disease states
LigandReceptorLRpairPathwayTissueDisease Stage
Page: 1 

Top

Single-cell gene regulatory network inference analysis

check buttonFind out the significant the regulons (TFs) and the target genes of each regulon across cell types for different disease states
TFCell TypeTissueDisease StageTarget GeneRSSRegulon Activity
∗The dot plots of a searched regulon are shown for all cell subpopulations in each disease state of each tissue based on the regulon specific score inferred using pySCENIC and by calculating the average expression.
Page: 1 

Top

Somatic mutation of malignant transformation related genes

check buttonAnnotation of somatic variants for genes involved in malignant transformation
Hugo SymbolVariant ClassVariant ClassificationdbSNP RSHGVScHGVSpHGVSp ShortSWISSPROTBIOTYPESIFTPolyPhenTumor Sample BarcodeTissueHistologySexAgeStageTherapy TypesDrugsOutcome
TPST2insertionFrame_Shift_Insrs756080117c.996_997insCp.Asn333GlnfsTer6p.N333Qfs*6O60704protein_codingTCGA-A8-A09Z-01Breastbreast invasive carcinomaFemale>=65I/IIUnknownUnknownSD
TPST2insertionFrame_Shift_Insnovelc.996_997insCCp.Asn333ProfsTer18p.N333Pfs*18O60704protein_codingTCGA-BH-A18G-01Breastbreast invasive carcinomaFemale>=65I/IIUnknownUnknownSD
TPST2SNVMissense_Mutationnovelc.949N>Ap.Ala317Thrp.A317TO60704protein_codingdeleterious(0.02)benign(0.421)TCGA-2W-A8YY-01Cervixcervical & endocervical cancerFemale<65I/IIChemotherapycisplatinCR
TPST2SNVMissense_Mutationnovelc.655N>Ap.Glu219Lysp.E219KO60704protein_codingtolerated(0.14)benign(0.094)TCGA-2W-A8YY-01Cervixcervical & endocervical cancerFemale<65I/IIChemotherapycisplatinCR
TPST2SNVMissense_Mutationrs770653345c.485N>Tp.Thr162Metp.T162MO60704protein_codingdeleterious(0)probably_damaging(0.997)TCGA-EA-A3HS-01Cervixcervical & endocervical cancerFemale<65I/IIUnknownUnknownSD
TPST2SNVMissense_Mutationnovelc.499N>Tp.Val167Phep.V167FO60704protein_codingdeleterious(0.03)possibly_damaging(0.672)TCGA-LP-A4AW-01Cervixcervical & endocervical cancerFemale<65I/IIUnknownUnknownSD
TPST2SNVMissense_Mutationc.839C>Tp.Ser280Phep.S280FO60704protein_codingdeleterious(0)probably_damaging(0.997)TCGA-MY-A5BD-01Cervixcervical & endocervical cancerFemale<65I/IIChemotherapycisplatinCR
TPST2SNVMissense_Mutationc.391N>Ap.Glu131Lysp.E131KO60704protein_codingtolerated(0.15)benign(0.024)TCGA-Q1-A73O-01Cervixcervical & endocervical cancerFemale<65I/IIChemotherapycisplatinCR
TPST2SNVMissense_Mutationnovelc.281N>Cp.Val94Alap.V94AO60704protein_codingdeleterious(0)probably_damaging(0.991)TCGA-VS-A9U6-01Cervixcervical & endocervical cancerFemale<65I/IIChemotherapycisplatinPD
TPST2SNVMissense_Mutationnovelc.949N>Ap.Ala317Thrp.A317TO60704protein_codingdeleterious(0.02)benign(0.421)TCGA-AA-3663-01Colorectumcolon adenocarcinomaMale<65I/IIUnknownUnknownSD
Page: 1 2 3 4 5 

Top

Related drugs of malignant transformation related genes

check buttonIdentification of chemicals and drugs interact with genes involved in malignant transfromation
(DGIdb 4.0)
Entrez IDSymbolCategoryInteraction TypesDrug Claim NameDrug NamePMIDs
Page: 1