
|
|||||
|
 | |
| |
| |
| |
| |
| |
|
Gene: TPSB2 |
Gene summary for TPSB2 |
| Gene information | Species | Human | Gene symbol | TPSB2 | Gene ID | 64499 |
| Gene name | tryptase beta 2 | |
| Gene Alias | TPS2 | |
| Cytomap | 16p13.3 | |
| Gene Type | protein-coding | GO ID | GO:0006508 | UniProtAcc | A0A140VJT7 |
Top |
Malignant transformation analysis |
| Identification of the aberrant gene expression in precancerous and cancerous lesions by comparing the gene expression of stem-like cells in diseased tissues with normal stem cells |
| Entrez ID | Symbol | Replicates | Species | Organ | Tissue | Adj P-value | Log2FC | Malignancy |
| 64499 | TPSB2 | CA_HPV_1 | Human | Cervix | CC | 7.73e-27 | -1.17e+00 | 0.0264 |
| 64499 | TPSB2 | CA_HPV_3 | Human | Cervix | CC | 8.83e-09 | -7.90e-01 | 0.0414 |
| 64499 | TPSB2 | N_HPV_2 | Human | Cervix | N_HPV | 5.14e-11 | -9.43e-01 | -0.0131 |
| 64499 | TPSB2 | CCI_1 | Human | Cervix | CC | 1.31e-07 | -1.48e+00 | 0.528 |
| 64499 | TPSB2 | CCI_2 | Human | Cervix | CC | 6.57e-07 | -1.48e+00 | 0.5249 |
| 64499 | TPSB2 | CCI_3 | Human | Cervix | CC | 2.01e-10 | -1.48e+00 | 0.516 |
| 64499 | TPSB2 | CCII_1 | Human | Cervix | CC | 2.38e-13 | -1.47e+00 | 0.3249 |
| 64499 | TPSB2 | Tumor | Human | Cervix | CC | 3.08e-35 | -1.48e+00 | 0.1241 |
| 64499 | TPSB2 | sample1 | Human | Cervix | CC | 3.35e-12 | -1.48e+00 | 0.0959 |
| 64499 | TPSB2 | sample3 | Human | Cervix | CC | 3.49e-34 | -1.48e+00 | 0.1387 |
| 64499 | TPSB2 | H2 | Human | Cervix | HSIL_HPV | 4.52e-37 | -1.29e+00 | 0.0632 |
| 64499 | TPSB2 | L1 | Human | Cervix | CC | 3.13e-16 | -1.48e+00 | 0.0802 |
| 64499 | TPSB2 | T1 | Human | Cervix | CC | 1.20e-25 | -1.48e+00 | 0.0918 |
| 64499 | TPSB2 | T2 | Human | Cervix | CC | 8.21e-05 | -1.44e+00 | 0.0709 |
| 64499 | TPSB2 | T3 | Human | Cervix | CC | 4.67e-35 | -1.48e+00 | 0.1389 |
| 64499 | TPSB2 | C21 | Human | Oral cavity | OSCC | 6.05e-05 | -7.42e-02 | 0.2678 |
| 64499 | TPSB2 | C30 | Human | Oral cavity | OSCC | 2.98e-04 | -2.87e-02 | 0.3055 |
| 64499 | TPSB2 | C43 | Human | Oral cavity | OSCC | 4.37e-02 | -2.18e-01 | 0.1704 |
| 64499 | TPSB2 | C57 | Human | Oral cavity | OSCC | 4.25e-04 | -1.40e-01 | 0.1679 |
| 64499 | TPSB2 | C06 | Human | Oral cavity | OSCC | 1.22e-05 | 1.03e+00 | 0.2699 |
| Page: 1 2 |
| Tissue | Expression Dynamics | Abbreviation |
| Cervix | 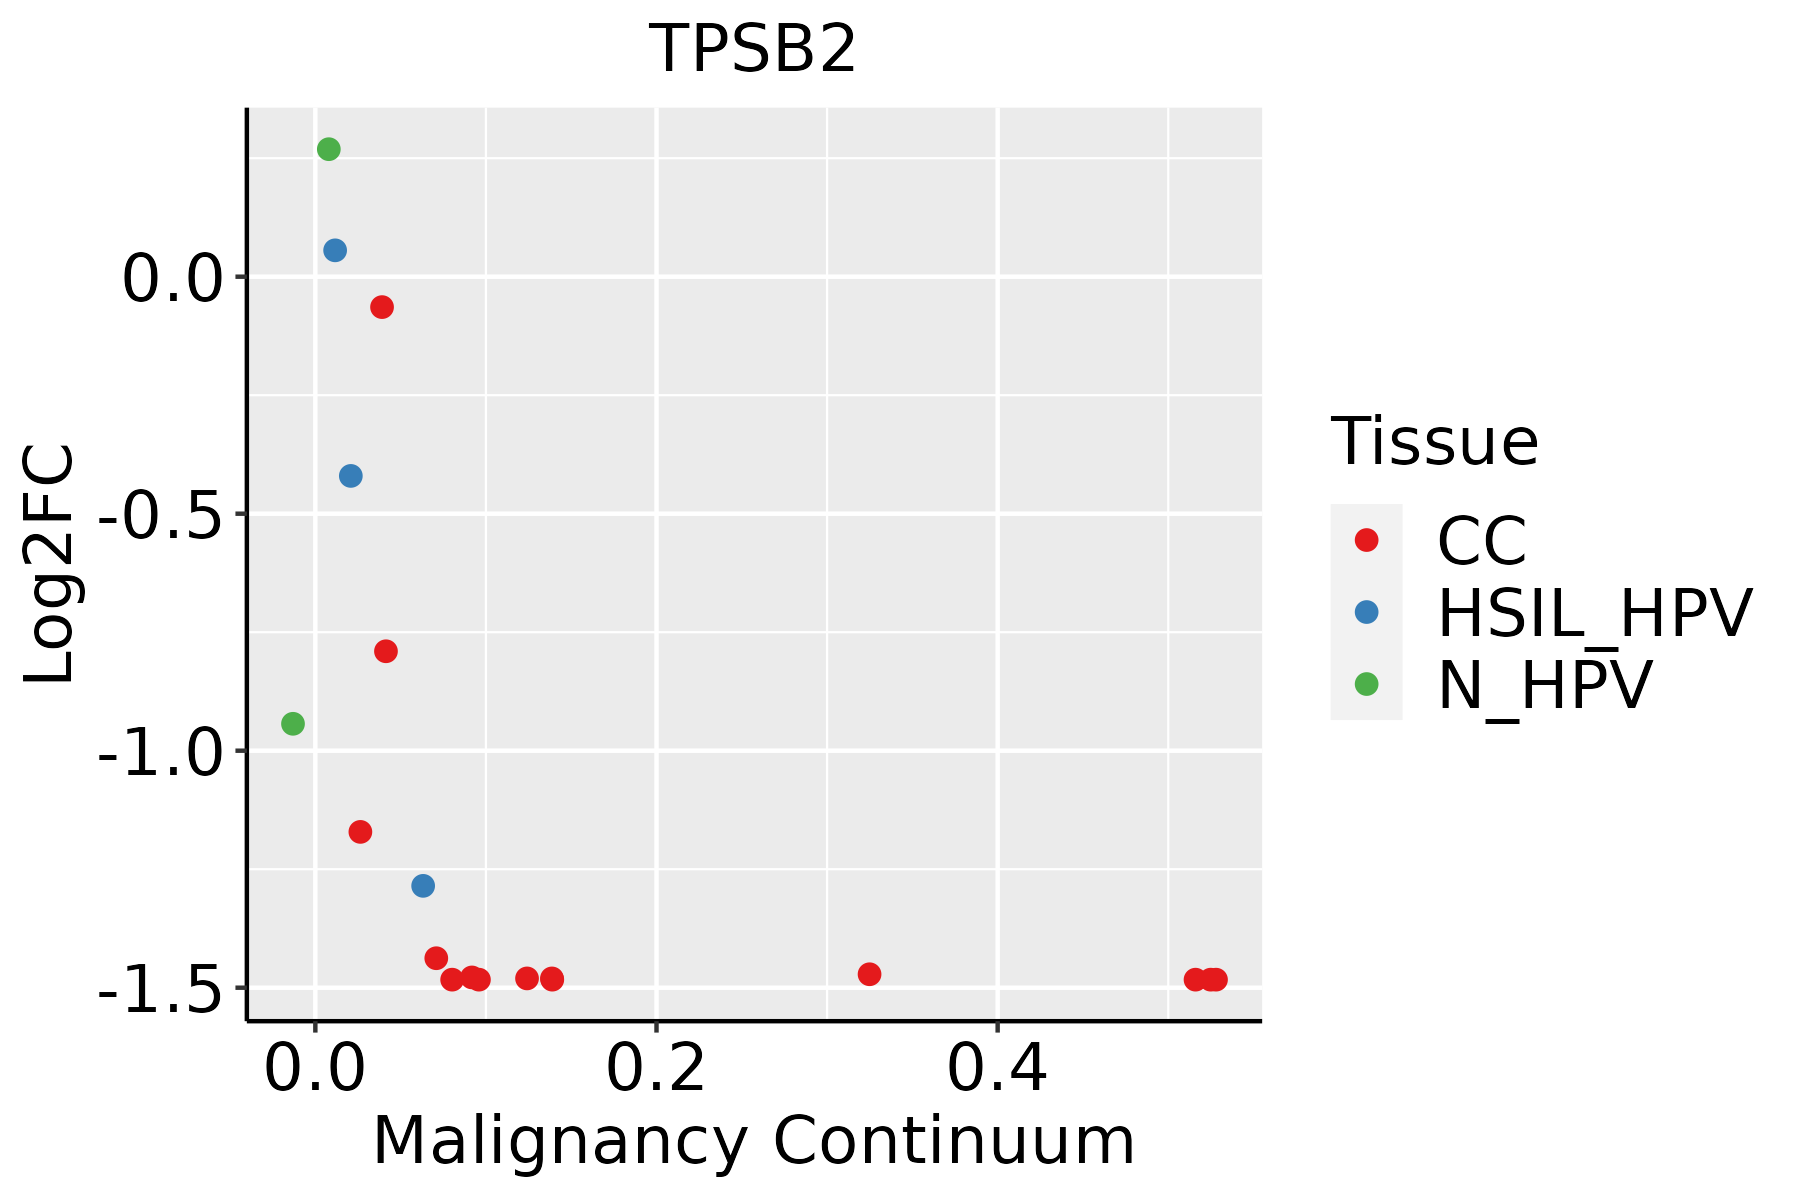 | CC: Cervix cancer |
| HSIL_HPV: HPV-infected high-grade squamous intraepithelial lesions | ||
| N_HPV: HPV-infected normal cervix | ||
| Oral Cavity | 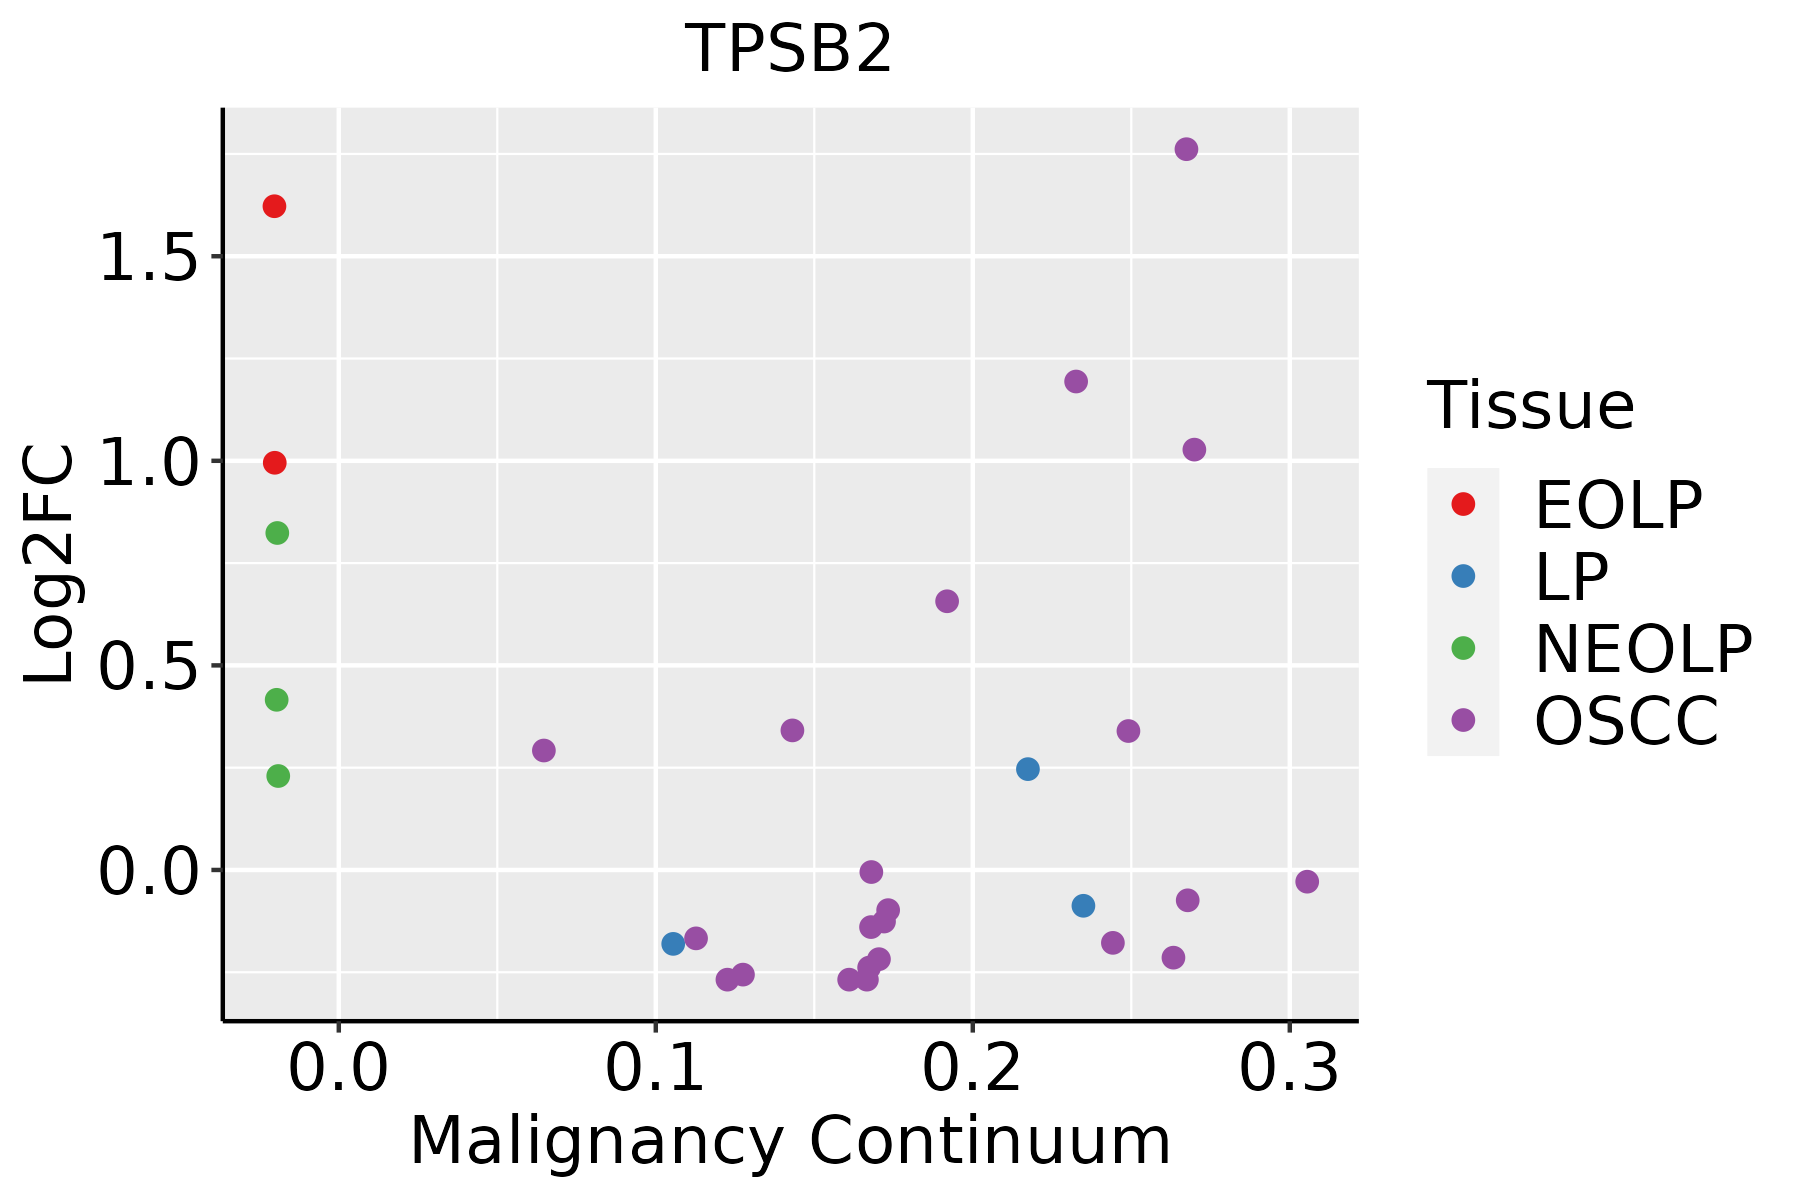 | EOLP: Erosive Oral lichen planus |
| LP: leukoplakia | ||
| NEOLP: Non-erosive oral lichen planus | ||
| OSCC: Oral squamous cell carcinoma | ||
| Thyroid | 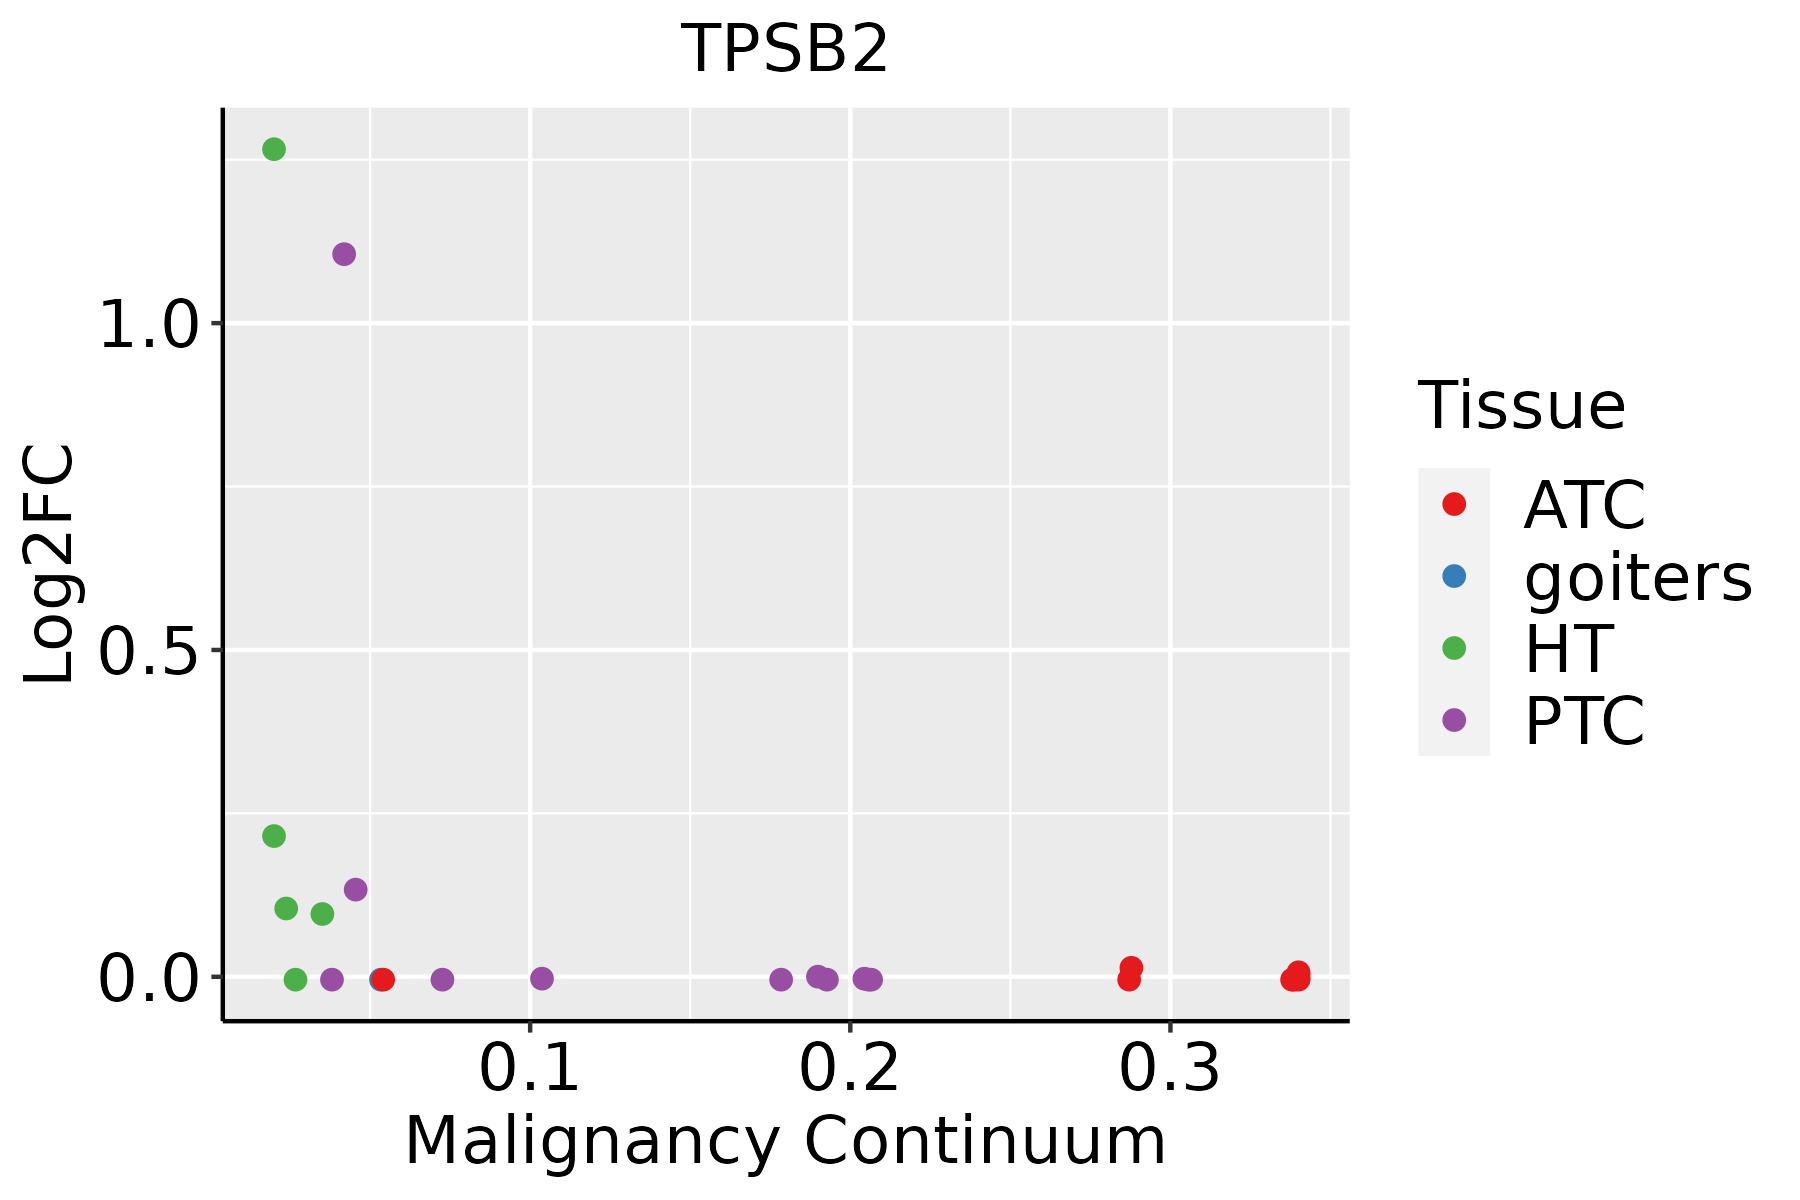 | ATC: Anaplastic thyroid cancer |
| HT: Hashimoto's thyroiditis | ||
| PTC: Papillary thyroid cancer |
| ∗log2FC in expression of this searched gene in stem-like cells from each diseased tissue sample relative to stem-like cells in normal samples in each tissue plotted against the malignancy continuum. Samples are colored based on if they are from different disease stage. |
Top |
Malignant transformation related pathway analysis |
| Find out the enriched GO biological processes and KEGG pathways involved in transition from healthy to precancer to cancer |
| Tissue | Disease Stage | Enriched GO biological Processes |
| Colorectum | AD |  |
| Colorectum | SER |  |
| Colorectum | MSS |  |
| Colorectum | MSI-H |  |
| Colorectum | FAP |  |
| ∗Top 15 enriched GO BP terms are showed in the bar plot of each disease state in each tissue. Each row represents a significant GO biological process which is colored according to the -log10(p.adjust). |
| Page: 1 2 3 4 5 6 7 8 9 |
| GO ID | Tissue | Disease Stage | Description | Gene Ratio | Bg Ratio | pvalue | p.adjust | Count |
| Page: 1 |
| Pathway ID | Tissue | Disease Stage | Description | Gene Ratio | Bg Ratio | pvalue | p.adjust | qvalue | Count |
| hsa0516414 | Cervix | CC | Influenza A | 43/1267 | 171/8465 | 3.03e-04 | 1.64e-03 | 9.68e-04 | 43 |
| hsa0516415 | Cervix | CC | Influenza A | 43/1267 | 171/8465 | 3.03e-04 | 1.64e-03 | 9.68e-04 | 43 |
| hsa0516418 | Oral cavity | OSCC | Influenza A | 116/3704 | 171/8465 | 1.23e-10 | 1.78e-09 | 9.08e-10 | 116 |
| hsa0516419 | Oral cavity | OSCC | Influenza A | 116/3704 | 171/8465 | 1.23e-10 | 1.78e-09 | 9.08e-10 | 116 |
| hsa0516424 | Oral cavity | LP | Influenza A | 80/2418 | 171/8465 | 2.56e-07 | 3.41e-06 | 2.20e-06 | 80 |
| hsa0516434 | Oral cavity | LP | Influenza A | 80/2418 | 171/8465 | 2.56e-07 | 3.41e-06 | 2.20e-06 | 80 |
| hsa0516442 | Oral cavity | EOLP | Influenza A | 58/1218 | 171/8465 | 7.01e-11 | 3.23e-09 | 1.91e-09 | 58 |
| hsa0516452 | Oral cavity | EOLP | Influenza A | 58/1218 | 171/8465 | 7.01e-11 | 3.23e-09 | 1.91e-09 | 58 |
| hsa0516461 | Oral cavity | NEOLP | Influenza A | 43/1112 | 171/8465 | 1.38e-05 | 1.22e-04 | 7.68e-05 | 43 |
| hsa0516471 | Oral cavity | NEOLP | Influenza A | 43/1112 | 171/8465 | 1.38e-05 | 1.22e-04 | 7.68e-05 | 43 |
| Page: 1 |
Top |
Cell-cell communication analysis |
| Identification of potential cell-cell interactions between two cell types and their ligand-receptor pairs for different disease states |
| Ligand | Receptor | LRpair | Pathway | Tissue | Disease Stage |
| Page: 1 |
Top |
Single-cell gene regulatory network inference analysis |
| Find out the significant the regulons (TFs) and the target genes of each regulon across cell types for different disease states |
| TF | Cell Type | Tissue | Disease Stage | Target Gene | RSS | Regulon Activity |
| ∗The dot plots of a searched regulon are shown for all cell subpopulations in each disease state of each tissue based on the regulon specific score inferred using pySCENIC and by calculating the average expression. |
| Page: 1 |
Top |
Somatic mutation of malignant transformation related genes |
| Annotation of somatic variants for genes involved in malignant transformation |
| Hugo Symbol | Variant Class | Variant Classification | dbSNP RS | HGVSc | HGVSp | HGVSp Short | SWISSPROT | BIOTYPE | SIFT | PolyPhen | Tumor Sample Barcode | Tissue | Histology | Sex | Age | Stage | Therapy Types | Drugs | Outcome |
| TPSB2 | SNV | Missense_Mutation | novel | c.788N>T | p.Tyr263Phe | p.Y263F | P20231 | protein_coding | tolerated(0.2) | possibly_damaging(0.628) | TCGA-C8-A26Y-01 | Breast | breast invasive carcinoma | Female | >=65 | I/II | Unknown | Unknown | SD |
| TPSB2 | SNV | Missense_Mutation | novel | c.793N>A | p.Asp265Asn | p.D265N | P20231 | protein_coding | tolerated(0.17) | benign(0.157) | TCGA-A5-A0G1-01 | Endometrium | uterine corpus endometrioid carcinoma | Female | >=65 | I/II | Unknown | Unknown | SD |
| TPSB2 | SNV | Missense_Mutation | rs755399645 | c.739N>A | p.Gly247Ser | p.G247S | P20231 | protein_coding | tolerated(0.16) | benign(0.316) | TCGA-DF-A2KU-01 | Endometrium | uterine corpus endometrioid carcinoma | Female | Unknown | I/II | Unknown | Unknown | SD |
| TPSB2 | SNV | Missense_Mutation | novel | c.146G>T | p.Arg49Ile | p.R49I | P20231 | protein_coding | deleterious(0) | probably_damaging(0.989) | TCGA-EO-A3AY-01 | Endometrium | uterine corpus endometrioid carcinoma | Female | <65 | I/II | Unknown | Unknown | PD |
| TPSB2 | SNV | Missense_Mutation | novel | c.134N>G | p.Gln45Arg | p.Q45R | P20231 | protein_coding | deleterious(0) | possibly_damaging(0.79) | TCGA-FI-A2F4-01 | Endometrium | uterine corpus endometrioid carcinoma | Female | <65 | I/II | Unknown | Unknown | SD |
| TPSB2 | SNV | Missense_Mutation | novel | c.126N>T | p.Trp42Cys | p.W42C | P20231 | protein_coding | deleterious(0.01) | possibly_damaging(0.456) | TCGA-44-7669-01 | Lung | lung adenocarcinoma | Male | <65 | I/II | Chemotherapy | alimta | PD |
| TPSB2 | SNV | Missense_Mutation | rs775504460 | c.65C>A | p.Pro22Gln | p.P22Q | P20231 | protein_coding | tolerated(0.05) | probably_damaging(0.92) | TCGA-86-A4JF-01 | Lung | lung adenocarcinoma | Male | <65 | I/II | Chemotherapy | unknown | PD |
| TPSB2 | SNV | Missense_Mutation | rs763254328 | c.64C>A | p.Pro22Thr | p.P22T | P20231 | protein_coding | deleterious(0.05) | benign(0.233) | TCGA-86-A4JF-01 | Lung | lung adenocarcinoma | Male | <65 | I/II | Chemotherapy | unknown | PD |
| TPSB2 | SNV | Missense_Mutation | novel | c.728N>T | p.Ser243Ile | p.S243I | P20231 | protein_coding | deleterious(0) | probably_damaging(0.999) | TCGA-22-5481-01 | Lung | lung squamous cell carcinoma | Female | >=65 | I/II | Unknown | Unknown | PD |
| TPSB2 | SNV | Missense_Mutation | novel | c.823C>T | p.Pro275Ser | p.P275S | P20231 | protein_coding | deleterious(0) | probably_damaging(1) | TCGA-77-A5G8-01 | Lung | lung squamous cell carcinoma | Male | >=65 | I/II | Unknown | Unknown | SD |
| Page: 1 2 |
Top |
Related drugs of malignant transformation related genes |
| Identification of chemicals and drugs interact with genes involved in malignant transfromation |
| (DGIdb 4.0) |
| Entrez ID | Symbol | Category | Interaction Types | Drug Claim Name | Drug Name | PMIDs |
| 64499 | TPSB2 | DRUGGABLE GENOME, PROTEASE | SALT | VOLANESORSEN SODIUM | 3048411 | |
| 64499 | TPSB2 | DRUGGABLE GENOME, PROTEASE | HEPARIN | HEPARIN | 15265919 |
| Page: 1 |

Copyright 2023-Present -The University of Texas Health Science Center at Houston |