
|
|||||
|
 | |
| |
| |
| |
| |
| |
|
Gene: TPRKB |
Gene summary for TPRKB |
| Gene information | Species | Human | Gene symbol | TPRKB | Gene ID | 51002 |
| Gene name | TP53RK binding protein | |
| Gene Alias | CGI-121 | |
| Cytomap | 2p13.1 | |
| Gene Type | protein-coding | GO ID | GO:0000722 | UniProtAcc | Q9Y3C4 |
Top |
Malignant transformation analysis |
| Identification of the aberrant gene expression in precancerous and cancerous lesions by comparing the gene expression of stem-like cells in diseased tissues with normal stem cells |
| Entrez ID | Symbol | Replicates | Species | Organ | Tissue | Adj P-value | Log2FC | Malignancy |
| 51002 | TPRKB | LZE2T | Human | Esophagus | ESCC | 1.52e-03 | 7.64e-01 | 0.082 |
| 51002 | TPRKB | LZE4T | Human | Esophagus | ESCC | 6.77e-12 | 4.31e-01 | 0.0811 |
| 51002 | TPRKB | LZE7T | Human | Esophagus | ESCC | 7.90e-05 | 3.84e-01 | 0.0667 |
| 51002 | TPRKB | LZE8T | Human | Esophagus | ESCC | 2.52e-04 | 1.11e-01 | 0.067 |
| 51002 | TPRKB | LZE20T | Human | Esophagus | ESCC | 6.05e-03 | 7.63e-02 | 0.0662 |
| 51002 | TPRKB | LZE22T | Human | Esophagus | ESCC | 1.31e-04 | 3.03e-01 | 0.068 |
| 51002 | TPRKB | LZE24T | Human | Esophagus | ESCC | 1.56e-23 | 5.39e-01 | 0.0596 |
| 51002 | TPRKB | LZE21T | Human | Esophagus | ESCC | 1.77e-03 | 4.21e-01 | 0.0655 |
| 51002 | TPRKB | LZE6T | Human | Esophagus | ESCC | 3.36e-09 | 5.90e-01 | 0.0845 |
| 51002 | TPRKB | P1T-E | Human | Esophagus | ESCC | 2.89e-05 | 3.49e-01 | 0.0875 |
| 51002 | TPRKB | P2T-E | Human | Esophagus | ESCC | 2.47e-30 | 7.34e-01 | 0.1177 |
| 51002 | TPRKB | P4T-E | Human | Esophagus | ESCC | 4.82e-56 | 1.42e+00 | 0.1323 |
| 51002 | TPRKB | P5T-E | Human | Esophagus | ESCC | 1.41e-45 | 8.21e-01 | 0.1327 |
| 51002 | TPRKB | P8T-E | Human | Esophagus | ESCC | 1.22e-24 | 4.68e-01 | 0.0889 |
| 51002 | TPRKB | P9T-E | Human | Esophagus | ESCC | 9.16e-25 | 5.03e-01 | 0.1131 |
| 51002 | TPRKB | P10T-E | Human | Esophagus | ESCC | 1.86e-60 | 1.15e+00 | 0.116 |
| 51002 | TPRKB | P11T-E | Human | Esophagus | ESCC | 2.84e-18 | 5.52e-01 | 0.1426 |
| 51002 | TPRKB | P12T-E | Human | Esophagus | ESCC | 2.60e-35 | 6.40e-01 | 0.1122 |
| 51002 | TPRKB | P15T-E | Human | Esophagus | ESCC | 1.39e-33 | 6.65e-01 | 0.1149 |
| 51002 | TPRKB | P16T-E | Human | Esophagus | ESCC | 6.39e-29 | 5.31e-01 | 0.1153 |
| Page: 1 2 3 4 5 6 7 |
| Tissue | Expression Dynamics | Abbreviation |
| Esophagus |  | ESCC: Esophageal squamous cell carcinoma |
| HGIN: High-grade intraepithelial neoplasias | ||
| LGIN: Low-grade intraepithelial neoplasias | ||
| Liver | 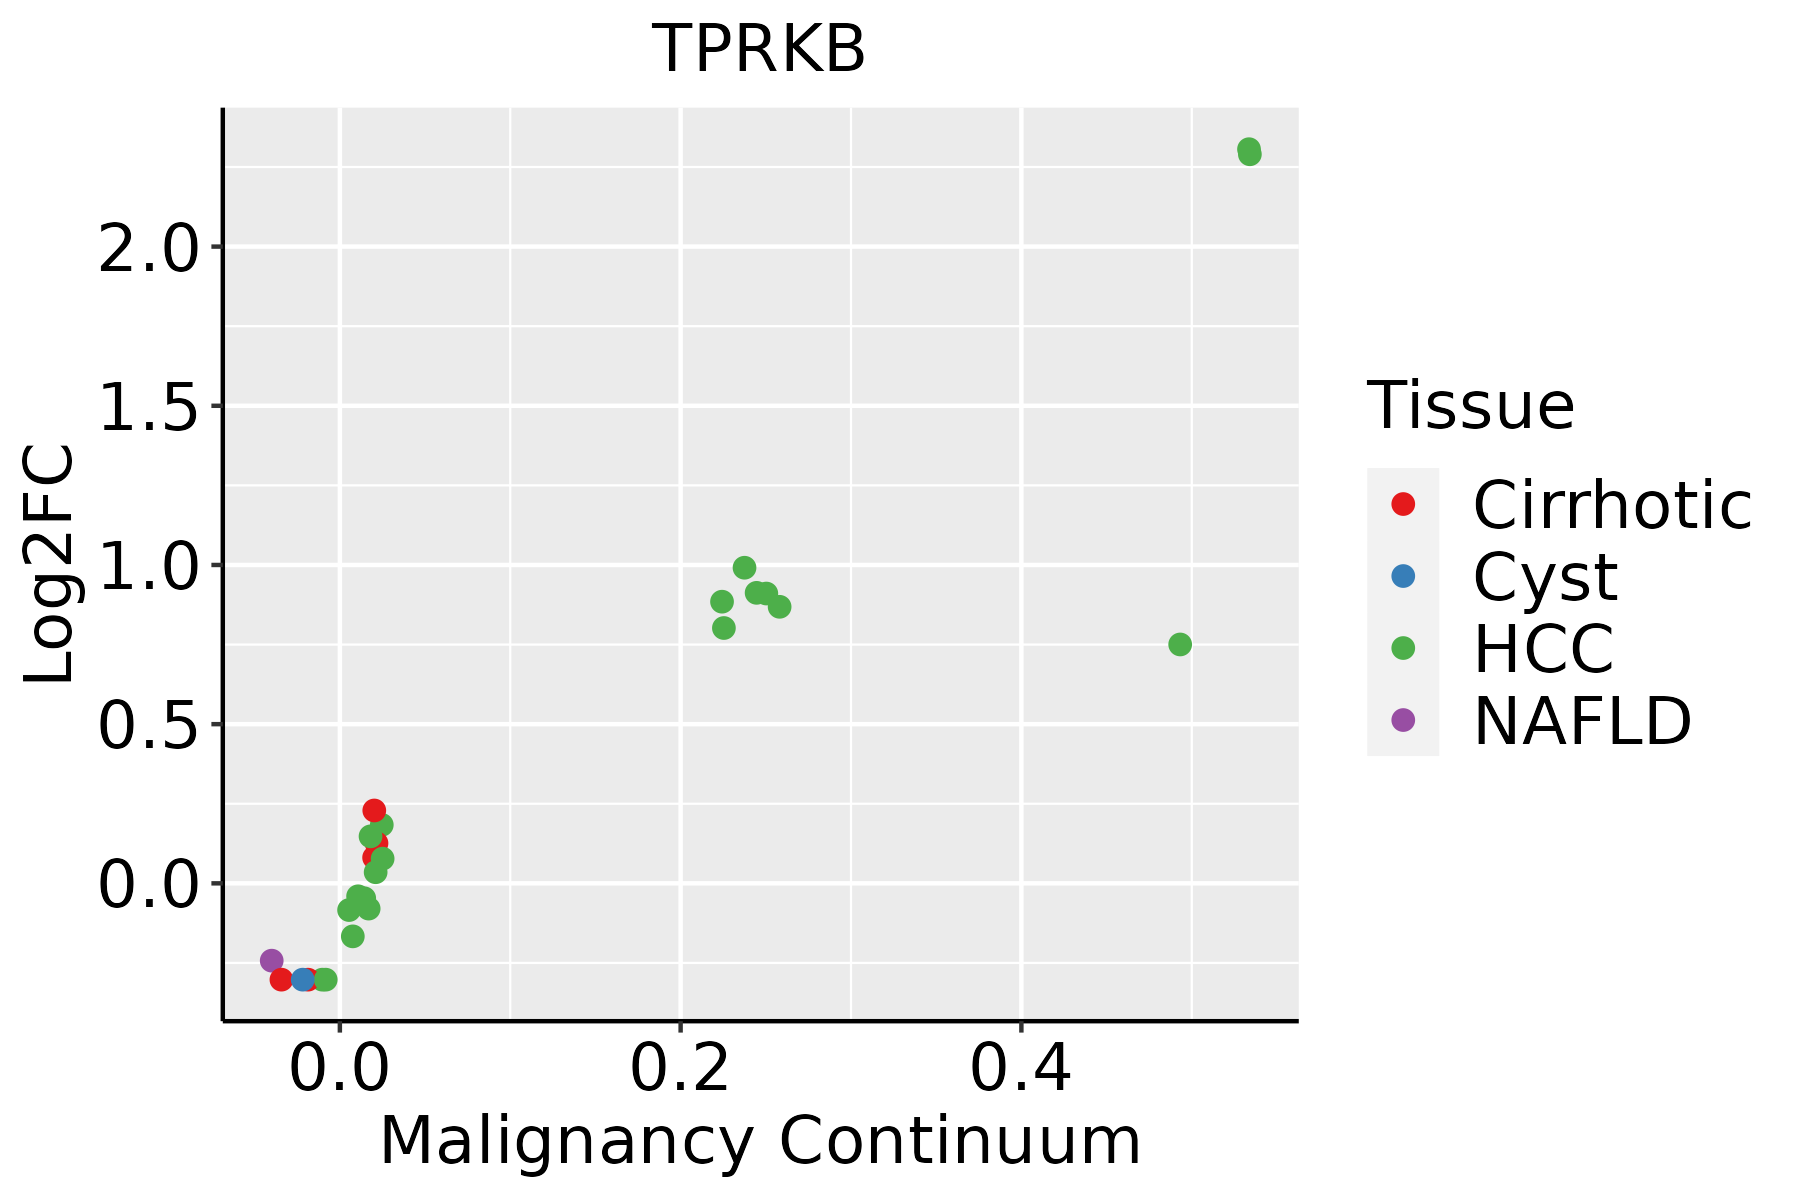 | HCC: Hepatocellular carcinoma |
| NAFLD: Non-alcoholic fatty liver disease | ||
| Oral Cavity |  | EOLP: Erosive Oral lichen planus |
| LP: leukoplakia | ||
| NEOLP: Non-erosive oral lichen planus | ||
| OSCC: Oral squamous cell carcinoma | ||
| Prostate |  | BPH: Benign Prostatic Hyperplasia |
| Skin | 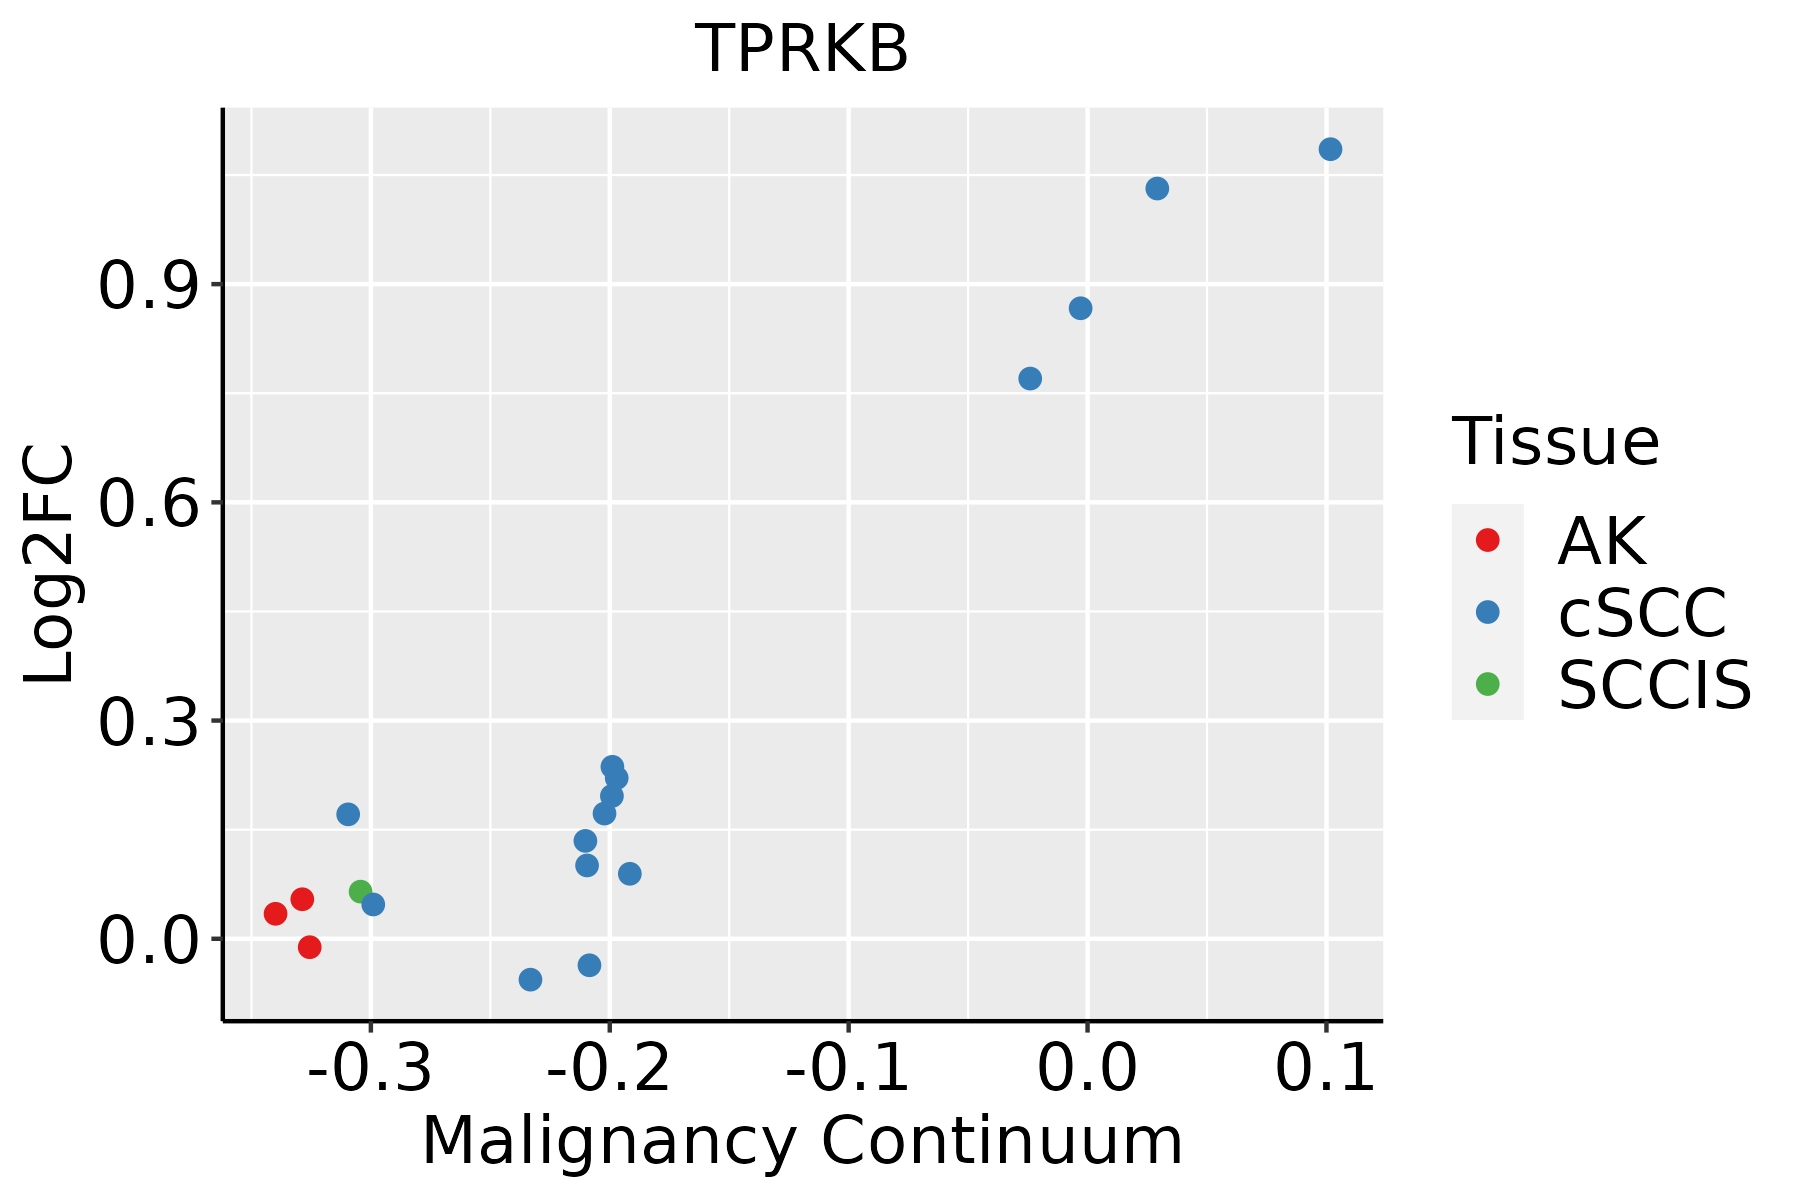 | AK: Actinic keratosis |
| cSCC: Cutaneous squamous cell carcinoma | ||
| SCCIS:squamous cell carcinoma in situ | ||
| Thyroid | 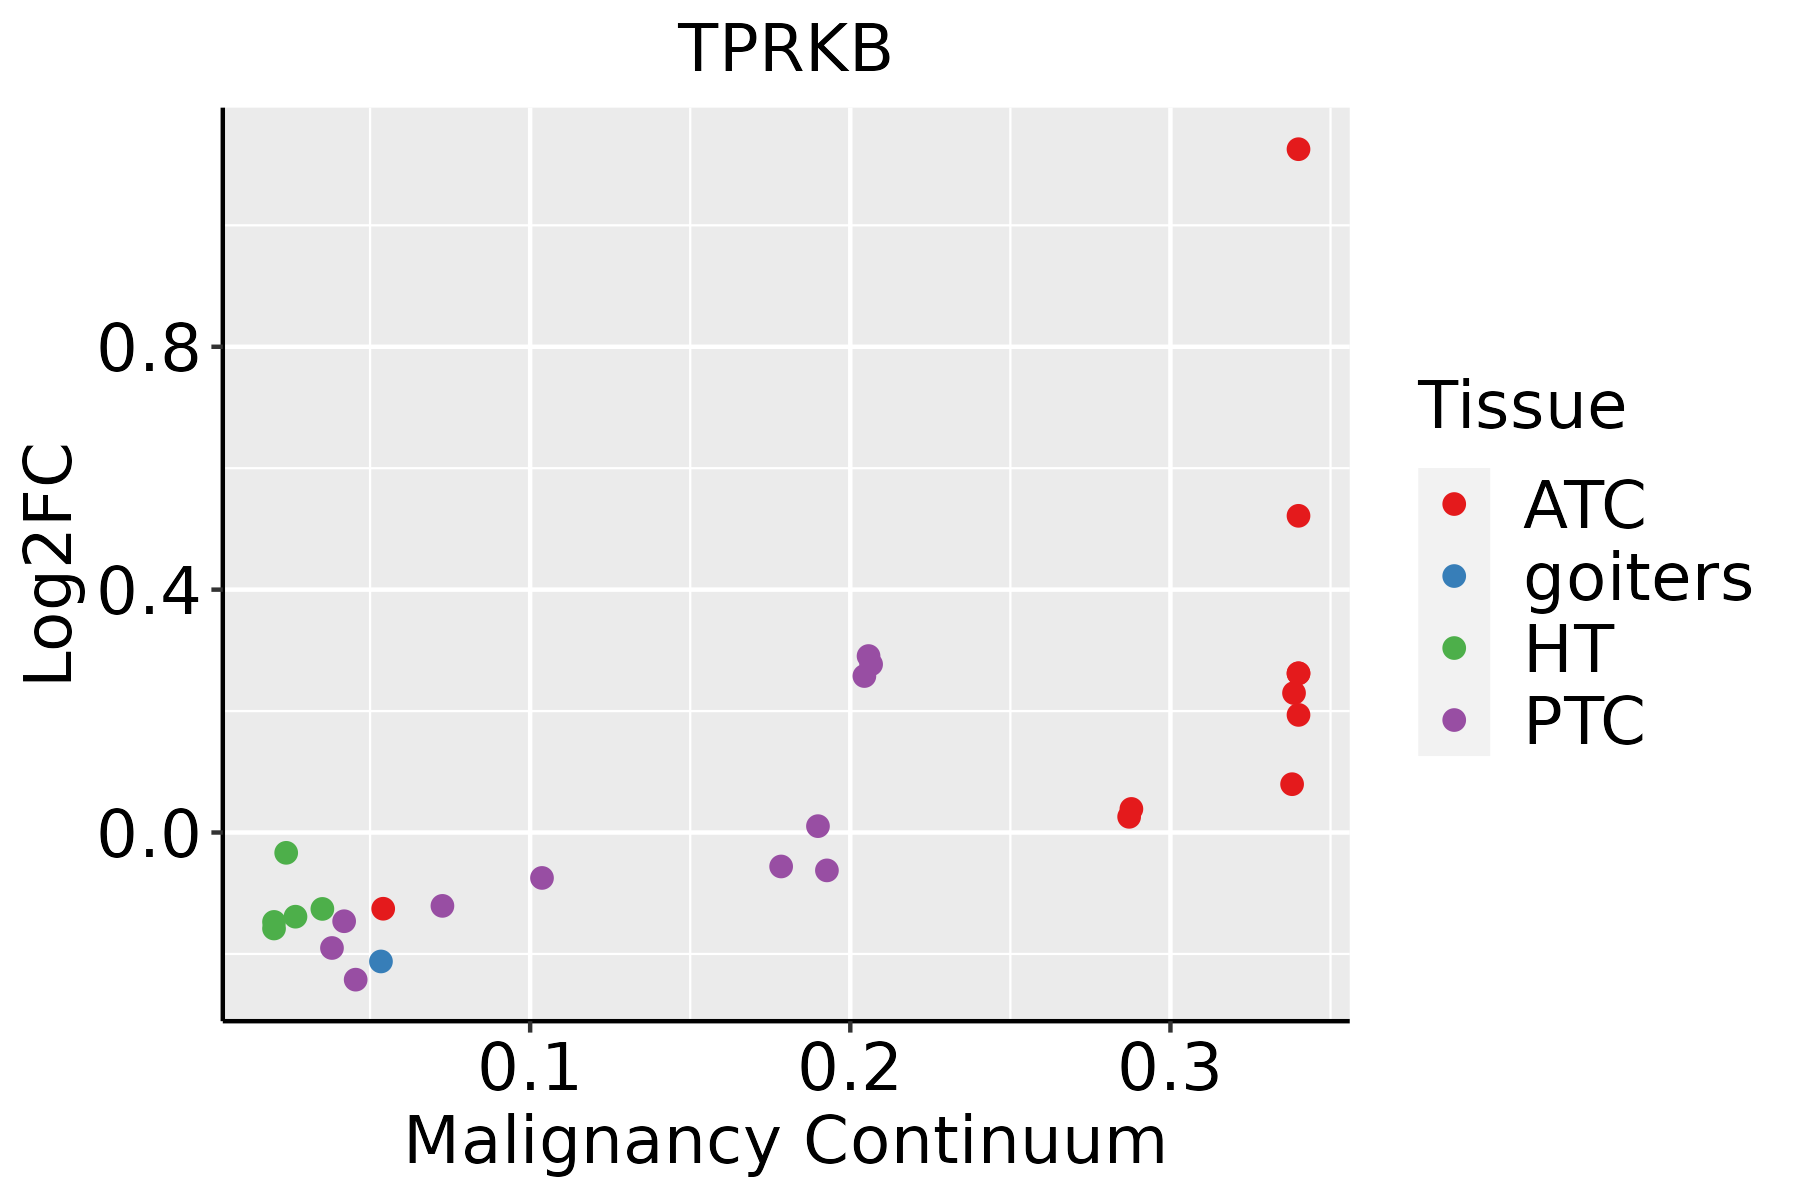 | ATC: Anaplastic thyroid cancer |
| HT: Hashimoto's thyroiditis | ||
| PTC: Papillary thyroid cancer |
| ∗log2FC in expression of this searched gene in stem-like cells from each diseased tissue sample relative to stem-like cells in normal samples in each tissue plotted against the malignancy continuum. Samples are colored based on if they are from different disease stage. |
Top |
Malignant transformation related pathway analysis |
| Find out the enriched GO biological processes and KEGG pathways involved in transition from healthy to precancer to cancer |
| Tissue | Disease Stage | Enriched GO biological Processes |
| Colorectum | AD |  |
| Colorectum | SER |  |
| Colorectum | MSS |  |
| Colorectum | MSI-H |  |
| Colorectum | FAP |  |
| ∗Top 15 enriched GO BP terms are showed in the bar plot of each disease state in each tissue. Each row represents a significant GO biological process which is colored according to the -log10(p.adjust). |
| Page: 1 2 3 4 5 6 7 8 9 |
| GO ID | Tissue | Disease Stage | Description | Gene Ratio | Bg Ratio | pvalue | p.adjust | Count |
| GO:003447015 | Esophagus | ESCC | ncRNA processing | 300/8552 | 395/18723 | 3.09e-35 | 3.26e-32 | 300 |
| GO:003466012 | Esophagus | ESCC | ncRNA metabolic process | 346/8552 | 485/18723 | 4.35e-31 | 2.51e-28 | 346 |
| GO:000072319 | Esophagus | ESCC | telomere maintenance | 99/8552 | 131/18723 | 2.68e-12 | 1.08e-10 | 99 |
| GO:00080333 | Esophagus | ESCC | tRNA processing | 92/8552 | 127/18723 | 7.83e-10 | 1.93e-08 | 92 |
| GO:00063992 | Esophagus | ESCC | tRNA metabolic process | 122/8552 | 179/18723 | 9.03e-10 | 2.19e-08 | 122 |
| GO:00094512 | Esophagus | ESCC | RNA modification | 114/8552 | 167/18723 | 2.76e-09 | 6.04e-08 | 114 |
| GO:00064002 | Esophagus | ESCC | tRNA modification | 62/8552 | 90/18723 | 7.02e-06 | 7.04e-05 | 62 |
| GO:003220014 | Esophagus | ESCC | telomere organization | 99/8552 | 159/18723 | 1.77e-05 | 1.57e-04 | 99 |
| GO:00063101 | Esophagus | ESCC | DNA recombination | 168/8552 | 305/18723 | 5.58e-04 | 3.05e-03 | 168 |
| GO:00344701 | Liver | Cirrhotic | ncRNA processing | 158/4634 | 395/18723 | 1.09e-11 | 6.96e-10 | 158 |
| GO:00346603 | Liver | Cirrhotic | ncRNA metabolic process | 173/4634 | 485/18723 | 3.64e-08 | 1.21e-06 | 173 |
| GO:00007237 | Liver | Cirrhotic | telomere maintenance | 58/4634 | 131/18723 | 7.93e-07 | 1.66e-05 | 58 |
| GO:00322002 | Liver | Cirrhotic | telomere organization | 58/4634 | 159/18723 | 6.31e-04 | 4.82e-03 | 58 |
| GO:00344702 | Liver | HCC | ncRNA processing | 293/7958 | 395/18723 | 4.26e-38 | 6.76e-35 | 293 |
| GO:00346601 | Liver | HCC | ncRNA metabolic process | 332/7958 | 485/18723 | 1.48e-31 | 7.80e-29 | 332 |
| GO:0008033 | Liver | HCC | tRNA processing | 87/7958 | 127/18723 | 2.66e-09 | 7.23e-08 | 87 |
| GO:000072311 | Liver | HCC | telomere maintenance | 85/7958 | 131/18723 | 1.86e-07 | 3.40e-06 | 85 |
| GO:0006399 | Liver | HCC | tRNA metabolic process | 108/7958 | 179/18723 | 1.07e-06 | 1.59e-05 | 108 |
| GO:0009451 | Liver | HCC | RNA modification | 101/7958 | 167/18723 | 2.02e-06 | 2.78e-05 | 101 |
| GO:0006400 | Liver | HCC | tRNA modification | 60/7958 | 90/18723 | 3.09e-06 | 4.09e-05 | 60 |
| Page: 1 2 3 |
| Pathway ID | Tissue | Disease Stage | Description | Gene Ratio | Bg Ratio | pvalue | p.adjust | qvalue | Count |
| Page: 1 |
Top |
Cell-cell communication analysis |
| Identification of potential cell-cell interactions between two cell types and their ligand-receptor pairs for different disease states |
| Ligand | Receptor | LRpair | Pathway | Tissue | Disease Stage |
| Page: 1 |
Top |
Single-cell gene regulatory network inference analysis |
| Find out the significant the regulons (TFs) and the target genes of each regulon across cell types for different disease states |
| TF | Cell Type | Tissue | Disease Stage | Target Gene | RSS | Regulon Activity |
| ∗The dot plots of a searched regulon are shown for all cell subpopulations in each disease state of each tissue based on the regulon specific score inferred using pySCENIC and by calculating the average expression. |
| Page: 1 |
Top |
Somatic mutation of malignant transformation related genes |
| Annotation of somatic variants for genes involved in malignant transformation |
| Hugo Symbol | Variant Class | Variant Classification | dbSNP RS | HGVSc | HGVSp | HGVSp Short | SWISSPROT | BIOTYPE | SIFT | PolyPhen | Tumor Sample Barcode | Tissue | Histology | Sex | Age | Stage | Therapy Types | Drugs | Outcome |
| TPRKB | SNV | Missense_Mutation | c.306C>G | p.His102Gln | p.H102Q | Q9Y3C4 | protein_coding | deleterious(0.02) | probably_damaging(0.967) | TCGA-BH-A18G-01 | Breast | breast invasive carcinoma | Female | >=65 | I/II | Unknown | Unknown | SD | |
| TPRKB | SNV | Missense_Mutation | c.433C>G | p.Leu145Val | p.L145V | Q9Y3C4 | protein_coding | tolerated(0.09) | possibly_damaging(0.482) | TCGA-E9-A1R7-01 | Breast | breast invasive carcinoma | Female | <65 | I/II | Hormone Therapy | fareston | SD | |
| TPRKB | SNV | Missense_Mutation | novel | c.593N>T | p.Gly198Val | p.G198V | Q9Y3C4 | protein_coding | deleterious(0) | probably_damaging(0.992) | TCGA-CA-6717-01 | Colorectum | colon adenocarcinoma | Male | <65 | I/II | Chemotherapy | oxaliplatin | CR |
| TPRKB | SNV | Missense_Mutation | c.592N>A | p.Gly198Arg | p.G198R | Q9Y3C4 | protein_coding | deleterious(0.04) | probably_damaging(0.994) | TCGA-DM-A28C-01 | Colorectum | colon adenocarcinoma | Male | >=65 | I/II | Unknown | Unknown | PD | |
| TPRKB | SNV | Missense_Mutation | novel | c.404N>G | p.Phe135Cys | p.F135C | Q9Y3C4 | protein_coding | deleterious(0.04) | possibly_damaging(0.56) | TCGA-F5-6814-01 | Colorectum | rectum adenocarcinoma | Male | <65 | I/II | Unknown | Unknown | SD |
| TPRKB | SNV | Missense_Mutation | novel | c.625T>C | p.Ser209Pro | p.S209P | Q9Y3C4 | protein_coding | deleterious(0.01) | possibly_damaging(0.83) | TCGA-B5-A1MR-01 | Endometrium | uterine corpus endometrioid carcinoma | Female | >=65 | III/IV | Unknown | Unknown | SD |
| TPRKB | SNV | Missense_Mutation | novel | c.351A>C | p.Glu117Asp | p.E117D | Q9Y3C4 | protein_coding | deleterious(0.01) | probably_damaging(0.986) | TCGA-B5-A1MR-01 | Endometrium | uterine corpus endometrioid carcinoma | Female | >=65 | III/IV | Unknown | Unknown | SD |
| TPRKB | SNV | Missense_Mutation | novel | c.634G>T | p.Asp212Tyr | p.D212Y | Q9Y3C4 | protein_coding | deleterious(0) | probably_damaging(1) | TCGA-DF-A2KU-01 | Endometrium | uterine corpus endometrioid carcinoma | Female | Unknown | I/II | Unknown | Unknown | SD |
| TPRKB | SNV | Missense_Mutation | rs368782517 | c.140N>C | p.Val47Ala | p.V47A | Q9Y3C4 | protein_coding | deleterious(0.01) | benign(0.164) | TCGA-DI-A1BU-01 | Endometrium | uterine corpus endometrioid carcinoma | Female | <65 | I/II | Chemotherapy | paclitaxel | SD |
| TPRKB | SNV | Missense_Mutation | novel | c.335G>T | p.Arg112Ile | p.R112I | Q9Y3C4 | protein_coding | deleterious(0) | probably_damaging(0.996) | TCGA-E6-A1LX-01 | Endometrium | uterine corpus endometrioid carcinoma | Female | <65 | I/II | Unknown | Unknown | SD |
| Page: 1 2 |
Top |
Related drugs of malignant transformation related genes |
| Identification of chemicals and drugs interact with genes involved in malignant transfromation |
| (DGIdb 4.0) |
| Entrez ID | Symbol | Category | Interaction Types | Drug Claim Name | Drug Name | PMIDs |
| Page: 1 |

Copyright 2023-Present -The University of Texas Health Science Center at Houston |