
|
|||||
|
 | |
| |
| |
| |
| |
| |
|
Gene: TPRG1L |
Gene summary for TPRG1L |
| Gene information | Species | Human | Gene symbol | TPRG1L | Gene ID | 127262 |
| Gene name | tumor protein p63 regulated 1 like | |
| Gene Alias | FAM79A | |
| Cytomap | 1p36.32 | |
| Gene Type | protein-coding | GO ID | GO:0007154 | UniProtAcc | Q5T0D9 |
Top |
Malignant transformation analysis |
| Identification of the aberrant gene expression in precancerous and cancerous lesions by comparing the gene expression of stem-like cells in diseased tissues with normal stem cells |
| Entrez ID | Symbol | Replicates | Species | Organ | Tissue | Adj P-value | Log2FC | Malignancy |
| 127262 | TPRG1L | HTA11_2487_2000001011 | Human | Colorectum | SER | 3.67e-12 | 4.55e-01 | -0.1808 |
| 127262 | TPRG1L | HTA11_1938_2000001011 | Human | Colorectum | AD | 8.54e-08 | 3.07e-01 | -0.0811 |
| 127262 | TPRG1L | HTA11_347_2000001011 | Human | Colorectum | AD | 1.49e-15 | 3.94e-01 | -0.1954 |
| 127262 | TPRG1L | HTA11_2112_2000001011 | Human | Colorectum | SER | 5.09e-05 | 4.90e-01 | -0.2196 |
| 127262 | TPRG1L | HTA11_3361_2000001011 | Human | Colorectum | AD | 2.79e-05 | 3.16e-01 | -0.1207 |
| 127262 | TPRG1L | HTA11_696_2000001011 | Human | Colorectum | AD | 7.81e-08 | 2.69e-01 | -0.1464 |
| 127262 | TPRG1L | HTA11_866_2000001011 | Human | Colorectum | AD | 2.68e-02 | 1.92e-01 | -0.1001 |
| 127262 | TPRG1L | HTA11_1391_2000001011 | Human | Colorectum | AD | 6.19e-07 | 2.48e-01 | -0.059 |
| 127262 | TPRG1L | HTA11_5212_2000001011 | Human | Colorectum | AD | 1.76e-03 | 3.58e-01 | -0.2061 |
| 127262 | TPRG1L | HTA11_6818_2000001021 | Human | Colorectum | AD | 4.78e-05 | 2.67e-01 | 0.0588 |
| 127262 | TPRG1L | HTA11_99999971662_82457 | Human | Colorectum | MSS | 2.74e-11 | 3.55e-01 | 0.3859 |
| 127262 | TPRG1L | LZE24T | Human | Esophagus | ESCC | 2.34e-03 | 4.36e-02 | 0.0596 |
| 127262 | TPRG1L | LZE21T | Human | Esophagus | ESCC | 1.14e-02 | 1.03e-01 | 0.0655 |
| 127262 | TPRG1L | P2T-E | Human | Esophagus | ESCC | 2.77e-08 | 9.04e-03 | 0.1177 |
| 127262 | TPRG1L | P4T-E | Human | Esophagus | ESCC | 1.06e-16 | 3.27e-01 | 0.1323 |
| 127262 | TPRG1L | P5T-E | Human | Esophagus | ESCC | 7.13e-07 | 8.55e-02 | 0.1327 |
| 127262 | TPRG1L | P8T-E | Human | Esophagus | ESCC | 9.42e-19 | 1.60e-01 | 0.0889 |
| 127262 | TPRG1L | P9T-E | Human | Esophagus | ESCC | 1.15e-02 | 2.86e-02 | 0.1131 |
| 127262 | TPRG1L | P10T-E | Human | Esophagus | ESCC | 1.09e-07 | 1.08e-01 | 0.116 |
| 127262 | TPRG1L | P11T-E | Human | Esophagus | ESCC | 8.99e-03 | 2.08e-01 | 0.1426 |
| Page: 1 2 3 4 5 6 |
| Tissue | Expression Dynamics | Abbreviation |
| Colorectum (GSE201348) |  | FAP: Familial adenomatous polyposis |
| CRC: Colorectal cancer | ||
| Colorectum (HTA11) |  | AD: Adenomas |
| SER: Sessile serrated lesions | ||
| MSI-H: Microsatellite-high colorectal cancer | ||
| MSS: Microsatellite stable colorectal cancer | ||
| Esophagus |  | ESCC: Esophageal squamous cell carcinoma |
| HGIN: High-grade intraepithelial neoplasias | ||
| LGIN: Low-grade intraepithelial neoplasias | ||
| Liver |  | HCC: Hepatocellular carcinoma |
| NAFLD: Non-alcoholic fatty liver disease | ||
| Oral Cavity | 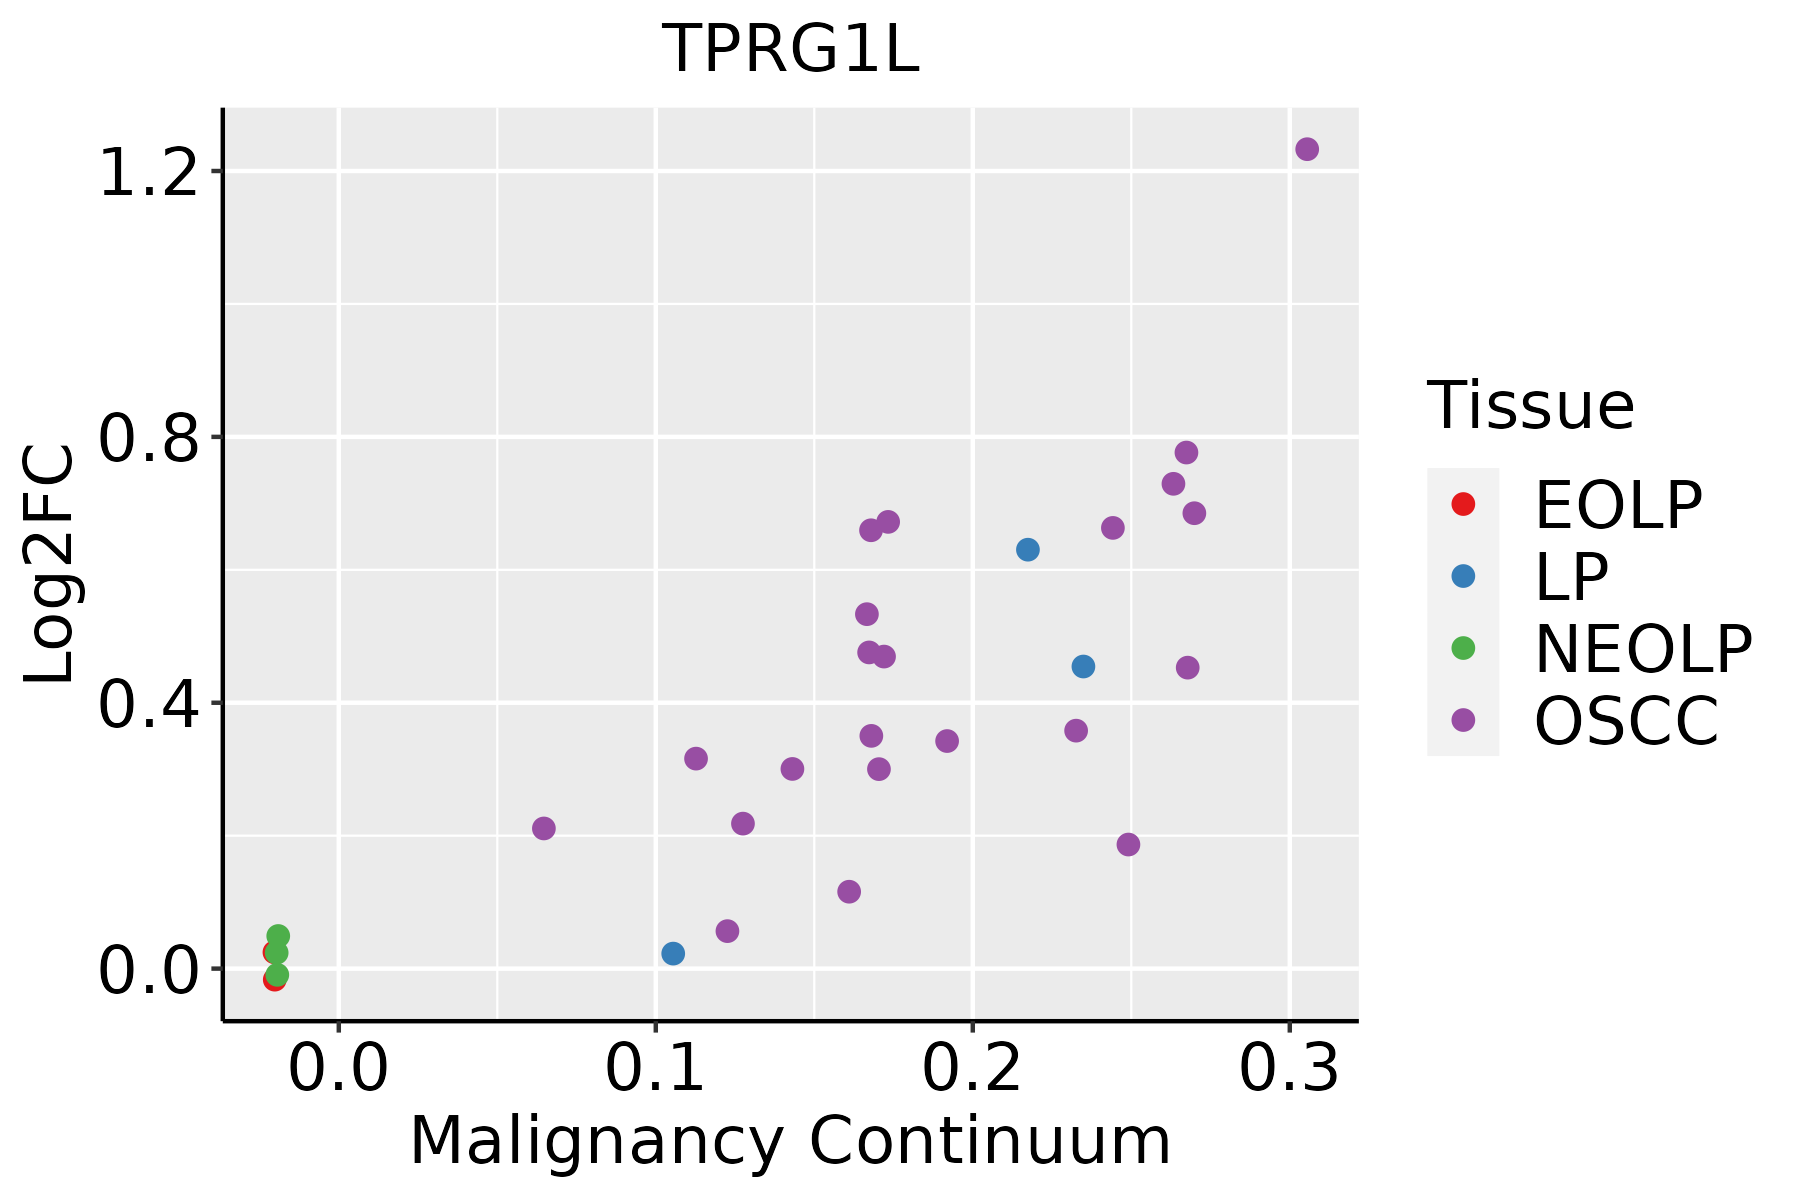 | EOLP: Erosive Oral lichen planus |
| LP: leukoplakia | ||
| NEOLP: Non-erosive oral lichen planus | ||
| OSCC: Oral squamous cell carcinoma | ||
| Prostate | 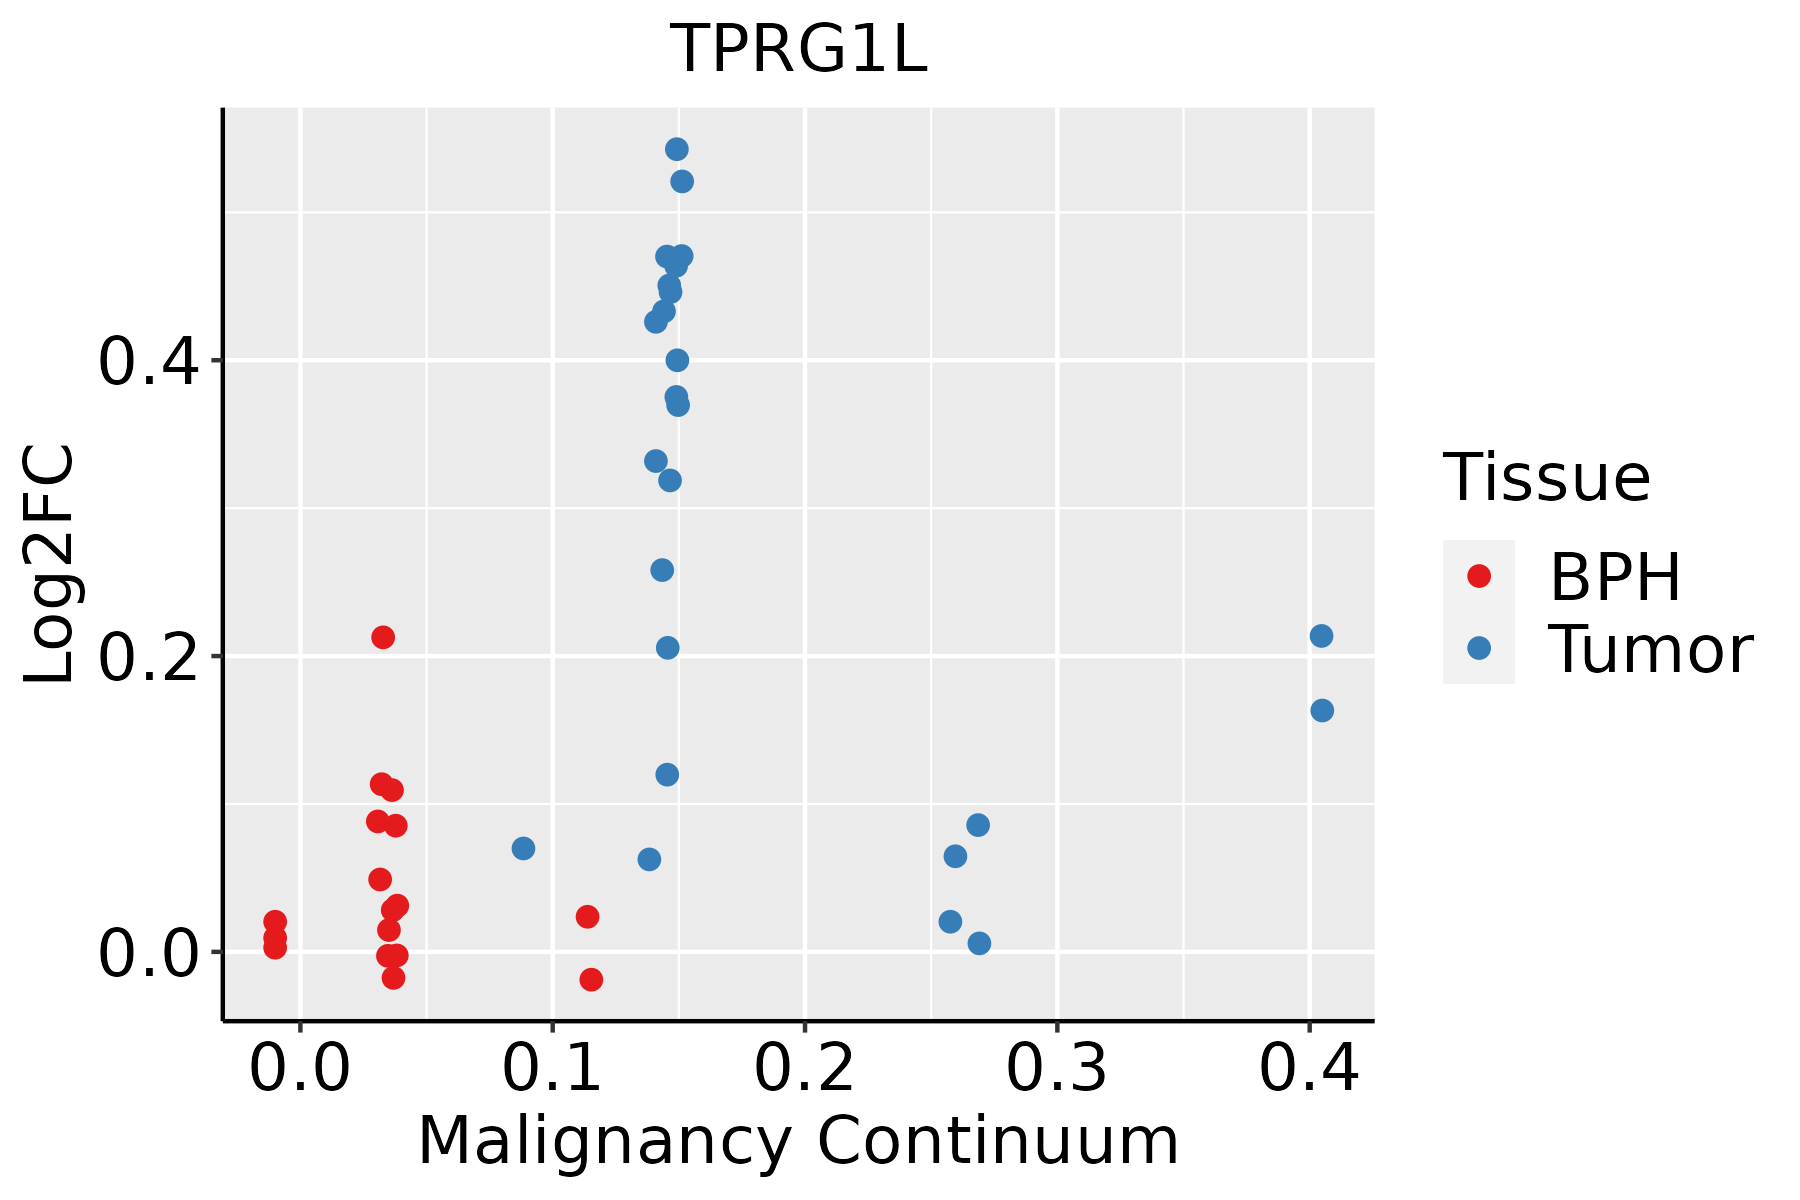 | BPH: Benign Prostatic Hyperplasia |
| Skin | 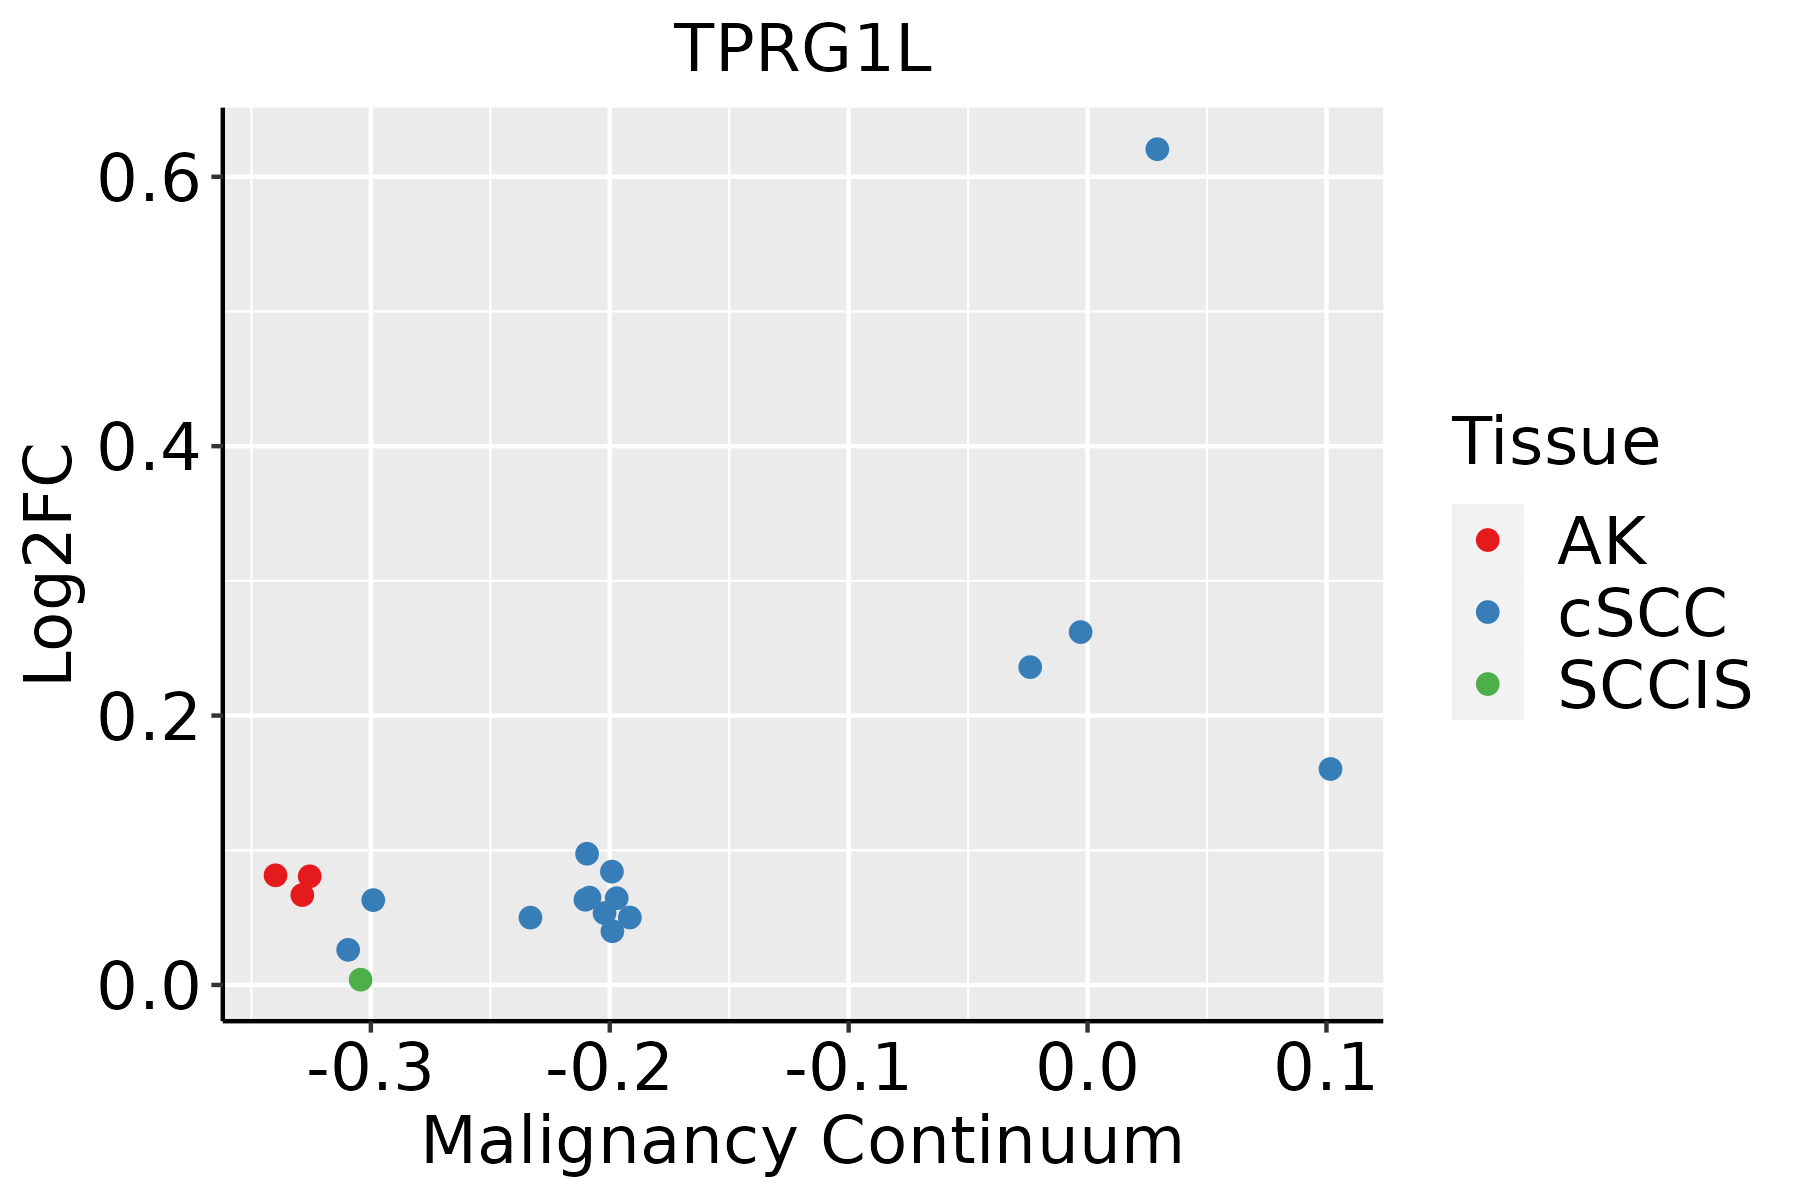 | AK: Actinic keratosis |
| cSCC: Cutaneous squamous cell carcinoma | ||
| SCCIS:squamous cell carcinoma in situ |
| ∗log2FC in expression of this searched gene in stem-like cells from each diseased tissue sample relative to stem-like cells in normal samples in each tissue plotted against the malignancy continuum. Samples are colored based on if they are from different disease stage. |
Top |
Malignant transformation related pathway analysis |
| Find out the enriched GO biological processes and KEGG pathways involved in transition from healthy to precancer to cancer |
| Tissue | Disease Stage | Enriched GO biological Processes |
| Colorectum | AD |  |
| Colorectum | SER |  |
| Colorectum | MSS |  |
| Colorectum | MSI-H |  |
| Colorectum | FAP |  |
| ∗Top 15 enriched GO BP terms are showed in the bar plot of each disease state in each tissue. Each row represents a significant GO biological process which is colored according to the -log10(p.adjust). |
| Page: 1 2 3 4 5 6 7 8 9 |
| GO ID | Tissue | Disease Stage | Description | Gene Ratio | Bg Ratio | pvalue | p.adjust | Count |
| Page: 1 |
| Pathway ID | Tissue | Disease Stage | Description | Gene Ratio | Bg Ratio | pvalue | p.adjust | qvalue | Count |
| Page: 1 |
Top |
Cell-cell communication analysis |
| Identification of potential cell-cell interactions between two cell types and their ligand-receptor pairs for different disease states |
| Ligand | Receptor | LRpair | Pathway | Tissue | Disease Stage |
| Page: 1 |
Top |
Single-cell gene regulatory network inference analysis |
| Find out the significant the regulons (TFs) and the target genes of each regulon across cell types for different disease states |
| TF | Cell Type | Tissue | Disease Stage | Target Gene | RSS | Regulon Activity |
| ∗The dot plots of a searched regulon are shown for all cell subpopulations in each disease state of each tissue based on the regulon specific score inferred using pySCENIC and by calculating the average expression. |
| Page: 1 |
Top |
Somatic mutation of malignant transformation related genes |
| Annotation of somatic variants for genes involved in malignant transformation |
| Hugo Symbol | Variant Class | Variant Classification | dbSNP RS | HGVSc | HGVSp | HGVSp Short | SWISSPROT | BIOTYPE | SIFT | PolyPhen | Tumor Sample Barcode | Tissue | Histology | Sex | Age | Stage | Therapy Types | Drugs | Outcome |
| TPRG1L | deletion | Frame_Shift_Del | c.666delA | p.Ala223ProfsTer15 | p.A223Pfs*15 | Q5T0D9 | protein_coding | TCGA-D8-A1XQ-01 | Breast | breast invasive carcinoma | Female | >=65 | I/II | Unknown | Unknown | SD | |||
| TPRG1L | SNV | Missense_Mutation | novel | c.811N>T | p.Gly271Cys | p.G271C | Q5T0D9 | protein_coding | deleterious(0.01) | probably_damaging(1) | TCGA-D5-6928-01 | Colorectum | colon adenocarcinoma | Male | >=65 | I/II | Unknown | Unknown | SD |
| TPRG1L | SNV | Missense_Mutation | rs778701998 | c.491G>A | p.Arg164Gln | p.R164Q | Q5T0D9 | protein_coding | deleterious(0.05) | probably_damaging(0.994) | TCGA-AG-A002-01 | Colorectum | rectum adenocarcinoma | Male | <65 | I/II | Unknown | Unknown | SD |
| TPRG1L | SNV | Missense_Mutation | rs778701998 | c.491N>A | p.Arg164Gln | p.R164Q | Q5T0D9 | protein_coding | deleterious(0.05) | probably_damaging(0.994) | TCGA-EI-6917-01 | Colorectum | rectum adenocarcinoma | Male | <65 | III/IV | Chemotherapy | 5fluorouracil+oxaciplatina+l-folinian | SD |
| TPRG1L | SNV | Missense_Mutation | c.344N>C | p.Gln115Pro | p.Q115P | Q5T0D9 | protein_coding | tolerated(0.07) | benign(0.284) | TCGA-EI-7002-01 | Colorectum | rectum adenocarcinoma | Male | <65 | III/IV | Chemotherapy | irinotecan+5-fluorouracilim | SD | |
| TPRG1L | SNV | Missense_Mutation | c.736G>A | p.Glu246Lys | p.E246K | Q5T0D9 | protein_coding | deleterious(0.01) | probably_damaging(0.981) | TCGA-AP-A056-01 | Endometrium | uterine corpus endometrioid carcinoma | Female | <65 | I/II | Unknown | Unknown | SD | |
| TPRG1L | SNV | Missense_Mutation | novel | c.641C>A | p.Ala214Asp | p.A214D | Q5T0D9 | protein_coding | tolerated(0.09) | possibly_damaging(0.462) | TCGA-AX-A1CE-01 | Endometrium | uterine corpus endometrioid carcinoma | Female | <65 | I/II | Unspecific | Paclitaxel | SD |
| TPRG1L | SNV | Missense_Mutation | rs768388046 | c.776N>T | p.Ala259Val | p.A259V | Q5T0D9 | protein_coding | tolerated(0.1) | probably_damaging(0.986) | TCGA-B5-A3FA-01 | Endometrium | uterine corpus endometrioid carcinoma | Female | >=65 | I/II | Unknown | Unknown | SD |
| TPRG1L | SNV | Missense_Mutation | rs778701998 | c.491N>A | p.Arg164Gln | p.R164Q | Q5T0D9 | protein_coding | deleterious(0.05) | probably_damaging(0.994) | TCGA-BS-A0UV-01 | Endometrium | uterine corpus endometrioid carcinoma | Female | <65 | III/IV | Unknown | Unknown | SD |
| TPRG1L | SNV | Missense_Mutation | novel | c.541N>T | p.Pro181Ser | p.P181S | Q5T0D9 | protein_coding | deleterious(0) | probably_damaging(0.996) | TCGA-DF-A2KU-01 | Endometrium | uterine corpus endometrioid carcinoma | Female | Unknown | I/II | Unknown | Unknown | SD |
| Page: 1 2 3 |
Top |
Related drugs of malignant transformation related genes |
| Identification of chemicals and drugs interact with genes involved in malignant transfromation |
| (DGIdb 4.0) |
| Entrez ID | Symbol | Category | Interaction Types | Drug Claim Name | Drug Name | PMIDs |
| Page: 1 |

Copyright 2023-Present -The University of Texas Health Science Center at Houston |