
|
|||||
|
 | |
| |
| |
| |
| |
| |
|
Gene: TPRA1 |
Gene summary for TPRA1 |
| Gene information | Species | Human | Gene symbol | TPRA1 | Gene ID | 131601 |
| Gene name | transmembrane protein adipocyte associated 1 | |
| Gene Alias | GPR175 | |
| Cytomap | 3q21.3 | |
| Gene Type | protein-coding | GO ID | GO:0000278 | UniProtAcc | Q86W33 |
Top |
Malignant transformation analysis |
| Identification of the aberrant gene expression in precancerous and cancerous lesions by comparing the gene expression of stem-like cells in diseased tissues with normal stem cells |
| Entrez ID | Symbol | Replicates | Species | Organ | Tissue | Adj P-value | Log2FC | Malignancy |
| 131601 | TPRA1 | LZE4T | Human | Esophagus | ESCC | 3.32e-07 | 1.05e-01 | 0.0811 |
| 131601 | TPRA1 | LZE7T | Human | Esophagus | ESCC | 1.26e-06 | 3.84e-01 | 0.0667 |
| 131601 | TPRA1 | LZE22T | Human | Esophagus | ESCC | 5.22e-07 | 4.37e-01 | 0.068 |
| 131601 | TPRA1 | LZE24T | Human | Esophagus | ESCC | 2.16e-30 | 7.47e-01 | 0.0596 |
| 131601 | TPRA1 | LZE21T | Human | Esophagus | ESCC | 3.96e-04 | 2.88e-01 | 0.0655 |
| 131601 | TPRA1 | P1T-E | Human | Esophagus | ESCC | 9.49e-16 | 8.56e-01 | 0.0875 |
| 131601 | TPRA1 | P2T-E | Human | Esophagus | ESCC | 9.04e-90 | 1.53e+00 | 0.1177 |
| 131601 | TPRA1 | P4T-E | Human | Esophagus | ESCC | 2.34e-45 | 9.82e-01 | 0.1323 |
| 131601 | TPRA1 | P5T-E | Human | Esophagus | ESCC | 2.55e-37 | 8.07e-01 | 0.1327 |
| 131601 | TPRA1 | P8T-E | Human | Esophagus | ESCC | 5.35e-45 | 8.78e-01 | 0.0889 |
| 131601 | TPRA1 | P9T-E | Human | Esophagus | ESCC | 3.05e-36 | 6.92e-01 | 0.1131 |
| 131601 | TPRA1 | P10T-E | Human | Esophagus | ESCC | 2.63e-55 | 9.80e-01 | 0.116 |
| 131601 | TPRA1 | P11T-E | Human | Esophagus | ESCC | 1.87e-26 | 1.11e+00 | 0.1426 |
| 131601 | TPRA1 | P12T-E | Human | Esophagus | ESCC | 9.84e-37 | 7.16e-01 | 0.1122 |
| 131601 | TPRA1 | P15T-E | Human | Esophagus | ESCC | 1.20e-34 | 7.31e-01 | 0.1149 |
| 131601 | TPRA1 | P16T-E | Human | Esophagus | ESCC | 1.49e-53 | 9.40e-01 | 0.1153 |
| 131601 | TPRA1 | P17T-E | Human | Esophagus | ESCC | 6.36e-12 | 4.06e-01 | 0.1278 |
| 131601 | TPRA1 | P19T-E | Human | Esophagus | ESCC | 7.08e-13 | 6.20e-01 | 0.1662 |
| 131601 | TPRA1 | P20T-E | Human | Esophagus | ESCC | 3.22e-39 | 8.44e-01 | 0.1124 |
| 131601 | TPRA1 | P21T-E | Human | Esophagus | ESCC | 1.64e-39 | 8.44e-01 | 0.1617 |
| Page: 1 2 3 4 5 |
| Tissue | Expression Dynamics | Abbreviation |
| Esophagus | 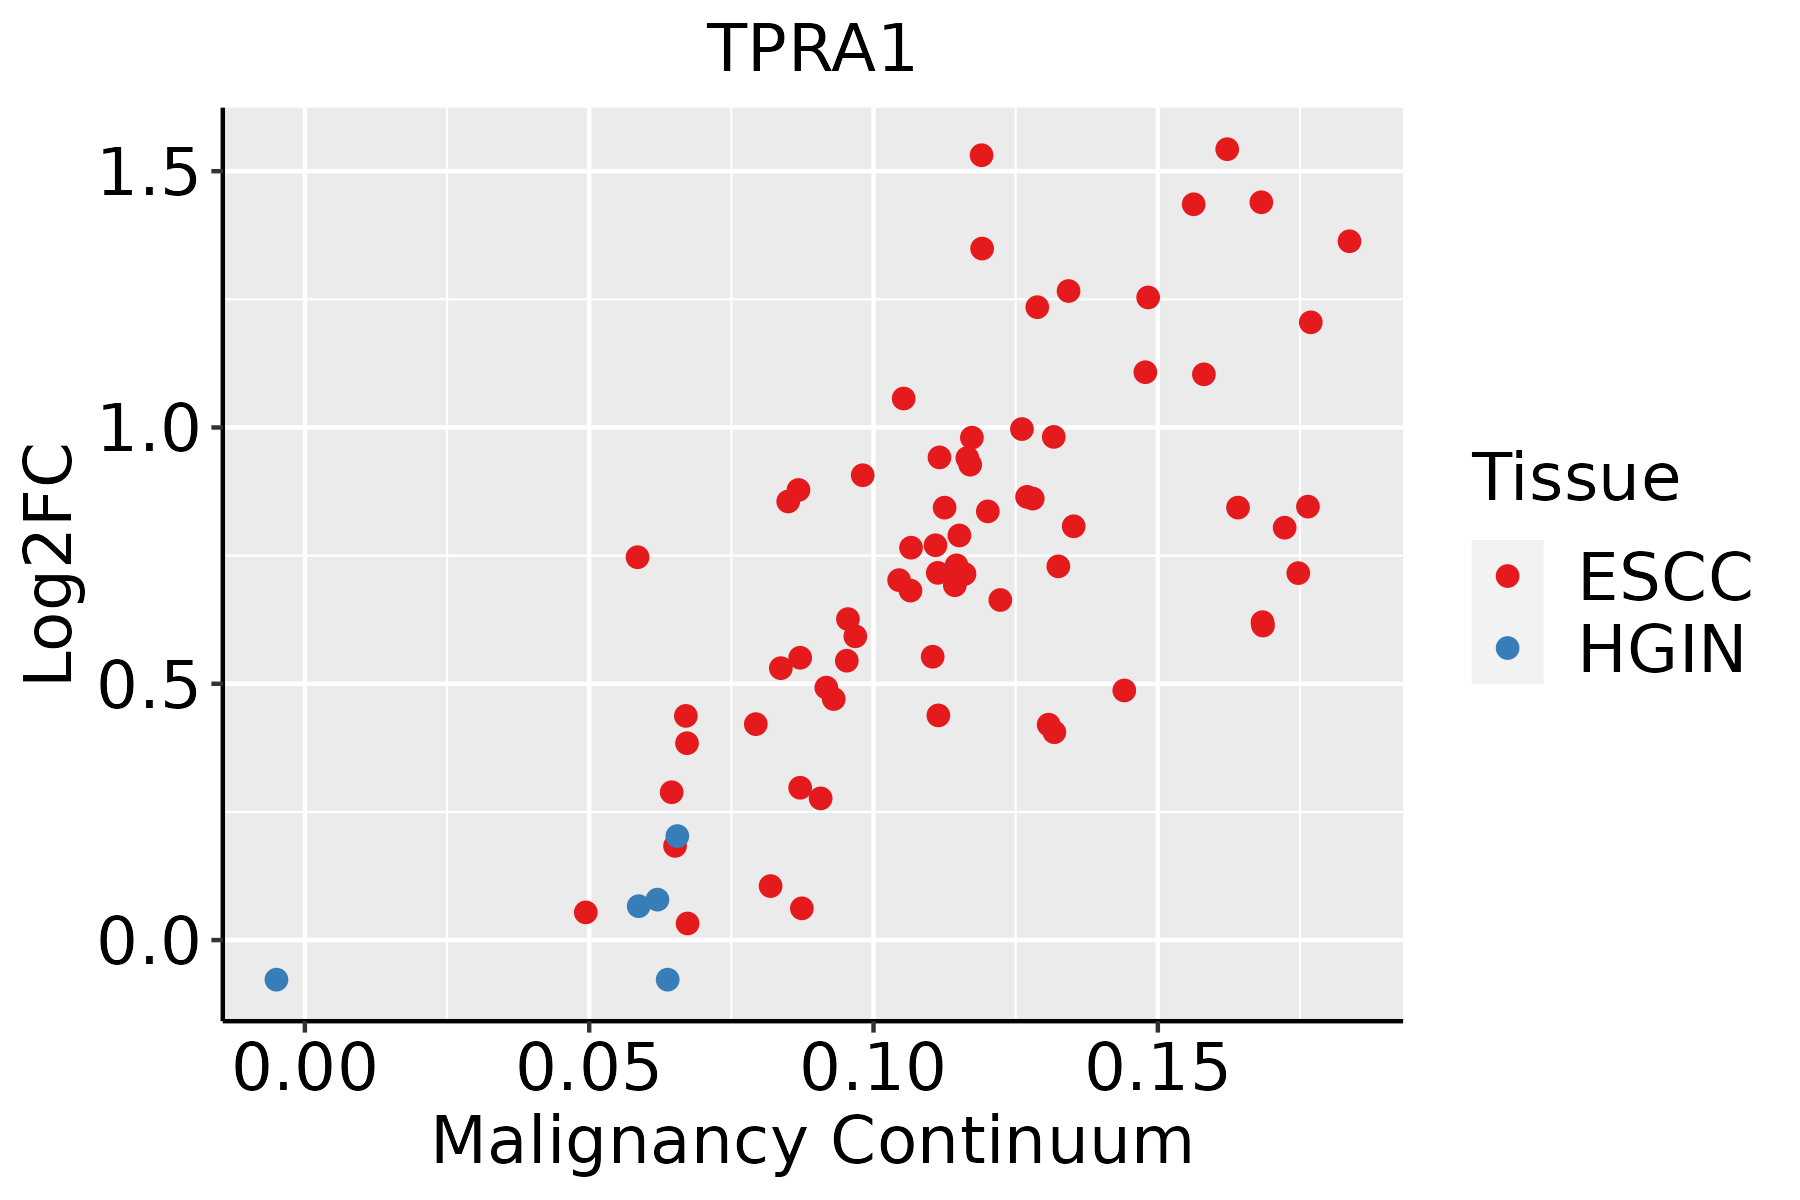 | ESCC: Esophageal squamous cell carcinoma |
| HGIN: High-grade intraepithelial neoplasias | ||
| LGIN: Low-grade intraepithelial neoplasias | ||
| Liver | 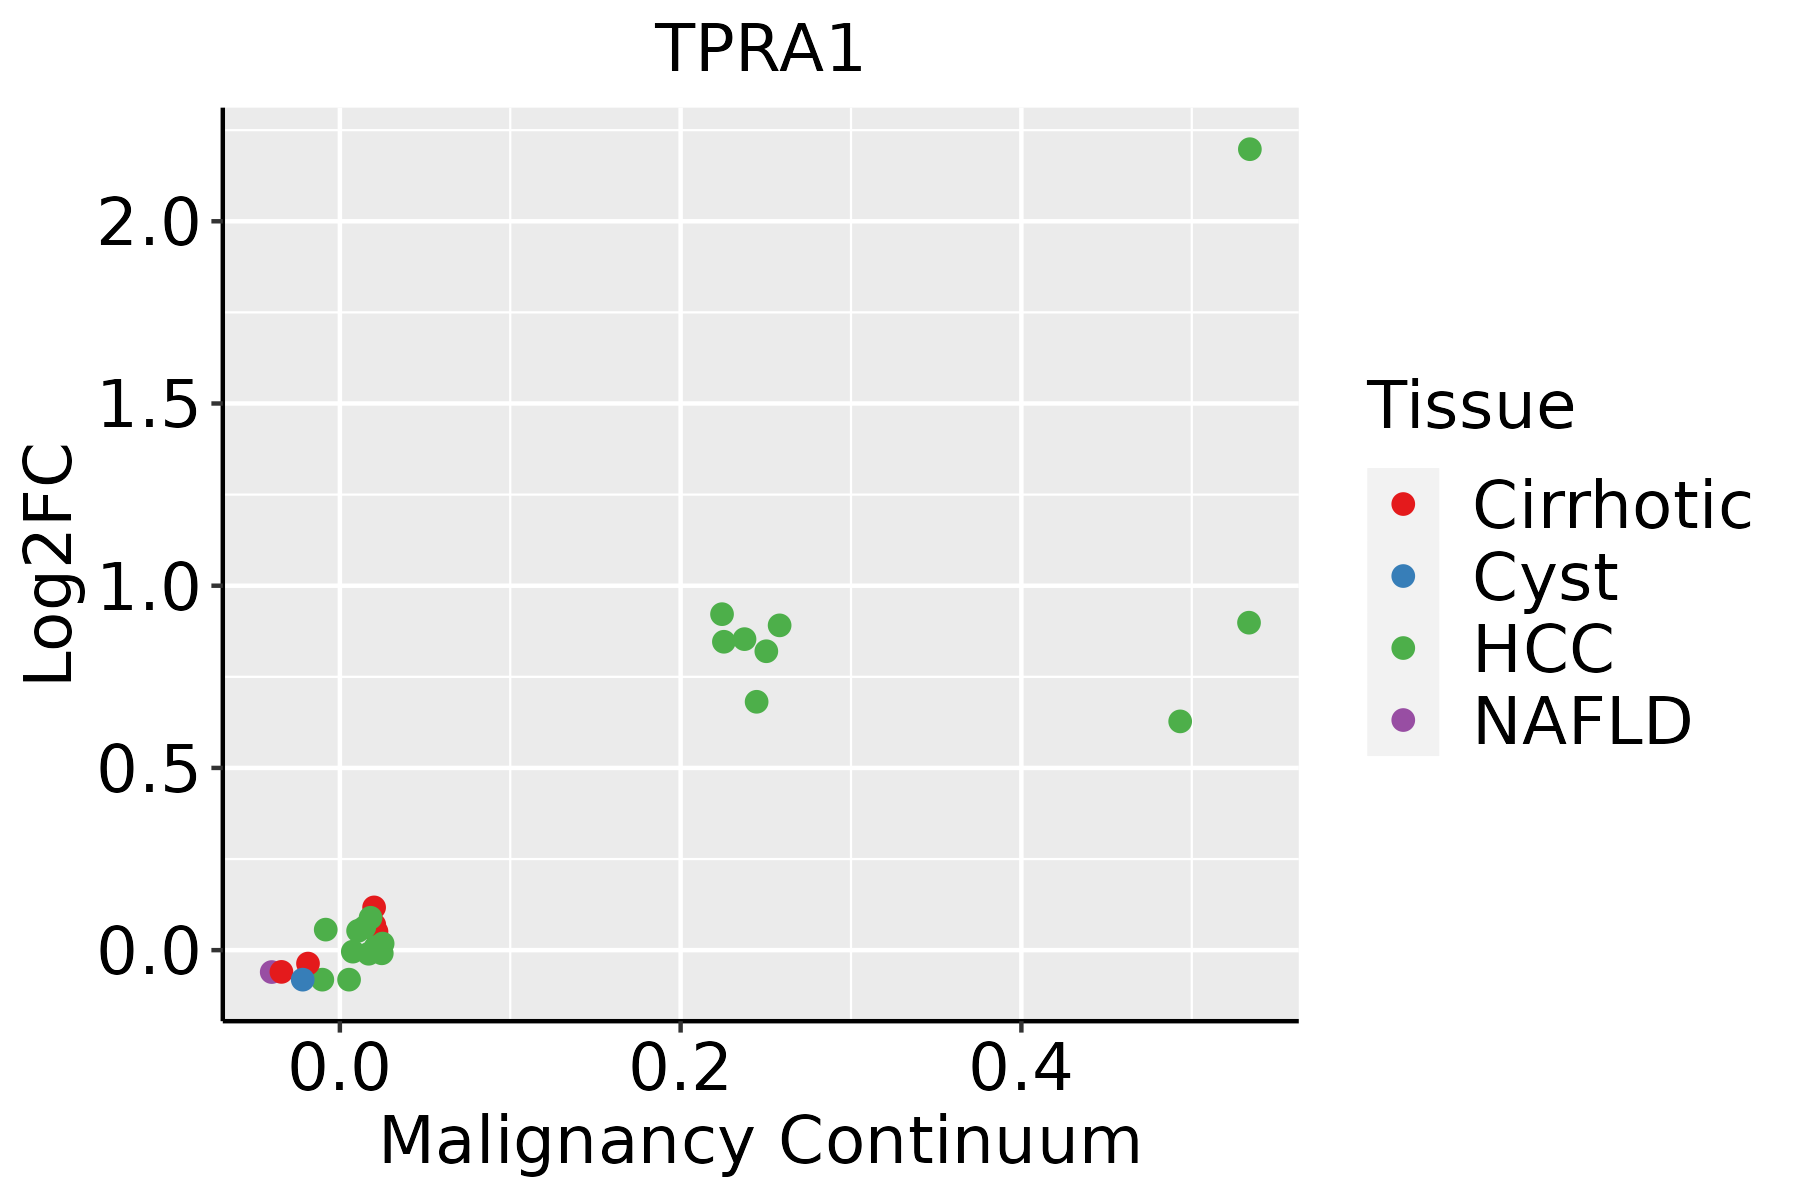 | HCC: Hepatocellular carcinoma |
| NAFLD: Non-alcoholic fatty liver disease | ||
| Oral Cavity |  | EOLP: Erosive Oral lichen planus |
| LP: leukoplakia | ||
| NEOLP: Non-erosive oral lichen planus | ||
| OSCC: Oral squamous cell carcinoma |
| ∗log2FC in expression of this searched gene in stem-like cells from each diseased tissue sample relative to stem-like cells in normal samples in each tissue plotted against the malignancy continuum. Samples are colored based on if they are from different disease stage. |
Top |
Malignant transformation related pathway analysis |
| Find out the enriched GO biological processes and KEGG pathways involved in transition from healthy to precancer to cancer |
| Tissue | Disease Stage | Enriched GO biological Processes |
| Colorectum | AD |  |
| Colorectum | SER |  |
| Colorectum | MSS |  |
| Colorectum | MSI-H |  |
| Colorectum | FAP |  |
| ∗Top 15 enriched GO BP terms are showed in the bar plot of each disease state in each tissue. Each row represents a significant GO biological process which is colored according to the -log10(p.adjust). |
| Page: 1 2 3 4 5 6 7 8 9 |
| GO ID | Tissue | Disease Stage | Description | Gene Ratio | Bg Ratio | pvalue | p.adjust | Count |
| GO:004477216 | Esophagus | ESCC | mitotic cell cycle phase transition | 281/8552 | 424/18723 | 4.63e-18 | 4.45e-16 | 281 |
| GO:000734615 | Esophagus | ESCC | regulation of mitotic cell cycle | 293/8552 | 457/18723 | 8.00e-16 | 5.64e-14 | 293 |
| GO:190198713 | Esophagus | ESCC | regulation of cell cycle phase transition | 242/8552 | 390/18723 | 3.86e-11 | 1.26e-09 | 242 |
| GO:190199013 | Esophagus | ESCC | regulation of mitotic cell cycle phase transition | 191/8552 | 299/18723 | 1.35e-10 | 3.94e-09 | 191 |
| GO:00457865 | Esophagus | ESCC | negative regulation of cell cycle | 236/8552 | 385/18723 | 3.62e-10 | 9.93e-09 | 236 |
| GO:000756820 | Esophagus | ESCC | aging | 201/8552 | 339/18723 | 2.64e-07 | 3.94e-06 | 201 |
| GO:00109484 | Esophagus | ESCC | negative regulation of cell cycle process | 177/8552 | 294/18723 | 3.26e-07 | 4.59e-06 | 177 |
| GO:19019883 | Esophagus | ESCC | negative regulation of cell cycle phase transition | 151/8552 | 249/18723 | 1.28e-06 | 1.57e-05 | 151 |
| GO:004593013 | Esophagus | ESCC | negative regulation of mitotic cell cycle | 143/8552 | 235/18723 | 1.84e-06 | 2.15e-05 | 143 |
| GO:190199113 | Esophagus | ESCC | negative regulation of mitotic cell cycle phase transition | 112/8552 | 179/18723 | 3.69e-06 | 4.03e-05 | 112 |
| GO:00073463 | Liver | Cirrhotic | regulation of mitotic cell cycle | 154/4634 | 457/18723 | 8.73e-06 | 1.29e-04 | 154 |
| GO:000756812 | Liver | Cirrhotic | aging | 117/4634 | 339/18723 | 3.13e-05 | 3.91e-04 | 117 |
| GO:00447721 | Liver | Cirrhotic | mitotic cell cycle phase transition | 139/4634 | 424/18723 | 1.02e-04 | 1.06e-03 | 139 |
| GO:1901990 | Liver | Cirrhotic | regulation of mitotic cell cycle phase transition | 100/4634 | 299/18723 | 4.13e-04 | 3.41e-03 | 100 |
| GO:00447722 | Liver | HCC | mitotic cell cycle phase transition | 240/7958 | 424/18723 | 2.47e-09 | 6.84e-08 | 240 |
| GO:000734611 | Liver | HCC | regulation of mitotic cell cycle | 255/7958 | 457/18723 | 4.96e-09 | 1.30e-07 | 255 |
| GO:19019901 | Liver | HCC | regulation of mitotic cell cycle phase transition | 167/7958 | 299/18723 | 1.96e-06 | 2.71e-05 | 167 |
| GO:19019871 | Liver | HCC | regulation of cell cycle phase transition | 211/7958 | 390/18723 | 2.11e-06 | 2.89e-05 | 211 |
| GO:000756822 | Liver | HCC | aging | 185/7958 | 339/18723 | 4.28e-06 | 5.50e-05 | 185 |
| GO:0045786 | Liver | HCC | negative regulation of cell cycle | 204/7958 | 385/18723 | 1.84e-05 | 1.99e-04 | 204 |
| Page: 1 2 3 |
| Pathway ID | Tissue | Disease Stage | Description | Gene Ratio | Bg Ratio | pvalue | p.adjust | qvalue | Count |
| Page: 1 |
Top |
Cell-cell communication analysis |
| Identification of potential cell-cell interactions between two cell types and their ligand-receptor pairs for different disease states |
| Ligand | Receptor | LRpair | Pathway | Tissue | Disease Stage |
| Page: 1 |
Top |
Single-cell gene regulatory network inference analysis |
| Find out the significant the regulons (TFs) and the target genes of each regulon across cell types for different disease states |
| TF | Cell Type | Tissue | Disease Stage | Target Gene | RSS | Regulon Activity |
| ∗The dot plots of a searched regulon are shown for all cell subpopulations in each disease state of each tissue based on the regulon specific score inferred using pySCENIC and by calculating the average expression. |
| Page: 1 |
Top |
Somatic mutation of malignant transformation related genes |
| Annotation of somatic variants for genes involved in malignant transformation |
| Hugo Symbol | Variant Class | Variant Classification | dbSNP RS | HGVSc | HGVSp | HGVSp Short | SWISSPROT | BIOTYPE | SIFT | PolyPhen | Tumor Sample Barcode | Tissue | Histology | Sex | Age | Stage | Therapy Types | Drugs | Outcome |
| TPRA1 | insertion | Frame_Shift_Ins | novel | c.195_196insGGTACTAGAGGGGAGGGGAATGGATGCTGGGTGGGGAAAATGCCCA | p.Pro66GlyfsTer64 | p.P66Gfs*64 | Q86W33 | protein_coding | TCGA-A2-A0CP-01 | Breast | breast invasive carcinoma | Female | <65 | I/II | Chemotherapy | cytoxan | SD | ||
| TPRA1 | SNV | Missense_Mutation | novel | c.677G>T | p.Arg226Met | p.R226M | Q86W33 | protein_coding | tolerated(0.07) | probably_damaging(0.923) | TCGA-2W-A8YY-01 | Cervix | cervical & endocervical cancer | Female | <65 | I/II | Chemotherapy | cisplatin | CR |
| TPRA1 | SNV | Missense_Mutation | c.1046A>G | p.Asp349Gly | p.D349G | Q86W33 | protein_coding | deleterious(0.02) | probably_damaging(0.989) | TCGA-CK-4951-01 | Colorectum | colon adenocarcinoma | Female | >=65 | I/II | Unknown | Unknown | PD | |
| TPRA1 | SNV | Missense_Mutation | rs755524151 | c.656G>A | p.Arg219His | p.R219H | Q86W33 | protein_coding | deleterious(0.01) | probably_damaging(0.979) | TCGA-CK-4951-01 | Colorectum | colon adenocarcinoma | Female | >=65 | I/II | Unknown | Unknown | PD |
| TPRA1 | SNV | Missense_Mutation | c.577N>C | p.Phe193Leu | p.F193L | Q86W33 | protein_coding | tolerated(0.06) | probably_damaging(0.992) | TCGA-CK-6746-01 | Colorectum | colon adenocarcinoma | Female | >=65 | I/II | Unknown | Unknown | SD | |
| TPRA1 | SNV | Missense_Mutation | c.164N>C | p.Val55Ala | p.V55A | Q86W33 | protein_coding | tolerated(0.15) | benign(0.1) | TCGA-CM-5861-01 | Colorectum | colon adenocarcinoma | Female | <65 | I/II | Unknown | Unknown | PD | |
| TPRA1 | SNV | Missense_Mutation | rs770480334 | c.209N>T | p.Ala70Val | p.A70V | Q86W33 | protein_coding | tolerated(0.32) | probably_damaging(0.965) | TCGA-AJ-A3BH-01 | Endometrium | uterine corpus endometrioid carcinoma | Female | Unknown | I/II | Unknown | Unknown | SD |
| TPRA1 | SNV | Missense_Mutation | c.1025N>A | p.Gly342Asp | p.G342D | Q86W33 | protein_coding | deleterious(0.02) | benign(0.129) | TCGA-AP-A0LD-01 | Endometrium | uterine corpus endometrioid carcinoma | Female | <65 | I/II | Unknown | Unknown | SD | |
| TPRA1 | SNV | Missense_Mutation | novel | c.565G>A | p.Gly189Arg | p.G189R | Q86W33 | protein_coding | deleterious(0) | probably_damaging(1) | TCGA-AP-A1DK-01 | Endometrium | uterine corpus endometrioid carcinoma | Female | <65 | I/II | Unknown | Unknown | SD |
| TPRA1 | SNV | Missense_Mutation | rs377393713 | c.572N>A | p.Arg191His | p.R191H | Q86W33 | protein_coding | deleterious(0.03) | probably_damaging(0.973) | TCGA-AX-A1C4-01 | Endometrium | uterine corpus endometrioid carcinoma | Female | <65 | I/II | Unknown | Unknown | SD |
| Page: 1 2 3 4 |
Top |
Related drugs of malignant transformation related genes |
| Identification of chemicals and drugs interact with genes involved in malignant transfromation |
| (DGIdb 4.0) |
| Entrez ID | Symbol | Category | Interaction Types | Drug Claim Name | Drug Name | PMIDs |
| Page: 1 |

Copyright 2023-Present -The University of Texas Health Science Center at Houston |