Schematic overview of the cellular and molecular mechanisms involved in the cancer progression, including the proposed cellular and molecular mechanisms in cancer cells trajectory. AT1: alveolar type 1 cells; AT2: alveolar type 2 cells; AAH: atypical adenomatous hyperplasia; AIS: adenocarcinoma in situ; MIA: minimally invasive adenocarcinoma; IA: invasive adenocarcinoma; EMT: epithelial-mesenchymal transition

Home

Download

Statistics

Help

Contact

Center for Computational Systems Medicine
leaf

Gene summary

leaf

Malignant transformation analysis

leaf

Malignant transformation related pathway analysis

leaf

Cell-cell communication analysis

leaf

Single-cell gene regulatory network inference analysis

leaf

Somatic mutation of malignant transformation related genes

leaf

Related drugs of malignant transformation related genes

Gene: TPR

Gene summary for TPR

check button Gene summary.

Gene informationSpeciesHuman
Gene symbol

TPR

Gene ID

7175

Gene nametranslocated promoter region, nuclear basket protein
Gene AliasTPR
Cytomap1q31.1
Gene Typeprotein-coding
GO ID

GO:0000070

UniProtAcc

P12270


Top

Malignant transformation analysis

check button Identification of the aberrant gene expression in precancerous and cancerous lesions by comparing the gene expression of stem-like cells in diseased tissues with normal stem cells
check button Malignant transformation involving gene list.
Entrez IDSymbolReplicatesSpeciesOrganTissueAdj P-valueLog2FCMalignancy
7175TPRHTA11_3410_2000001011HumanColorectumAD7.41e-22-5.92e-010.0155
7175TPRHTA11_2487_2000001011HumanColorectumSER7.21e-05-4.42e-01-0.1808
7175TPRHTA11_1938_2000001011HumanColorectumAD1.02e-03-3.99e-01-0.0811
7175TPRHTA11_3361_2000001011HumanColorectumAD4.74e-08-5.56e-01-0.1207
7175TPRHTA11_696_2000001011HumanColorectumAD8.24e-04-3.73e-01-0.1464
7175TPRHTA11_866_2000001011HumanColorectumAD7.56e-06-4.02e-01-0.1001
7175TPRHTA11_866_3004761011HumanColorectumAD3.10e-12-5.06e-010.096
7175TPRHTA11_9408_2000001011HumanColorectumAD1.12e-02-6.30e-010.0451
7175TPRHTA11_8622_2000001021HumanColorectumSER4.99e-02-5.13e-010.0528
7175TPRHTA11_10711_2000001011HumanColorectumAD3.95e-04-4.47e-010.0338
7175TPRHTA11_6818_2000001011HumanColorectumAD2.46e-02-4.87e-010.0112
7175TPRHTA11_6818_2000001021HumanColorectumAD3.23e-03-4.48e-010.0588
7175TPRHTA11_99999970781_79442HumanColorectumMSS1.52e-10-4.44e-010.294
7175TPRHTA11_99999971662_82457HumanColorectumMSS5.85e-09-4.25e-010.3859
7175TPRHTA11_99999973899_84307HumanColorectumMSS8.10e-07-5.82e-010.2585
7175TPRHTA11_99999974143_84620HumanColorectumMSS1.32e-06-3.94e-010.3005
7175TPRA001-C-207HumanColorectumFAP1.63e-021.85e-010.1278
7175TPRA015-C-203HumanColorectumFAP7.81e-227.40e-02-0.1294
7175TPRA015-C-204HumanColorectumFAP4.23e-056.65e-02-0.0228
7175TPRA014-C-040HumanColorectumFAP2.65e-03-3.36e-02-0.1184
Page: 1 2 3 4 5 6 7 8 9 10 11 12 

check button Transcriptomic changes along malignancy continuum.
TissueExpression DynamicsAbbreviation
Colorectum (GSE201348)The image shows the transcriptomic changes along malignancy continuum.log2FC in expression of this searched gene in stem-like cells from each diseased tissue sample relative to stem-like cells in normal samples in each tissue plotted against the malignancy continuum. Samples are colored based on if they are from different disease stage.FAP: Familial adenomatous polyposis
CRC: Colorectal cancer
Colorectum (HTA11)The image shows the transcriptomic changes along malignancy continuum.log2FC in expression of this searched gene in stem-like cells from each diseased tissue sample relative to stem-like cells in normal samples in each tissue plotted against the malignancy continuum. Samples are colored based on if they are from different disease stage.AD: Adenomas
SER: Sessile serrated lesions
MSI-H: Microsatellite-high colorectal cancer
MSS: Microsatellite stable colorectal cancer
EndometriumThe image shows the transcriptomic changes along malignancy continuum.log2FC in expression of this searched gene in stem-like cells from each diseased tissue sample relative to stem-like cells in normal samples in each tissue plotted against the malignancy continuum. Samples are colored based on if they are from different disease stage.
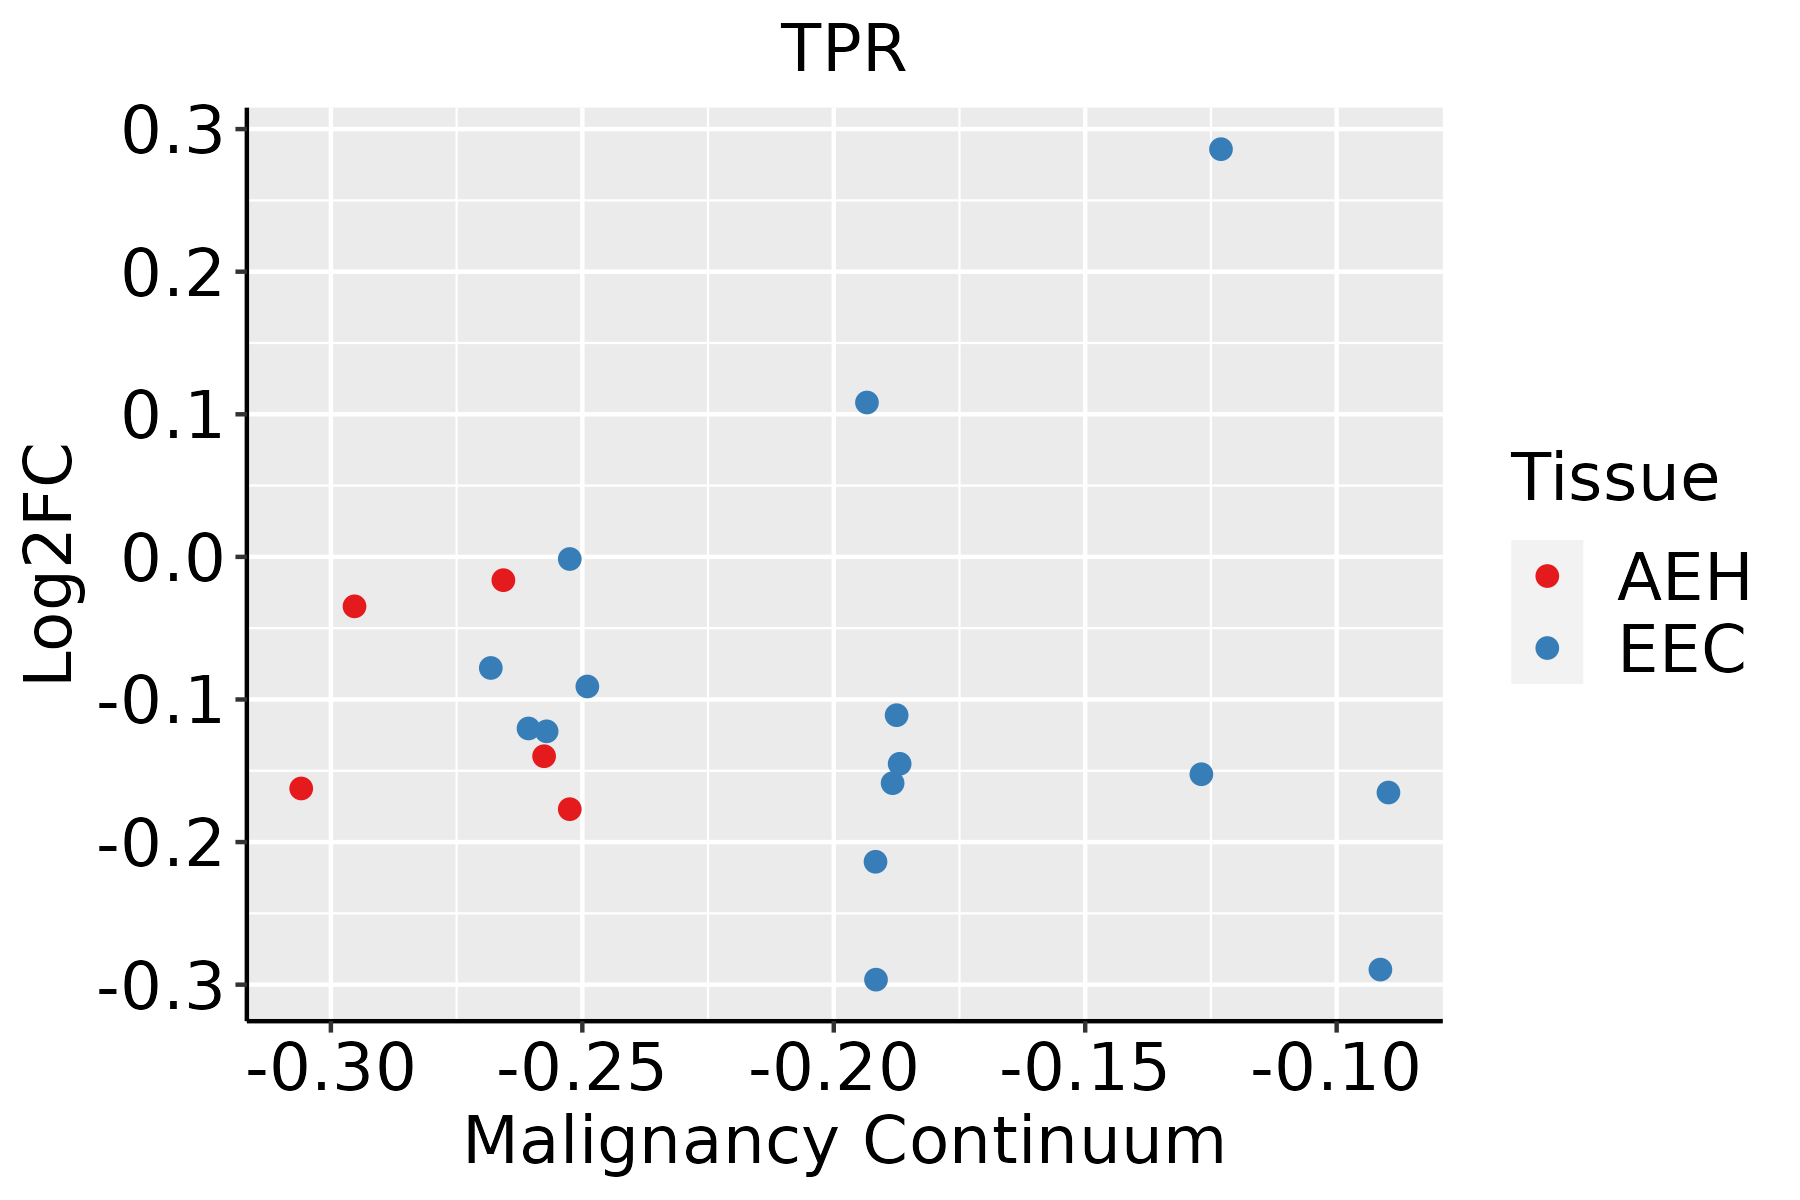
AEH: Atypical endometrial hyperplasia
EEC: Endometrioid Cancer
EsophagusThe image shows the transcriptomic changes along malignancy continuum.log2FC in expression of this searched gene in stem-like cells from each diseased tissue sample relative to stem-like cells in normal samples in each tissue plotted against the malignancy continuum. Samples are colored based on if they are from different disease stage.ESCC: Esophageal squamous cell carcinoma
HGIN: High-grade intraepithelial neoplasias
LGIN: Low-grade intraepithelial neoplasias
LiverThe image shows the transcriptomic changes along malignancy continuum.log2FC in expression of this searched gene in stem-like cells from each diseased tissue sample relative to stem-like cells in normal samples in each tissue plotted against the malignancy continuum. Samples are colored based on if they are from different disease stage.
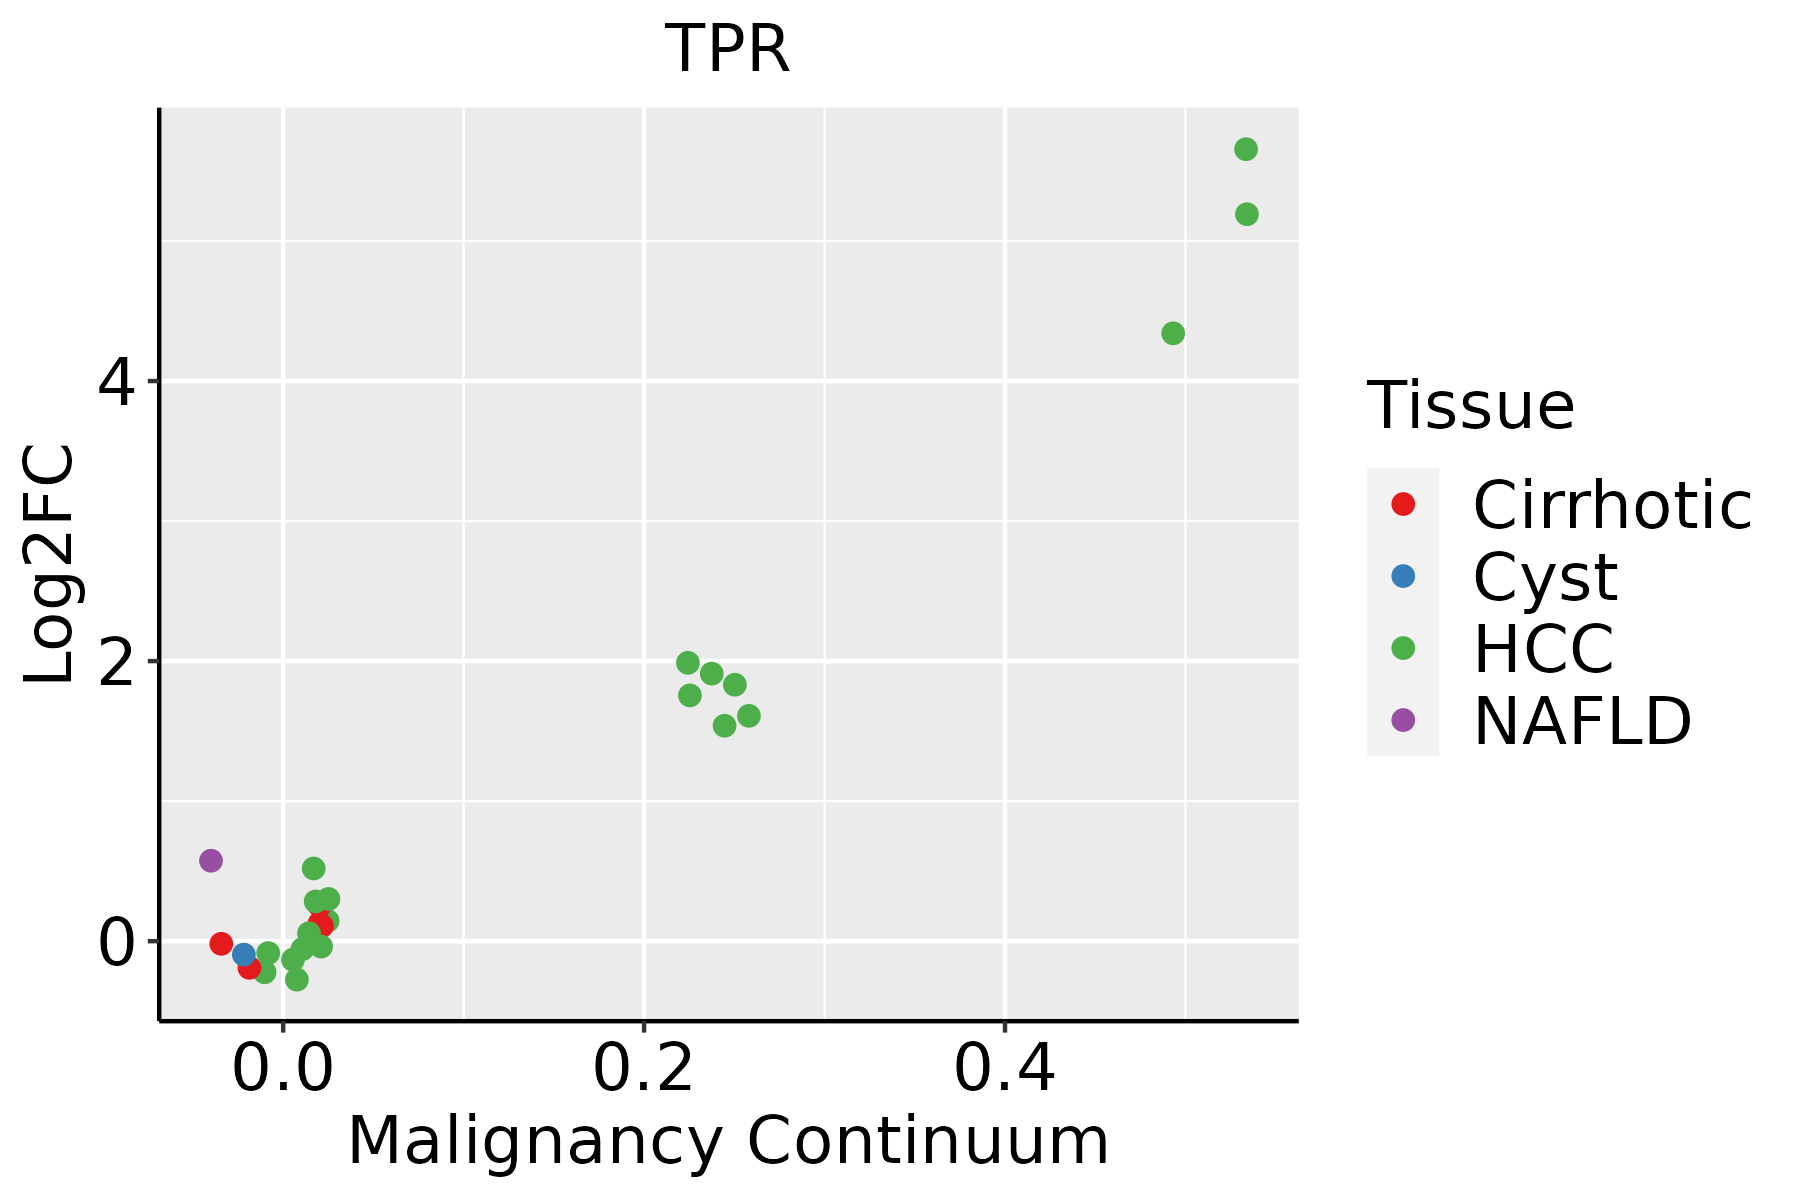
HCC: Hepatocellular carcinoma
NAFLD: Non-alcoholic fatty liver disease
LungThe image shows the transcriptomic changes along malignancy continuum.log2FC in expression of this searched gene in stem-like cells from each diseased tissue sample relative to stem-like cells in normal samples in each tissue plotted against the malignancy continuum. Samples are colored based on if they are from different disease stage.AAH: Atypical adenomatous hyperplasia
AIS: Adenocarcinoma in situ
IAC: Invasive lung adenocarcinoma
MIA: Minimally invasive adenocarcinoma
Oral CavityThe image shows the transcriptomic changes along malignancy continuum.log2FC in expression of this searched gene in stem-like cells from each diseased tissue sample relative to stem-like cells in normal samples in each tissue plotted against the malignancy continuum. Samples are colored based on if they are from different disease stage.
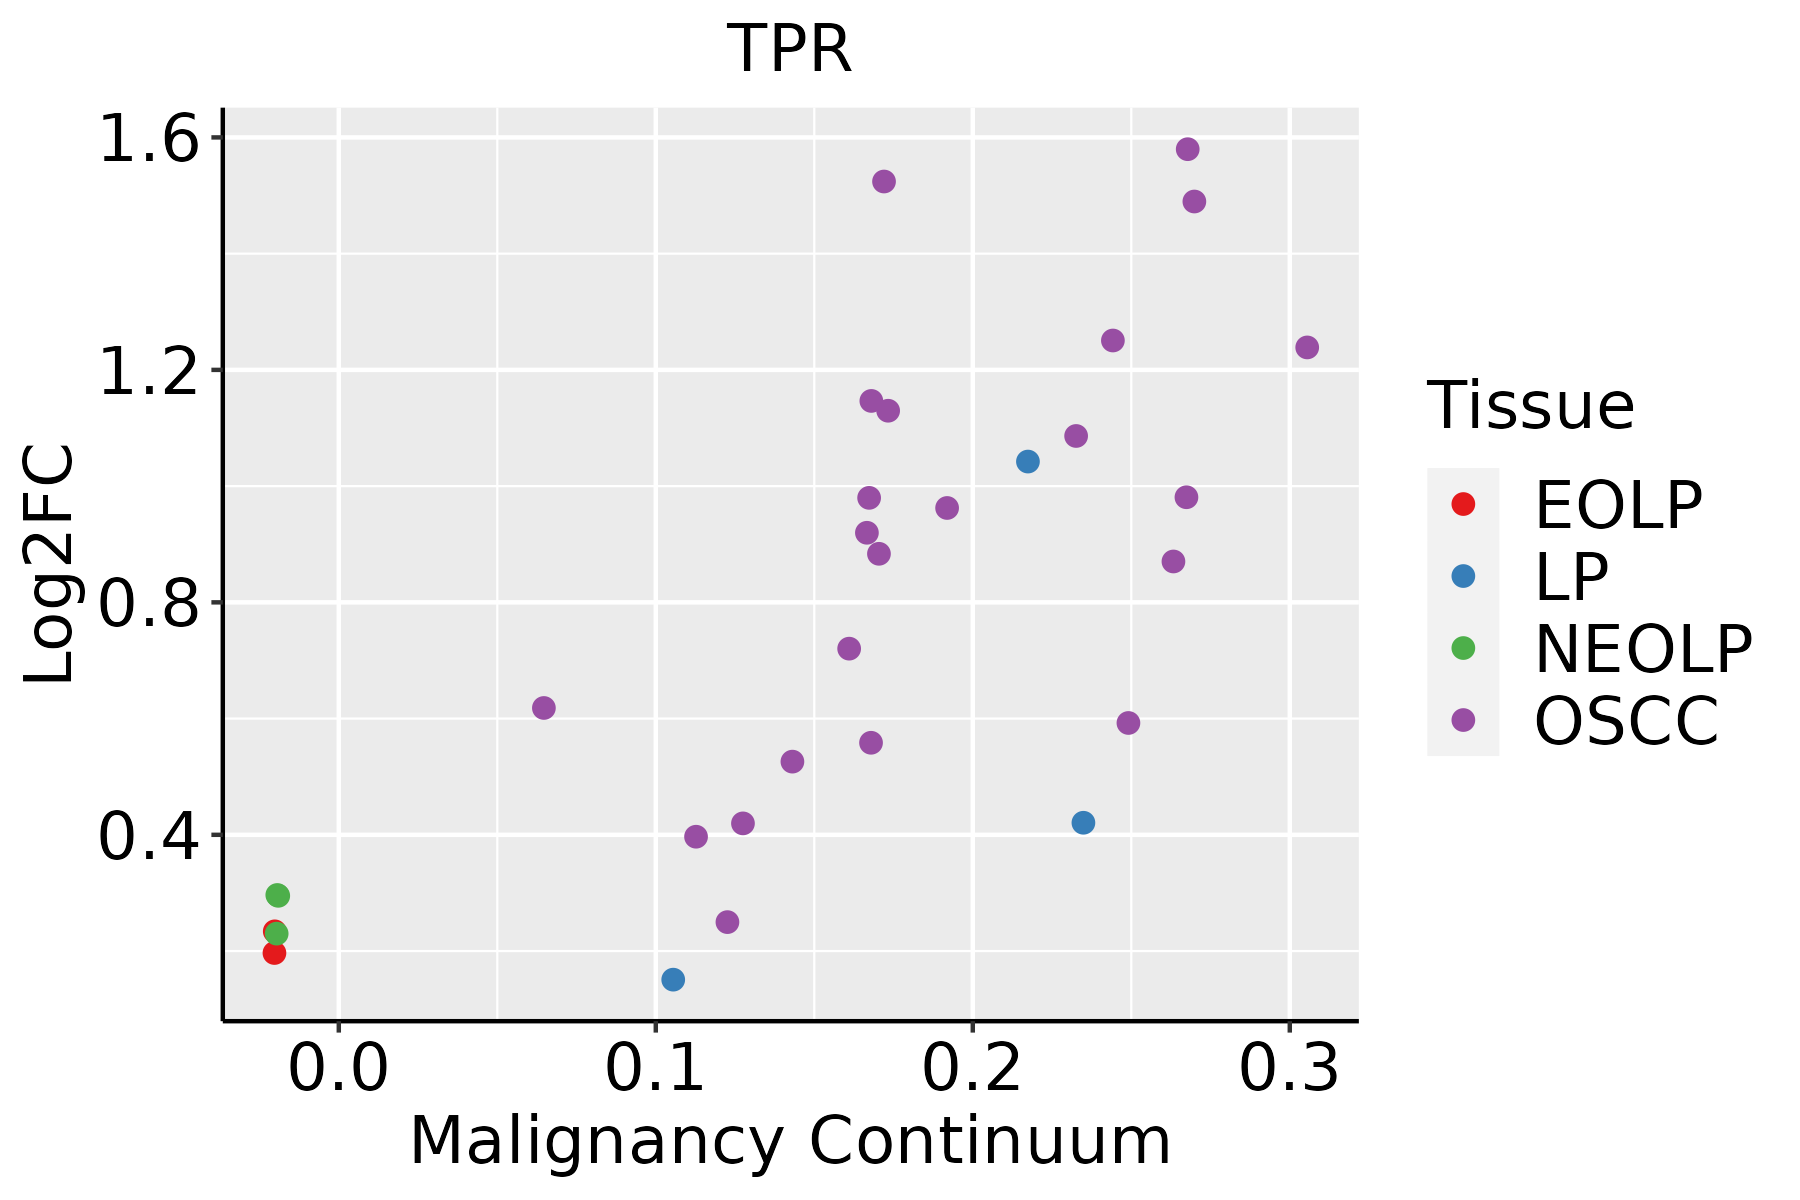
EOLP: Erosive Oral lichen planus
LP: leukoplakia
NEOLP: Non-erosive oral lichen planus
OSCC: Oral squamous cell carcinoma
ProstateThe image shows the transcriptomic changes along malignancy continuum.log2FC in expression of this searched gene in stem-like cells from each diseased tissue sample relative to stem-like cells in normal samples in each tissue plotted against the malignancy continuum. Samples are colored based on if they are from different disease stage.BPH: Benign Prostatic Hyperplasia
SkinThe image shows the transcriptomic changes along malignancy continuum.log2FC in expression of this searched gene in stem-like cells from each diseased tissue sample relative to stem-like cells in normal samples in each tissue plotted against the malignancy continuum. Samples are colored based on if they are from different disease stage.
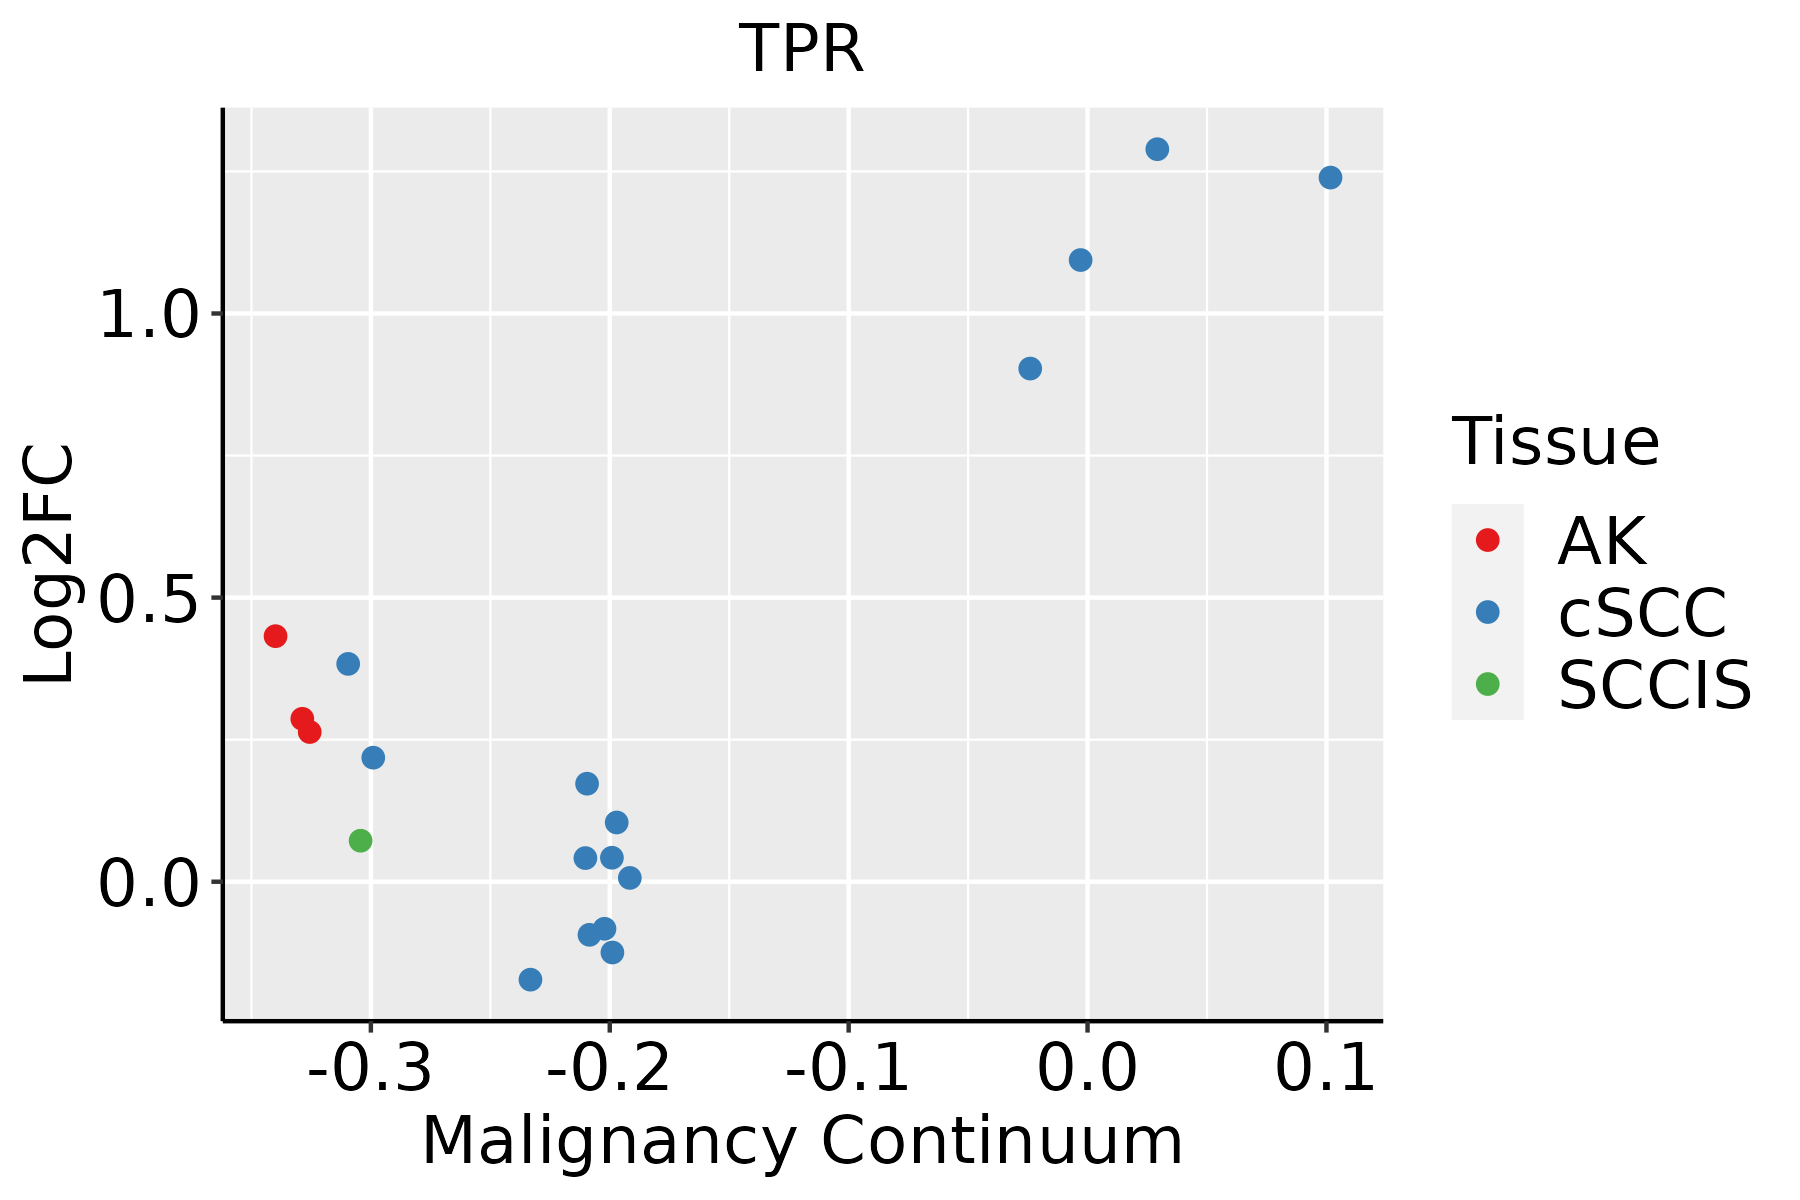
AK: Actinic keratosis
cSCC: Cutaneous squamous cell carcinoma
SCCIS:squamous cell carcinoma in situ
ThyroidThe image shows the transcriptomic changes along malignancy continuum.log2FC in expression of this searched gene in stem-like cells from each diseased tissue sample relative to stem-like cells in normal samples in each tissue plotted against the malignancy continuum. Samples are colored based on if they are from different disease stage.ATC: Anaplastic thyroid cancer
HT: Hashimoto's thyroiditis
PTC: Papillary thyroid cancer
∗log2FC in expression of this searched gene in stem-like cells from each diseased tissue sample relative to stem-like cells in normal samples in each tissue plotted against the malignancy continuum. Samples are colored based on if they are from different disease stage.

Top

Malignant transformation related pathway analysis

check buttonFind out the enriched GO biological processes and KEGG pathways involved in transition from healthy to precancer to cancer
check button Figure of enriched GO biological processes.
TissueDisease StageEnriched GO biological Processes
ColorectumADGO analysis - Figure of enriched GO biological processes: Top 15 enriched GO BP terms are showed in the bar plot of each disease state in each tissue. Each row represents a significant GO biological process which is colored according to the -log10(p.adjust).
ColorectumSERGO analysis - Figure of enriched GO biological processes: Top 15 enriched GO BP terms are showed in the bar plot of each disease state in each tissue. Each row represents a significant GO biological process which is colored according to the -log10(p.adjust).
ColorectumMSSGO analysis - Figure of enriched GO biological processes: Top 15 enriched GO BP terms are showed in the bar plot of each disease state in each tissue. Each row represents a significant GO biological process which is colored according to the -log10(p.adjust).
ColorectumMSI-HGO analysis - Figure of enriched GO biological processes: Top 15 enriched GO BP terms are showed in the bar plot of each disease state in each tissue. Each row represents a significant GO biological process which is colored according to the -log10(p.adjust).
ColorectumFAPGO analysis - Figure of enriched GO biological processes: Top 15 enriched GO BP terms are showed in the bar plot of each disease state in each tissue. Each row represents a significant GO biological process which is colored according to the -log10(p.adjust).
∗Top 15 enriched GO BP terms are showed in the bar plot of each disease state in each tissue. Each row represents a significant GO biological process which is colored according to the -log10(p.adjust).
Page: 1 2 3 4 5 6 7 8 9 

check button Enriched GO biological processes.
GO IDTissueDisease StageDescriptionGene RatioBg Ratiopvaluep.adjustCount
GO:00510989BreastPrecancerregulation of binding44/1080363/187232.59e-068.65e-0544
GO:00310995BreastPrecancerregeneration25/1080198/187231.91e-043.06e-0325
GO:00511008BreastPrecancernegative regulation of binding19/1080162/187232.56e-032.32e-0219
GO:19030348BreastPrecancerregulation of response to wounding19/1080167/187233.60e-032.98e-0219
GO:200123314BreastIDCregulation of apoptotic signaling pathway82/1434356/187236.27e-205.93e-1782
GO:200123514BreastIDCpositive regulation of apoptotic signaling pathway31/1434126/187234.13e-093.35e-0731
GO:009719114BreastIDCextrinsic apoptotic signaling pathway42/1434219/187232.56e-081.73e-0642
GO:200123614BreastIDCregulation of extrinsic apoptotic signaling pathway32/1434151/187231.07e-076.26e-0632
GO:005109814BreastIDCregulation of binding57/1434363/187231.59e-078.76e-0657
GO:004578514BreastIDCpositive regulation of cell adhesion62/1434437/187231.70e-067.16e-0562
GO:005165114BreastIDCmaintenance of location in cell37/1434214/187232.39e-069.35e-0537
GO:001033211BreastIDCresponse to gamma radiation16/143456/187232.84e-061.08e-0416
GO:001021213BreastIDCresponse to ionizing radiation28/1434148/187236.85e-062.09e-0428
GO:000931412BreastIDCresponse to radiation62/1434456/187236.91e-062.10e-0462
GO:005123513BreastIDCmaintenance of location48/1434327/187239.90e-062.77e-0448
GO:004211012BreastIDCT cell activation64/1434487/187231.49e-053.77e-0464
GO:005086311BreastIDCregulation of T cell activation47/1434329/187232.49e-055.91e-0447
GO:000181911BreastIDCpositive regulation of cytokine production61/1434467/187232.81e-056.58e-0461
GO:005087011BreastIDCpositive regulation of T cell activation34/1434216/187234.59e-051.03e-0334
GO:007149614BreastIDCcellular response to external stimulus45/1434320/187235.40e-051.15e-0345
Page: 1 2 3 4 5 6 7 8 9 10 11 12 13 14 15 16 17 18 19 20 21 22 23 24 25 26 27 28 29 30 31 32 33 34 35 36 37 38 39 40 41 42 43 44 45 46 47 48 49 50 51 52 53 54 55 56 57 58 59 60 61 62 63 64 65 66 67 68 69 70 71 72 73 74 75 76 77 78 79 80 81 82 83 84 85 86 87 88 89 90 91 92 93 94 95 96 97 98 99 100 101 102 103 104 105 106 107 108 109 110 111 112 113 114 115 116 117 118 119 120 121 122 123 124 125 126 127 128 129 130 131 132 133 134 135 136 137 138 139 140 141 142 143 144 145 146 147 148 149 150 151 152 153 154 155 156 157 158 159 160 161 162 163 164 165 166 167 168 169 170 171 172 173 174 175 176 177 178 179 180 181 182 183 184 185 186 187 188 189 190 191 192 193 194 195 196 197 198 199 200 201 202 203 204 205 206 207 208 209 210 211 212 213 214 215 216 217 218 219 220 221 222 223 224 225 226 227 228 229 230 231 232 233 234 235 236 237 238 239 240 241 242 243 244 245 246 247 248 249 250 251 252 253 254 255 256 257 258 259 260 261 262 263 264 265 266 267 268 269 270 271 272 

check button Enriched KEGG pathways.
Pathway IDTissueDisease StageDescriptionGene RatioBg Ratiopvaluep.adjustqvalueCount
hsa05014ColorectumADAmyotrophic lateral sclerosis164/2092364/84654.28e-181.27e-168.09e-17164
hsa05216ColorectumADThyroid cancer21/209237/84653.05e-052.76e-041.76e-0421
hsa050141ColorectumADAmyotrophic lateral sclerosis164/2092364/84654.28e-181.27e-168.09e-17164
hsa052161ColorectumADThyroid cancer21/209237/84653.05e-052.76e-041.76e-0421
hsa050142ColorectumSERAmyotrophic lateral sclerosis138/1580364/84659.89e-192.99e-172.17e-17138
hsa050143ColorectumSERAmyotrophic lateral sclerosis138/1580364/84659.89e-192.99e-172.17e-17138
hsa050144ColorectumMSSAmyotrophic lateral sclerosis156/1875364/84651.43e-194.62e-182.83e-18156
hsa052162ColorectumMSSThyroid cancer21/187537/84654.98e-066.00e-053.68e-0521
hsa050145ColorectumMSSAmyotrophic lateral sclerosis156/1875364/84651.43e-194.62e-182.83e-18156
hsa052163ColorectumMSSThyroid cancer21/187537/84654.98e-066.00e-053.68e-0521
hsa050148ColorectumFAPAmyotrophic lateral sclerosis91/1404364/84651.84e-052.36e-041.44e-0491
hsa052164ColorectumFAPThyroid cancer12/140437/84651.33e-024.46e-022.71e-0212
hsa050149ColorectumFAPAmyotrophic lateral sclerosis91/1404364/84651.84e-052.36e-041.44e-0491
hsa052165ColorectumFAPThyroid cancer12/140437/84651.33e-024.46e-022.71e-0212
hsa0501420EndometriumAEHAmyotrophic lateral sclerosis123/1197364/84652.17e-227.82e-215.72e-21123
hsa0521610EndometriumAEHThyroid cancer12/119737/84653.68e-032.14e-021.56e-0212
hsa05014110EndometriumAEHAmyotrophic lateral sclerosis123/1197364/84652.17e-227.82e-215.72e-21123
hsa0521615EndometriumAEHThyroid cancer12/119737/84653.68e-032.14e-021.56e-0212
hsa0501425EndometriumEECAmyotrophic lateral sclerosis128/1237364/84659.83e-244.04e-223.01e-22128
hsa0521625EndometriumEECThyroid cancer13/123737/84651.51e-039.55e-037.12e-0313
Page: 1 2 3 4 

Top

Cell-cell communication analysis

check buttonIdentification of potential cell-cell interactions between two cell types and their ligand-receptor pairs for different disease states
LigandReceptorLRpairPathwayTissueDisease Stage
LGALS9PTPRCLGALS9_CD45GALECTINBreastADJ
LGALS9PTPRCLGALS9_CD45GALECTINBreastDCIS
CD22PTPRCCD22_PTPRCCD22BreastDCIS
LGALS9PTPRCLGALS9_CD45GALECTINBreastHealthy
PTPRMPTPRMPTPRM_PTPRMPTPRMBreastHealthy
LGALS9PTPRCLGALS9_CD45GALECTINBreastIDC
CD22PTPRCCD22_PTPRCCD22BreastIDC
LGALS9PTPRCLGALS9_CD45GALECTINCervixADJ
CD22PTPRCCD22_PTPRCCD22CervixADJ
PTPRMPTPRMPTPRM_PTPRMPTPRMCervixADJ
MDKPTPRZ1MDK_PTPRZ1MKCervixCC
PTNPTPRZ1PTN_PTPRZ1PTNCervixCC
LGALS9PTPRCLGALS9_CD45GALECTINCervixCC
PTPRMPTPRMPTPRM_PTPRMPTPRMCervixCC
CD22PTPRCCD22_PTPRCCD22CervixCC
CD22PTPRCCD22_PTPRCCD22CervixHealthy
LGALS9PTPRCLGALS9_CD45GALECTINCervixPrecancer
CD22PTPRCCD22_PTPRCCD22CervixPrecancer
CD22PTPRCCD22_PTPRCCD22CRCAD
PTPRMPTPRMPTPRM_PTPRMPTPRMCRCAD
Page: 1 

Top

Single-cell gene regulatory network inference analysis

check buttonFind out the significant the regulons (TFs) and the target genes of each regulon across cell types for different disease states
TFCell TypeTissueDisease StageTarget GeneRSSRegulon Activity
∗The dot plots of a searched regulon are shown for all cell subpopulations in each disease state of each tissue based on the regulon specific score inferred using pySCENIC and by calculating the average expression.
Page: 1 

Top

Somatic mutation of malignant transformation related genes

check buttonAnnotation of somatic variants for genes involved in malignant transformation
Hugo SymbolVariant ClassVariant ClassificationdbSNP RSHGVScHGVSpHGVSp ShortSWISSPROTBIOTYPESIFTPolyPhenTumor Sample BarcodeTissueHistologySexAgeStageTherapy TypesDrugsOutcome
TPRSNVMissense_Mutationnovelc.1112N>Gp.Ser371Cysp.S371CP12270protein_codingdeleterious(0)possibly_damaging(0.785)TCGA-A2-A0D0-01Breastbreast invasive carcinomaFemale<65I/IIChemotherapycytoxanSD
TPRSNVMissense_Mutationc.4793N>Cp.Arg1598Prop.R1598PP12270protein_codingdeleterious(0)probably_damaging(0.997)TCGA-A2-A0YF-01Breastbreast invasive carcinomaFemale>=65I/IIUnspecificArimidexSD
TPRSNVMissense_Mutationnovelc.2186A>Tp.Gln729Leup.Q729LP12270protein_codingdeleterious(0)probably_damaging(0.977)TCGA-A2-A3XT-01Breastbreast invasive carcinomaFemale<65I/IIChemotherapycyclophosphamidePR
TPRSNVMissense_Mutationc.6664G>Ap.Val2222Metp.V2222MP12270protein_codingdeleterious(0.04)probably_damaging(0.995)TCGA-A8-A06R-01Breastbreast invasive carcinomaFemale>=65I/IIChemotherapy5-fluorouracilCR
TPRSNVMissense_Mutationc.3061N>Cp.Asp1021Hisp.D1021HP12270protein_codingdeleterious(0)benign(0.188)TCGA-A8-A06U-01Breastbreast invasive carcinomaFemale>=65I/IIUnknownUnknownSD
TPRSNVMissense_Mutationc.4888G>Ap.Glu1630Lysp.E1630KP12270protein_codingdeleterious(0.01)probably_damaging(0.985)TCGA-AC-A23H-01Breastbreast invasive carcinomaFemale>=65I/IIUnknownUnknownPD
TPRSNVMissense_Mutationrs533241956c.5459C>Tp.Ser1820Leup.S1820LP12270protein_codingtolerated(0.05)benign(0.288)TCGA-AN-A046-01Breastbreast invasive carcinomaFemale>=65I/IIUnknownUnknownSD
TPRSNVMissense_Mutationc.4647N>Tp.Lys1549Asnp.K1549NP12270protein_codingdeleterious(0)probably_damaging(0.994)TCGA-AN-A0FW-01Breastbreast invasive carcinomaFemale>=65III/IVUnknownUnknownSD
TPRSNVMissense_Mutationnovelc.5465N>Ap.Thr1822Asnp.T1822NP12270protein_codingdeleterious(0)possibly_damaging(0.852)TCGA-AN-A0G0-01Breastbreast invasive carcinomaFemale<65I/IIUnknownUnknownSD
TPRSNVMissense_Mutationnovelc.1503N>Tp.Arg501Serp.R501SP12270protein_codingtolerated(0.19)possibly_damaging(0.838)TCGA-AO-A128-01Breastbreast invasive carcinomaFemale<65I/IIChemotherapydoxorubicinSD
Page: 1 2 3 4 5 6 7 8 9 10 11 12 13 14 15 16 17 18 19 20 21 22 23 24 25 26 27 28 29 30 

Top

Related drugs of malignant transformation related genes

check buttonIdentification of chemicals and drugs interact with genes involved in malignant transfromation
(DGIdb 4.0)
Entrez IDSymbolCategoryInteraction TypesDrug Claim NameDrug NamePMIDs
Page: 1